. 2021 Aug;27(8):1370-1378.
doi: 10.1038/s41591-021-01410-w. Epub 2021 Jun 9.

Impact of vaccination on new SARS-CoV-2 infections in the United Kingdom

Affiliations

Impact of vaccination on new SARS-CoV-2 infections in the United Kingdom

Emma Pritchard et al. Nat Med. 2021 Aug.

Abstract

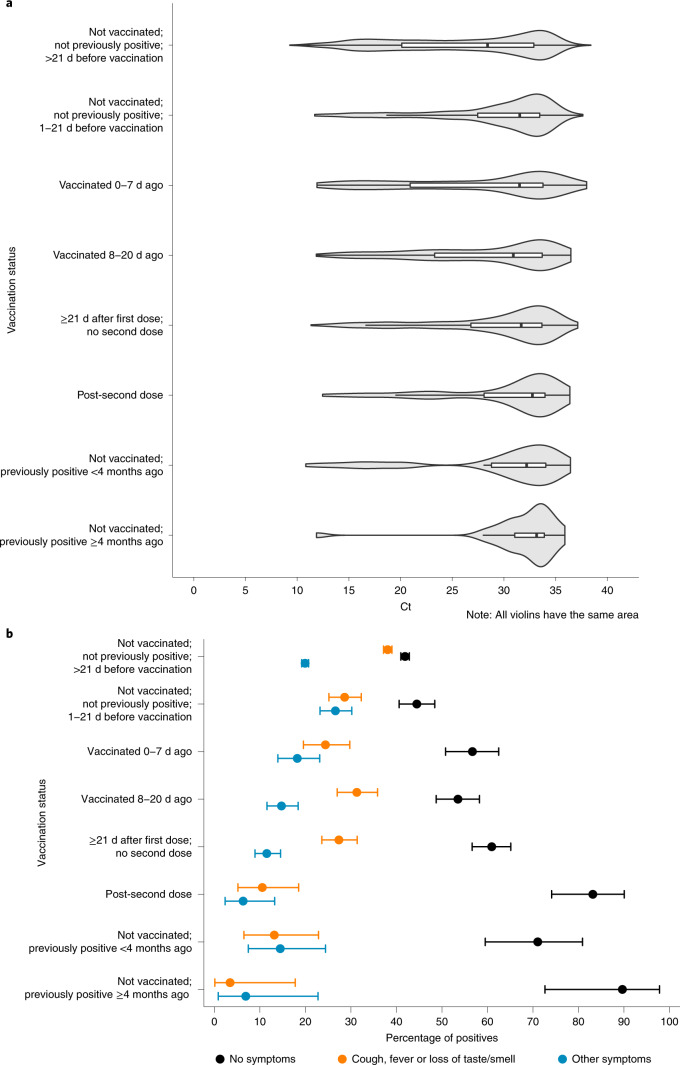
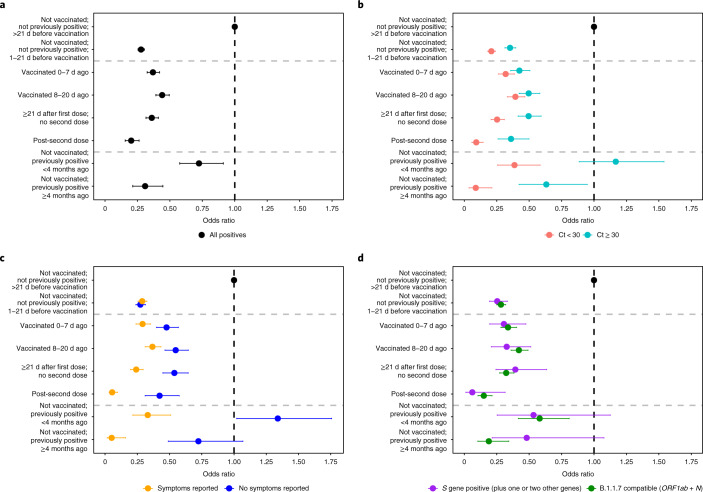
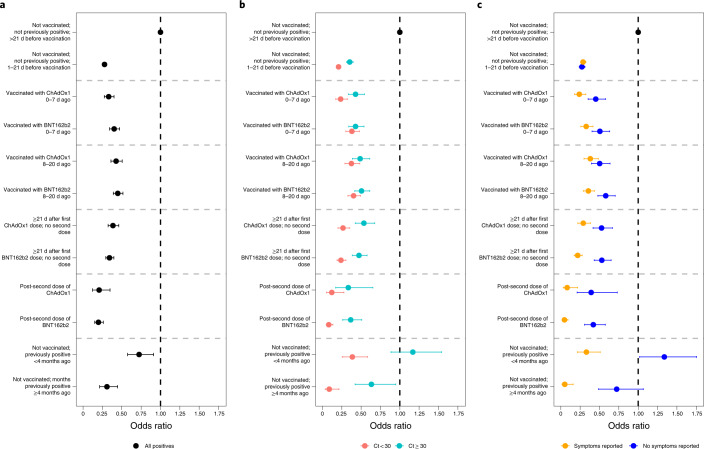
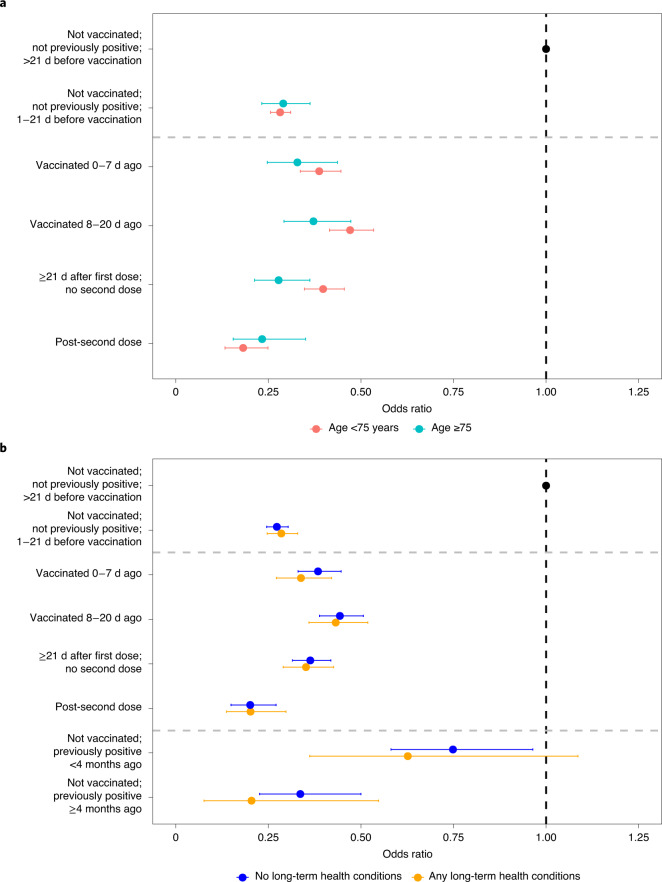
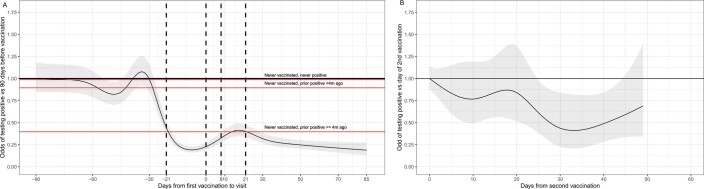
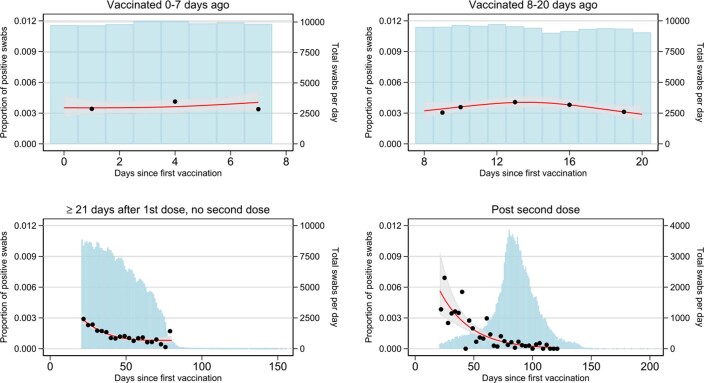
The effectiveness of COVID-19 vaccination in preventing new severe acute respiratory syndrome coronavirus 2 (SARS-CoV-2) infections in the general community is still unclear. Here, we used the Office for National Statistics COVID-19 Infection Survey-a large community-based survey of individuals living in randomly selected private households across the United Kingdom-to assess the effectiveness of the BNT162b2 (Pfizer-BioNTech) and ChAdOx1 nCoV-19 (Oxford-AstraZeneca; ChAdOx1) vaccines against any new SARS-CoV-2 PCR-positive tests, split according to self-reported symptoms, cycle threshold value (<30 versus ≥30; as a surrogate for viral load) and gene positivity pattern (compatible with B.1.1.7 or not). Using 1,945,071 real-time PCR results from nose and throat swabs taken from 383,812 participants between 1 December 2020 and 8 May 2021, we found that vaccination with the ChAdOx1 or BNT162b2 vaccines already reduced SARS-CoV-2 infections ≥21 d after the first dose (61% (95% confidence interval (CI) = 54-68%) versus 66% (95% CI = 60-71%), respectively), with greater reductions observed after a second dose (79% (95% CI = 65-88%) versus 80% (95% CI = 73-85%), respectively). The largest reductions were observed for symptomatic infections and/or infections with a higher viral burden. Overall, COVID-19 vaccination reduced the number of new SARS-CoV-2 infections, with the largest benefit received after two vaccinations and against symptomatic and high viral burden infections, and with no evidence of a difference between the BNT162b2 and ChAdOx1 vaccines.


Conflict of interest statement

All authors have completed the International Committee of Medical Journal Editors uniform disclosure from at http://www.icmje.org/disclosure-of-interest/. D.W.E. declares lecture fees from Gilead outside of the submitted work. E.P., P.C.M., N.S., D.W.E., J.I.B., D.C., T.E.A.P., A.S.W. and K.B.P. are employees of the University of Oxford but were not involved in the development or production of the ChAdOx1 vaccine. J.I.B. acts as an unpaid advisor to Her Majesty’s Government on COVID-19 but does not sit on the vaccine task force and is not involved in procurement decisions. J.I.B. also sits on the board of Oxford Sciences Innovation, which has an investment in Vaccitech, which will receive a royalty from the ChAdOx1 vaccine if/when it makes a profit. H.V. reports personal fees from BioSpyder Technologies outside of the submitted work. Besides the funding mentioned above, A.S.W. also received grants from the Medical Research Council UK during the conduct of the study. There are no other relationships or activities that could appear to have influenced the submitted work.

Figures

Fig. 1
Fig. 1. Distribution of Ct values and percentage of symptoms in new positive episodes by vaccination status.
a, Distribution of Ct values. b, Percentage of symptoms. The numbers of visits with a positive test contributing to the plots by exposure group were: 10,721 (not vaccinated; not previously positive; >21 d before vaccination); 643 (not vaccinated; not previously positive; 1–21 d before vaccination); 291 (vaccinated 0–7 d ago); 441 (vaccinated 8–20 d ago); 530 (≥21 d after first dose; no second dose); 95 (post-second dose); 76 (not vaccinated; previously positive <4 months ago); and 29 (not vaccinated; previously positive ≥4 months ago). Boxplots inside violin plots in a show median values and upper and lower quartiles of the distribution, with whiskers extending from the hinge to the largest and smallest value no further than 1.5 times the IQR. The error bars in b represent 95% CIs. Values are given in Supplementary Table 3.
Fig. 2
Fig. 2. Adjusted odds ratios for the effect of vaccination and previous positivity on all positives and positives split by Ct score, self-reported symptoms and gene positivity pattern.
ad, Adjusted odds ratios for effects on all positives (a) and positives split by Ct value (b), self-reported symptoms (c) and gene positivity pattern (d). All odds ratios were obtained from a generalized linear model with a logit link comparing each category with the reference category (not vaccinated; not previously positive; >21 d before vaccination) and using clustered robust standard errors. Odds ratios are given in Supplementary Table 4. The numbers of visits underlying the models for the different outcomes are provided in Supplementary Table 8. All error bars represent 95% CIs.
Fig. 3
Fig. 3. Adjusted odds ratios for the effect of vaccination, split by vaccine type and previous positivity, on all positives and positives split by Ct value and self-reported symptoms.
ac, Adjusted odds ratios for effects on all positives (a) and positives split by Ct value (b) and self-reported symptoms (c). All odds ratios were obtained from a generalized linear model with a logit link comparing each category with the reference category (not vaccinated; not previously positive; >21 d before vaccination) and using clustered robust standard errors. Odds ratios are given in Supplementary Table 6. The numbers of participants and visits underlying the models for the different outcomes are provided in Supplementary Table 9. All error bars represent 95% CIs.
Fig. 4
Fig. 4. Adjusted odds ratios for the effect of vaccination, split by age and long-term health conditions, on all positives.
a,b, Adjusted odds ratios for effects on all positives, split by age (a) and long-term health conditions (b). All odds ratios were obtained from a generalized linear model with a logit link comparing each category with the reference category (not vaccinated; not previously positive; >21 d before vaccination) and using clustered robust standard errors. The numbers of participants and visits in the different subgroups are provided in Supplementary Table 10a (by age, corresponding to a) and Supplementary Table 10b (by the presence or absence of long-term health conditions, corresponding to b). The heterogeneity P values (as determined by two-sided Wald test) for the two vaccination categories were: P = 0.011 (age) and P = 0.897 (long-term health conditions). There were no positives in those aged ≥75 years in the previously infected exposure groups, so these groups were excluded from the subgroup analysis by age. All error bars represent 95% CIs.
Extended Data Fig. 1
Extended Data Fig. 1. Estimated effect of days since from vaccination on odds of testing positive on a continuous scale.
a, Days from first vaccination to visit. Note: arbitrarily categorised in main analysis at dashed lines as shown. Odds ratios were obtained from a generalised linear model with logit link with 90 days before vaccination as the reference time for the spline used for time since first vaccination (panel A), and the day of the second vaccination as the reference time for the spline for time since second vaccination (Panel B). b, Days from second vaccination to visit.
Extended Data Fig. 2
Extended Data Fig. 2. Observed proportion of positives and numbers of visits over days from vaccination.
Note: observed proportion of positives grouped over every 3 days since vaccination (black dots) with fit of restricted natural cubic spline (fit to each study day) with 3 knots at the 10th,50th and 90th percentile of the unique values of study day (red line) and 95% confidence intervals. Number of individuals on each vaccination day (denominator of the proportions) is shown by the blue bars.

References

    1. Vaccine BNT162b2—Conditions of Authorisation Under Regulation 174 (Medicines and Healthcare Products Regulatory Agency, 2020); https://www.gov.uk/government/publications/regulatory-approval-of-pfizer...
    1. Regulatory Approval of COVID-19 Vaccine AstraZeneca (Medicines and Healthcare Products Regulatory Agency, 2020); https://www.gov.uk/government/publications/regulatory-approval-of-covid-...
    1. Regulatory Approval of COVID-19 Vaccine Moderna (Medicines and Healthcare Products Regulatory Agency, 2021); https://www.gov.uk/government/publications/regulatory-approval-of-covid-...
    1. Joint Committee on Vaccination and Immunisation: Advice on Priority Groups for COVID-19 Vaccination, 30 December 2020 (Joint Committee on Vaccination and Immunisation, 2020); https://www.gov.uk/government/publications/priority-groups-for-coronavir...
    1. Vaccinations in United Kingdom (Public Health England, 2021); https://coronavirus.data.gov.uk/details/vaccinations

Publication types

MeSH terms

Substances