. 2021 May 24:12:673167.
doi: 10.3389/fgene.2021.673167. eCollection 2021.

Admixed Populations Improve Power for Variant Discovery and Portability in Genome-Wide Association Studies

Affiliations

Admixed Populations Improve Power for Variant Discovery and Portability in Genome-Wide Association Studies

Meng Lin et al. Front Genet. .

Abstract

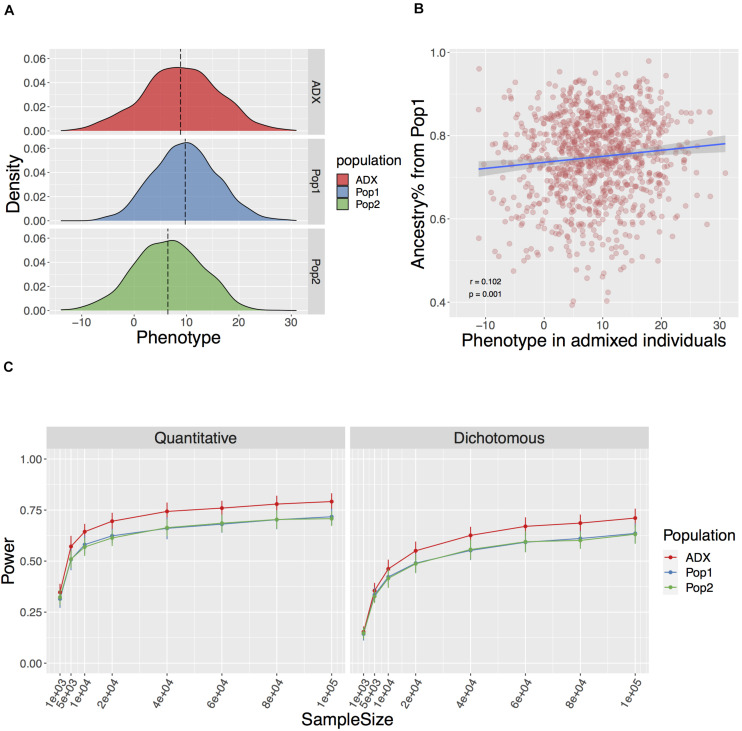
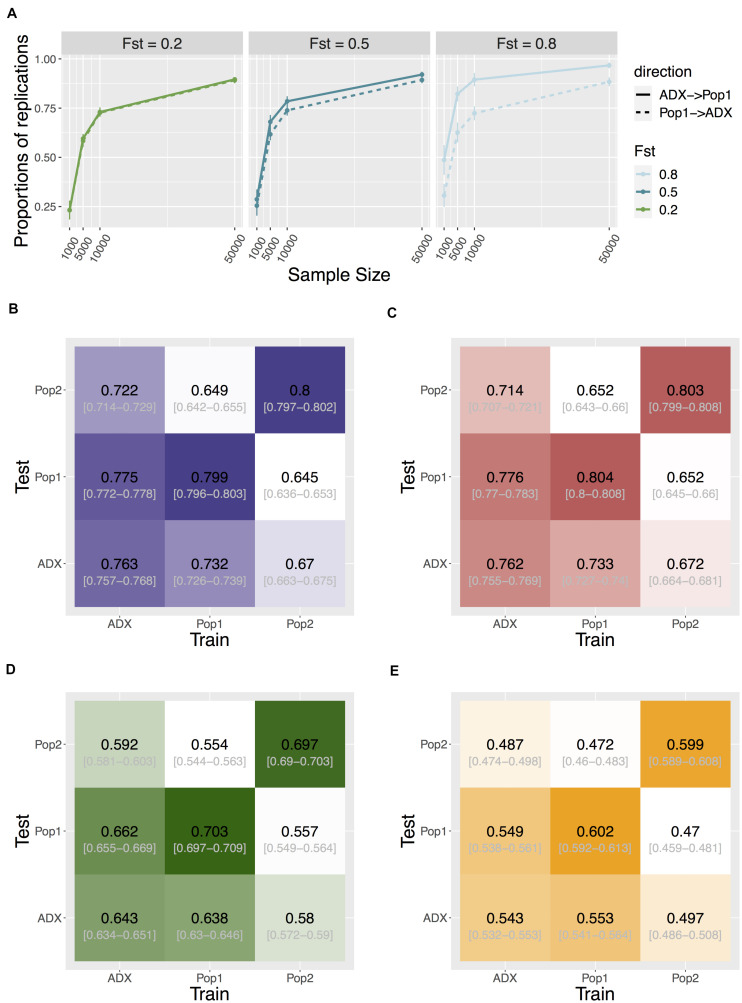
Genome-wide association studies (GWAS) are primarily conducted in single-ancestry settings. The low transferability of results has limited our understanding of human genetic architecture across a range of complex traits. In contrast to homogeneous populations, admixed populations provide an opportunity to capture genetic architecture contributed from multiple source populations and thus improve statistical power. Here, we provide a mechanistic simulation framework to investigate the statistical power and transferability of GWAS under directional polygenic selection or varying divergence. We focus on a two-way admixed population and show that GWAS in admixed populations can be enriched for power in discovery by up to 2-fold compared to the ancestral populations under similar sample size. Moreover, higher accuracy of cross-population polygenic score estimates is also observed if variants and weights are trained in the admixed group rather than in the ancestral groups. Common variant associations are also more likely to replicate if first discovered in the admixed group and then transferred to an ancestral population, than the other way around (across 50 iterations with 1,000 causal SNPs, training on 10,000 individuals, testing on 1,000 in each population, p = 3.78e-6, 6.19e-101, ∼0 for FST = 0.2, 0.5, 0.8, respectively). While some of these FST values may appear extreme, we demonstrate that they are found across the entire phenome in the GWAS catalog. This framework demonstrates that investigation of admixed populations harbors significant advantages over GWAS in single-ancestry cohorts for uncovering the genetic architecture of traits and will improve downstream applications such as personalized medicine across diverse populations.

Keywords: admixture; complex trait genetics; genetic architecture; polygenic score; statistical power.


Conflict of interest statement

The authors declare that the research was conducted in the absence of any commercial or financial relationships that could be construed as a potential conflict of interest.

Figures

FIGURE 1
FIGURE 1
Flow chart of the simulation framework in APRICOT, including simulation of genotypes and phenotypes based on an admixture process and subsequent association tests for statistical power. A separate side function for testing association between a trait and global ancestry is illustrated in Supplementary Figure 1.
FIGURE 2
FIGURE 2
Genotype mediated simulation under an example condition. The simulated trait has 100 causal variants with a narrow sense h2 = 0.5, FST at causal variants 0.2+ (explained in Result), and environment by ancestry effect modeled as the sum of ancestral Gaussian environmental noise proportional to global ancestry. (A) Simulated quantitative phenotype distribution of populations of ancestral origin (Pop1, Pop2, blue, and green, respectively) and admixed population (ADX, red) of 1,000 samples each. (B) Correlation between simulated phenotype in admixed population and the global ancestry from Population 1. (C) Power to discover a causal variant over a range of sample sizes in a quantitative and dichotomous trait. Data point and error bars represent the mean and standard deviation across 50 repetitions, respectively.
FIGURE 3
FIGURE 3
Varying FST at trait associated loci. Ratio of power in admixed population over the average in the two populations of ancestral origin, with different FST at causal loci in (A) a quantitative trait and (B) a dichotomous trait. FST was set to constant during simulations per a specified value. The trait was assumed to have 100 causal loci and a narrow sense heritability of 0.5, with environment by ancestry effect modeled as a sum of ancestral Gaussian noise proportional to the global ancestry. Data points and error bars represent the mean and standard deviation across 50 repetitions, respectively. (C) FST at genome-wide significant hits for 899 traits from the GWAS catalog, between CEU and YRI from the 1000 Genomes Project Phase 3. Traits are spread along the radian (x-axis), with variant FST shown along the radius (y-axis). The dashed line represents the genomic background FST.
FIGURE 4
FIGURE 4
Transferability of GWAS variants across populations. (A) Replication of individual signals that are common in both ancestral Population 1 and the admixed group. Direction of replication is shown as a solid or dashed line: the former indicates loci are discovered in an admixed population and replicated in Population 1; the latter loci are discovered in Population 1 and replicated in the admixed population. Data point and error bars represent the mean and standard deviation across 50 repetitions. (B–E) Heat map of accuracy of PRS using signals above different stringency of significance level at 0.05, 5e-4, 5e-6, and 5e-8, respectively. The accuracy is measured as the correlation coefficient between the estimated PRS against the true PRS. The training population where the weights and variants were identified, and the test population in which to construct PRS, are specified on the x- and y-axis. Central numbers in black within each cell are the average correlation coefficient across 50 independent simulations, with the 95% confidence interval of the mean acquired from bootstrapping (n = 1,000).

References

    1. 1000 Genomes Project Consortium, Auton A., Brooks L. D., Durbin R. M., Garrison E. P., Kang H. M., et al. (2015). A global reference for human genetic variation. Nature 526:68. 10.1038/nature15393 - DOI - PMC - PubMed
    1. Aschard H., Gusev A., Brown R., Pasaniuc B. (2015). Leveraging local ancestry to detect gene-gene interactions in genome-wide data. BMC Genet. 16:124. 10.1186/s12863-015-0283-z - DOI - PMC - PubMed
    1. Asimit J. L., Hatzikotoulas K., McCarthy M., Morris A. P., Zeggini E. (2016). Trans-ethnic study design approaches for fine-mapping. Eur. J. Hum. Genet. 24 1330–1336. 10.1038/ejhg.2016.1 - DOI - PMC - PubMed
    1. Atkinson E. G., Maihofer A. X., Kanai M., Martin A. R., Karczewski K. J., Santoro M. L., et al. (2021). Tractor uses local ancestry to enable the inclusion of admixed individuals in GWAS and to boost power. Nat. Genet. 53 195–204. 10.1038/s41588-020-00766-y - DOI - PMC - PubMed
    1. Baharian S., Barakatt M., Gignoux C. R., Shringarpure S., Errington J., Blot W. J., et al. (2016). The Great migration and african-american genomic diversity. PLoS Genet. 12:e1006059. 10.1371/journal.pgen.1006059 - DOI - PMC - PubMed