

Vitamin K Vitamers Differently Affect Energy Metabolism in IPEC-J2 Cells
- PMID: 34109217
- PMCID: PMC8184094
- DOI: 10.3389/fmolb.2021.682191
Vitamin K Vitamers Differently Affect Energy Metabolism in IPEC-J2 Cells
Abstract
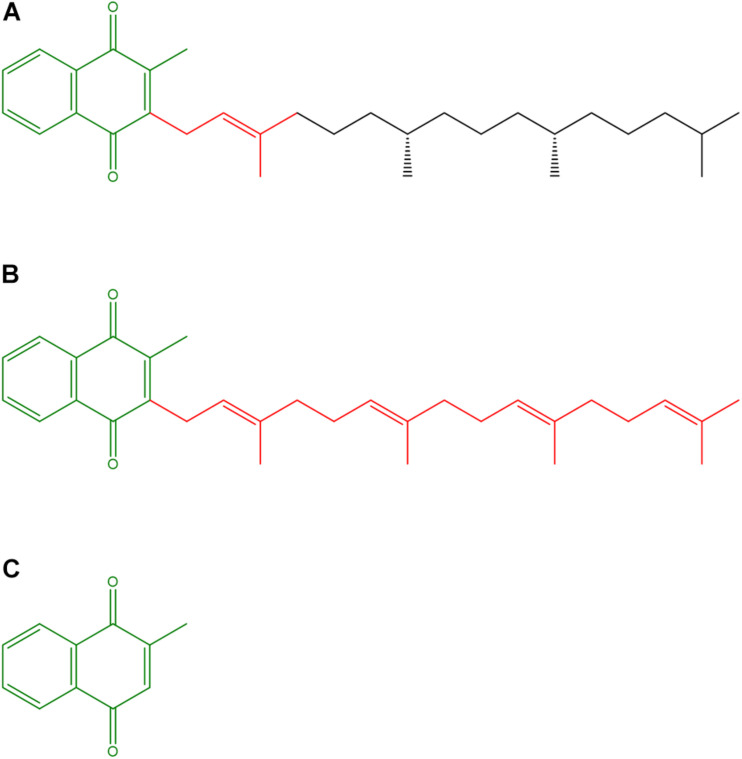
The fat-soluble vitamin K (VK) has long been known as a requirement for blood coagulation, but like other vitamins, has been recently recognized to play further physiological roles, particularly in cell development and homeostasis. Vertebrates cannot de novo synthesize VK, which is essential, and it can only be obtained from the diet or by the activity of the gut microbiota. The IPEC-J2 cell line, obtained from porcine small intestine, which shows strong similarities to the human one, represents an excellent functional model to in vitro study the effect of compounds at the intestinal level. The acute VK treatments on the bioenergetic features of IPEC-J2 cells were evaluated by Seahorse XP Agilent technology. VK exists in different structurally related forms (vitamers), all featured by a naphtoquinone moiety, but with distinct effects on IPEC-J2 energy metabolism. The VK1, which has a long hydrocarbon chain, at both concentrations (5 and 10 μM), increases the cellular ATP production due to oxidative phosphorylation (OXPHOS) by 5% and by 30% through glycolysis. The VK2 at 5 μM only stimulates ATP production by OXPHOS. Conversely, 10 μM VK3, which lacks the long side chain, inhibits OXPHOS by 30% and glycolysis by 45%. However, even if IPEC-J2 cells mainly prefer OXPHOS to glycolysis to produce ATP, the OXPHOS/glycolysis ratio significantly decreases in VK1-treated cells, is unaffected by VK2, and only significantly increased by 10 μM VK3. VK1, at the two concentrations tested, does not affect the mitochondrial bioenergetic parameters, while 5 μM VK2 increases and 5 μM VK3 reduces the mitochondrial respiration (i.e., maximal respiration and spare respiratory capacity). Moreover, 10 μM VK3 impairs OXPHOS, as shown by the increase in the proton leak, namely the proton backward entry to the matrix space, thus pointing out mitochondrial toxicity. Furthermore, in the presence of both VK1 and VK2 concentrations, the glycolytic parameters, namely the glycolytic capacity and the glycolytic reserve, are unaltered. In contrast, the inhibition of glycoATP production by VK3 is linked to the 80% inhibition of glycolysis, resulting in a reduced glycolytic capacity and reserve. These data, which demonstrate the VK ability to differently modulate IPEC-J2 cell energy metabolism according to the different structural features of the vitamers, can mirror VK modulatory effects on the cell membrane features and, as a cascade, on the epithelial cell properties and gut functions: balance of salt and water, macromolecule cleavage, detoxification of harmful compounds, and nitrogen recycling.
Keywords: ATP; IPEC-J2; glycolysis; mitochondria; oxidative phosphorylation; vitamin K.
Copyright © 2021 Bernardini, Algieri, La Mantia, Trombetti, Pagliarani, Forni and Nesci.
Conflict of interest statement
The authors declare that the research was conducted in the absence of any commercial or financial relationships that could be construed as a potential conflict of interest.
Figures
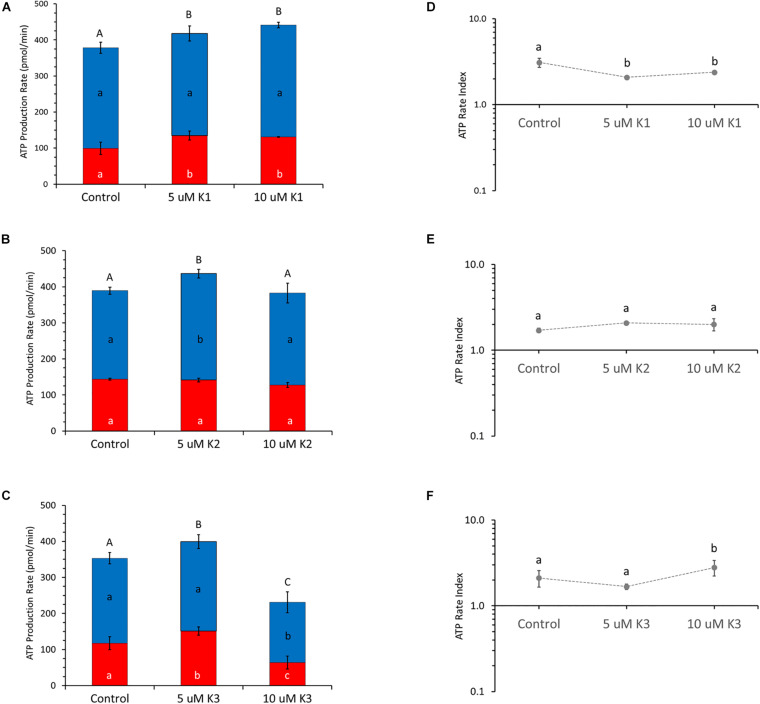
 ) or by glycolysis (red) (
 ) in VK1 (A), VK2 (B), and VK3 (C)-treated cells. The ATP rate index, calculated as the ratio between the mitochondrial ATP production rate and the glycolytic ATP production rate, is shown on the y-axis (logarithmic scale) in IPEC-J2 treated with 0 (Control), 5, and 10 μM VK1 (D), VK2 (E), and VK3 (F). Data, expressed as column chart [(A,B,C) plots] and points [(D,E,F) plots], represent the mean ± SD (vertical bars) from three experiments carried out on distinct cell preparations. Different lower-case letters indicate significantly different values (P ≤ 0.05) among treatments (0, 5, 10 μM) in the same metabolic pathway; different upper-case letters indicate different values (P ≤ 0.05) among treatments in ATP production rates due to sum of OXPHOS plus glycolysis.
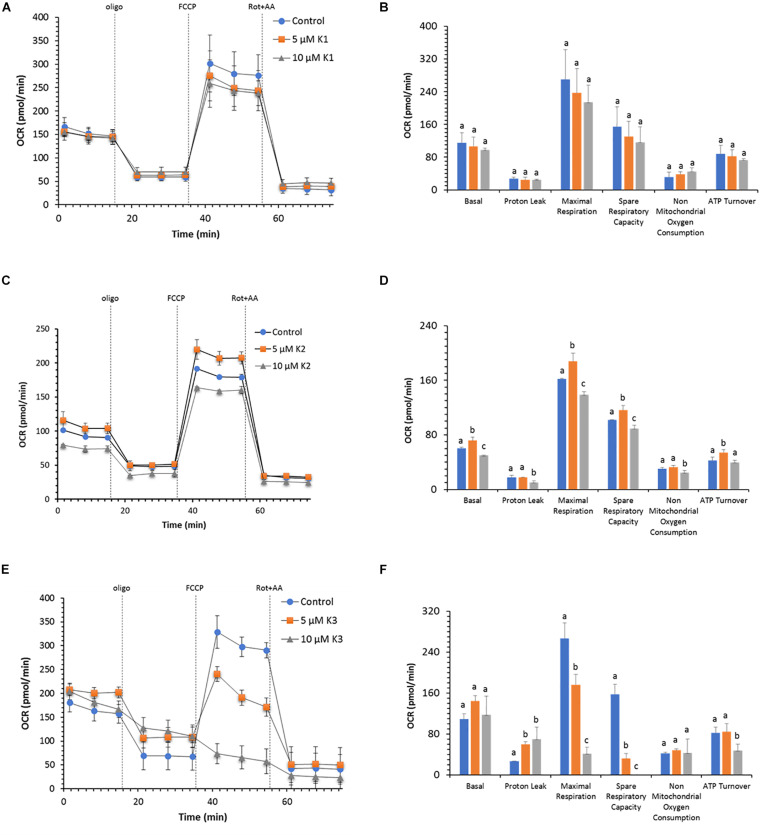 ) or in the presence of 5 μM (orange) (
 ), or 10 μM (gray) (
 ) VK1 (B), VK2 (D), and VK3 (F). Data expressed as points (A,C,E) and column chart (B,D,F) represent the mean ± SD (vertical bars) from three experiments carried out on different cell preparations. Different letters indicate significant differences (P ≤ 0.05) among treatments within the same parameter.
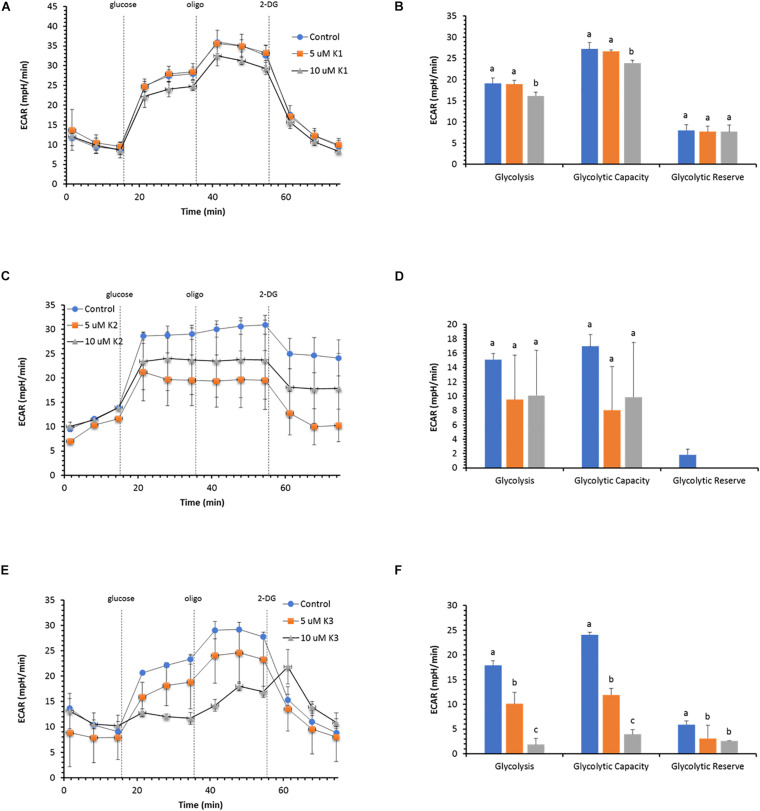 ), or in the presence of 5 μM (orange) (), or 10 μM (gray) () VK1 (B), VK2 (D), and VK3 (F). Data expressed as points (A,C,E) and column chart (B,D,F) represent the mean ± SD (vertical bars) from three experiments carried out on different cell preparations. Different letters indicate significant differences (P ≤ 0.05) among treatments within the same parameter.
 ) or in the presence of 5 μM (orange) (), or 10 μM (gray) () VK1 (B), VK2 (D), and VK3 (F). Data expressed as points (A,C,E) and column chart (B,D,F) represent the mean ± SD (vertical and where present also horizontal bars) from three experiments carried out on distinct cell preparations. Different letters indicate significant differences (P ≤ 0.05) among treatments within the same parameter.
References
LinkOut - more resources
Full Text Sources