. 2019 Dec:30:41-47.
doi: 10.1016/j.cobeha.2019.05.005. Epub 2019 Jul 5.

Color, Pattern, and the Retinal Cone Mosaic

Affiliations

Color, Pattern, and the Retinal Cone Mosaic

David H Brainard. Curr Opin Behav Sci. 2019 Dec.

Abstract

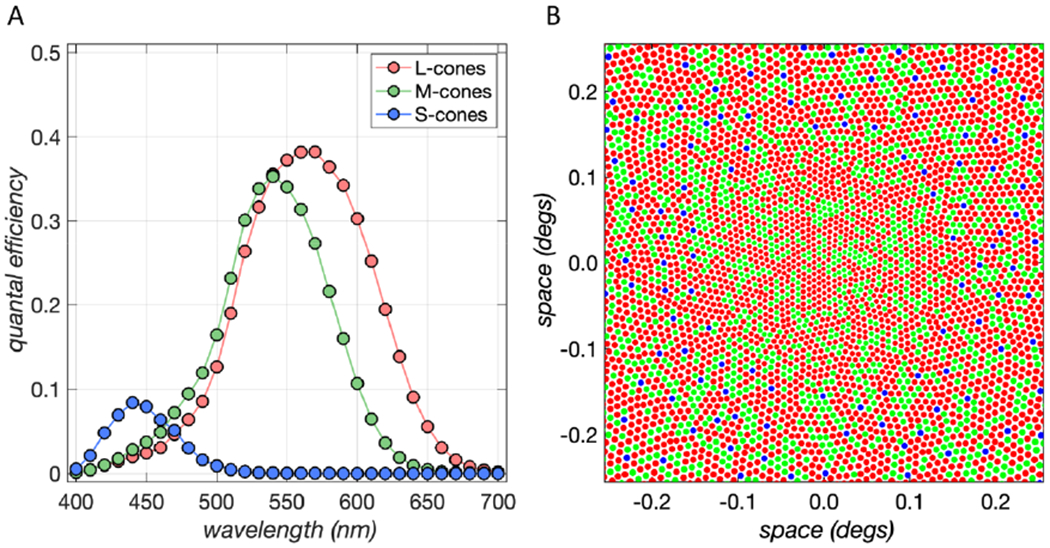
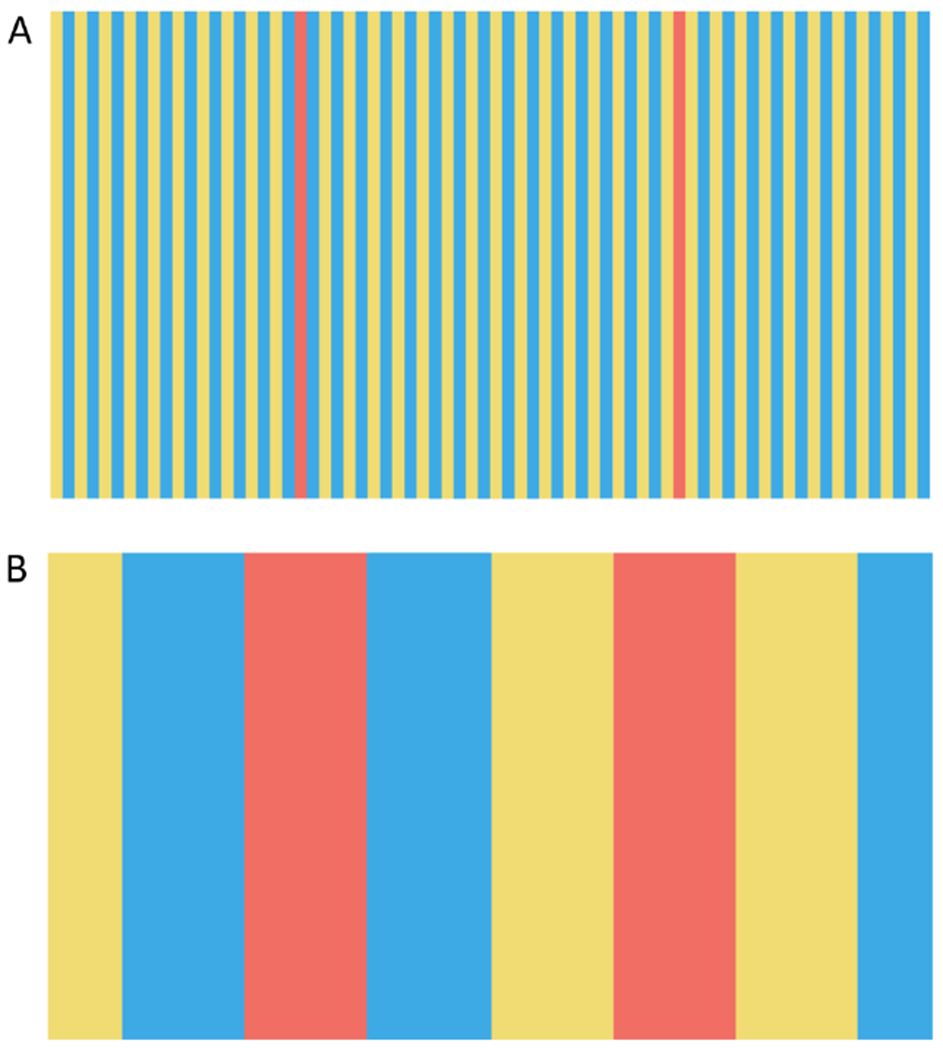
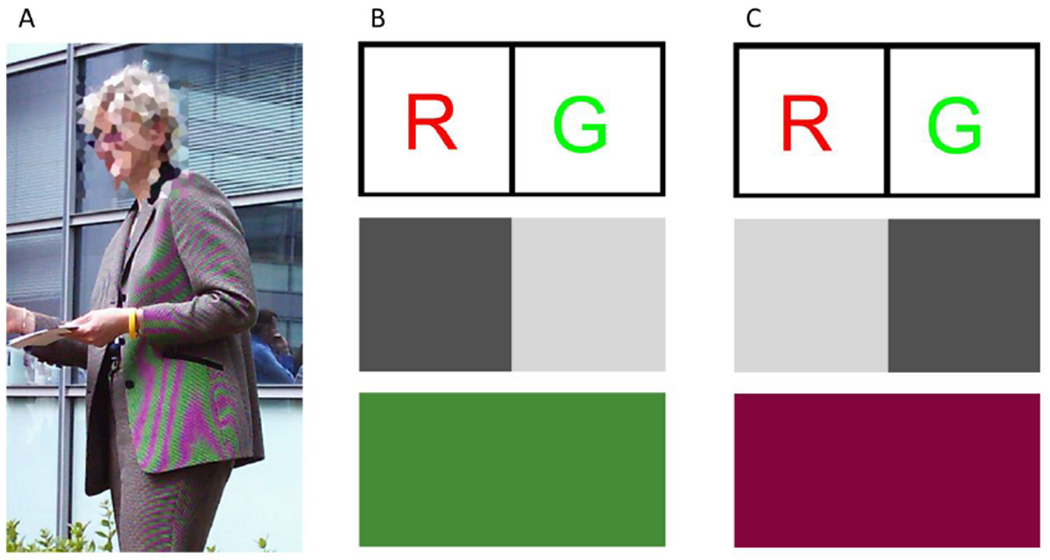
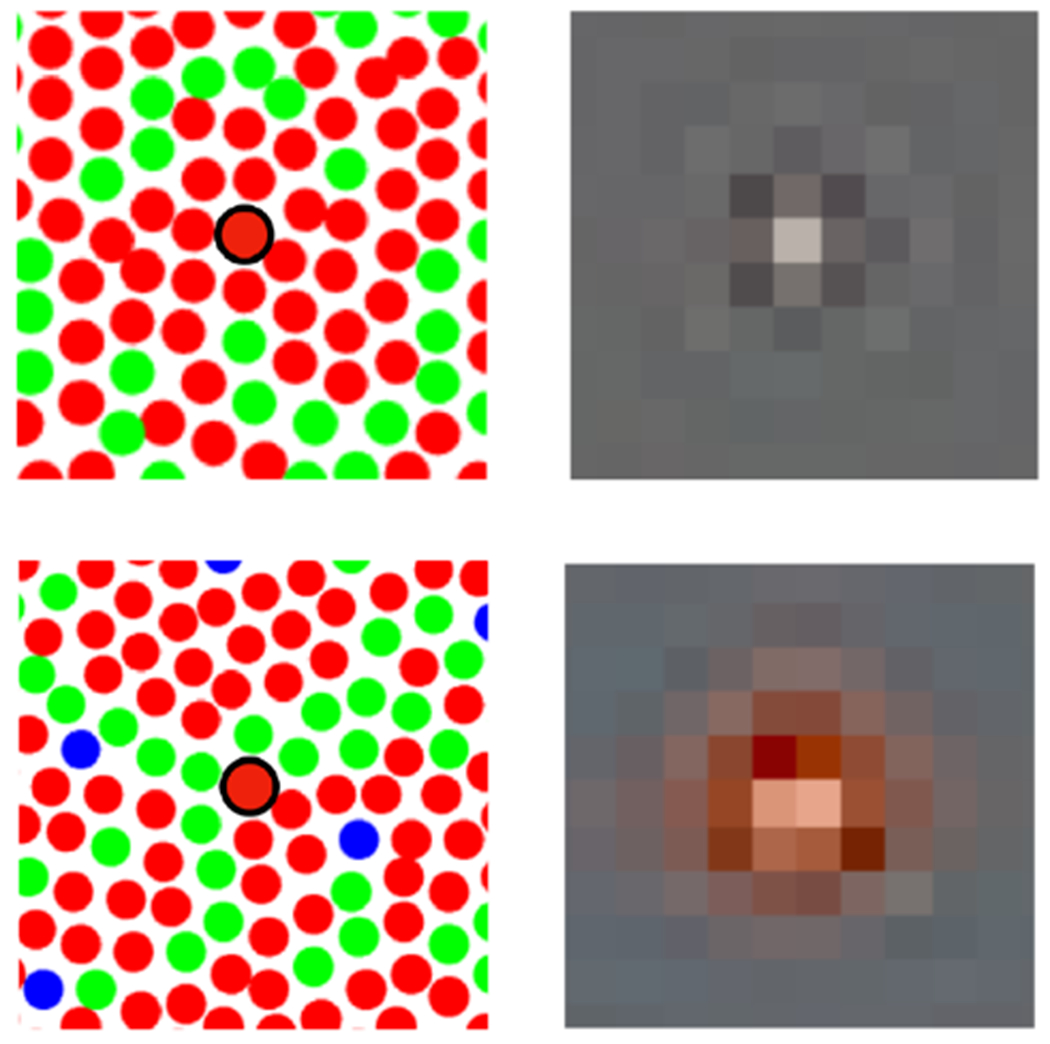
Textbook trichromacy accounts for human color vision in terms of spectral sampling by three classes of cone photoreceptors. This account neglects entangling of color and pattern information created by wavelength-dependent optical blur (chromatic aberrations) and interleaved spatial sampling of the retinal image by the three classes of cones. Recent experimental, computational, and neurophysiological work is now considering color and pattern vision at the elementary scale of daylight vison, that is at the scale of individual cones. The results provide insight about rich interactions between color and pattern vision as well as the role of the statistical structure of natural scenes in shaping visual processing.

Keywords: color perception; computational models; cone mosaic; cones; psychophysics; spatial vision.


Figures

Figure 1.
Figure 1.. Trichromacy and the Interleaved Cone Mosaic.
A) The human retina contains three classes of cone photoreceptors, referred to as the long-wavelength-sensitive (L), middle-wavelength-sensitive (M) and short-wavelength-sensitive (S) cones. Each class of cones has a distinct spectral sensitivity, so that the relative excitations of the three classes depends on the spectrum of the incident light. B) Schematic of human foveal cone mosaic. There are approximately 2 L cones (red) for every M cone (green), while S cones make up only a small fraction of the mosaic (about 5%). The arrangement of S cones depicted is semi-regular; the actual S-cone mosaic may be less regular than shown. There are no S cones in the central portion (here 0.3 deg) of the fovea. The algorithm used to generate this model mosaic is described in [37]. Figure courtesy of Nicolas Cottaris.
Figure 2.
Figure 2.. Interactions between space and color.
A) The panel shows an example of color assimilation. The two reddish bars have the same RGB values, but appear quite different. This difference is a consequence of where the reddish bars are inserted into the blue-yellow grating. B) Color assimilation depends on spatial pattern. The reddish bars again have the same RGB values as each other (and the same RGB values as the reddish bars in A), and the RGB values of the blue-yellow grating are also matched those in A. The effect of assimilation is reduced in B, as compared to A. See [48] for discussion of possible mechanisms underlying color assimilation. Comparison of the panels also reveals a difference in the color appearance of the blue and yellow bars.
Figure 3.
Figure 3.. Color-pattern artifacts.
A) A digital color image taken with a camera that employed an interleaved RGB sensor design. Note the green-red color artifacts on the jacket. The subject’s face has been intentionally distorted to protect identity; that distortion is not what is being illustrated here. [Panel A reproduced with permission from 9.] B) A high-spatial-frequency grayscale pattern can produce the same low/high alternation of sensor responses as a low-spatial-frequency green pattern, for a simple two-pixel RG interleaved sensor. C) When the phase of the high-spatial-frequency pattern is shifted relative to the sensor, the grayscale pattern produces the same high/low alternation of sensor responses as a low-spatial-frequency red pattern. The type of effects illustrated in panels B and C lead to the red-green artifacts shown in A. [Panels B and C reproduced with permission from 38.]
Figure 4.
Figure 4.. Bayesian small spot reconstructions.
Expanded view of two cone mosaics with an L cone near the center (left column). Corresponding Bayesian image reconstructions based on the cone excitations of each mosaic. The reconstructions for incremental stimulation of a single L cone (circled in black in each case) are quite different, as they depend on the responses of the whole mosaic and the information carried by the two mosaics differ. See main text for additional description. Figure courtesy Lingqi Zhang.

References

    1. Stockman A, Brainard DH. Fundamentals of color vision I: Color processing in the eye. In: Handbook of Color Psychology. Edited by: Elliot AJ, Fairchild MD. Cambridge: Cambridge University Press; 2015.
    1. Bodrogi P, Khanh TQ. Illumination, Color and Imaging. Weinheim, Germany: Wiley-VCH Verlag & Co.; 2012.
    1. Roorda A, Williams DR. The arrangement of the three cone classes in the living human eye. Nature 1999; 397:520–522 - PubMed
    1. Hofer HJ, Carroll J, Neitz J, Neitz M, Williams DR. Organization of the human trichromatic cone mosaic. Journal of Neuroscience 2005; 25:9669–9679 - PMC - PubMed
    1. Sabesan R, Hofer H, Roorda A. Characterizing the human cone photoreceptor mosaic via dynamic photopigment densitometry. PLoS One 2015; 10:e0144891. - PMC - PubMed

LinkOut - more resources