. 2021 Aug:7:100130.
doi: 10.1016/j.lanepe.2021.100130. Epub 2021 Jun 5.

A nationwide analysis of population group differences in the COVID-19 epidemic in Israel, February 2020-February 2021

Affiliations

A nationwide analysis of population group differences in the COVID-19 epidemic in Israel, February 2020-February 2021

Khitam Muhsen et al. Lancet Reg Health Eur. 2021 Aug.

Abstract

Background: Social inequalities affect the COVID-19 burden and vaccine uptake. The aim of this study was to explore inequalities in the incidence and mortality rate of SARS-CoV-2 infection and vaccine uptake in various sociodemographic and population group strata in Israel.

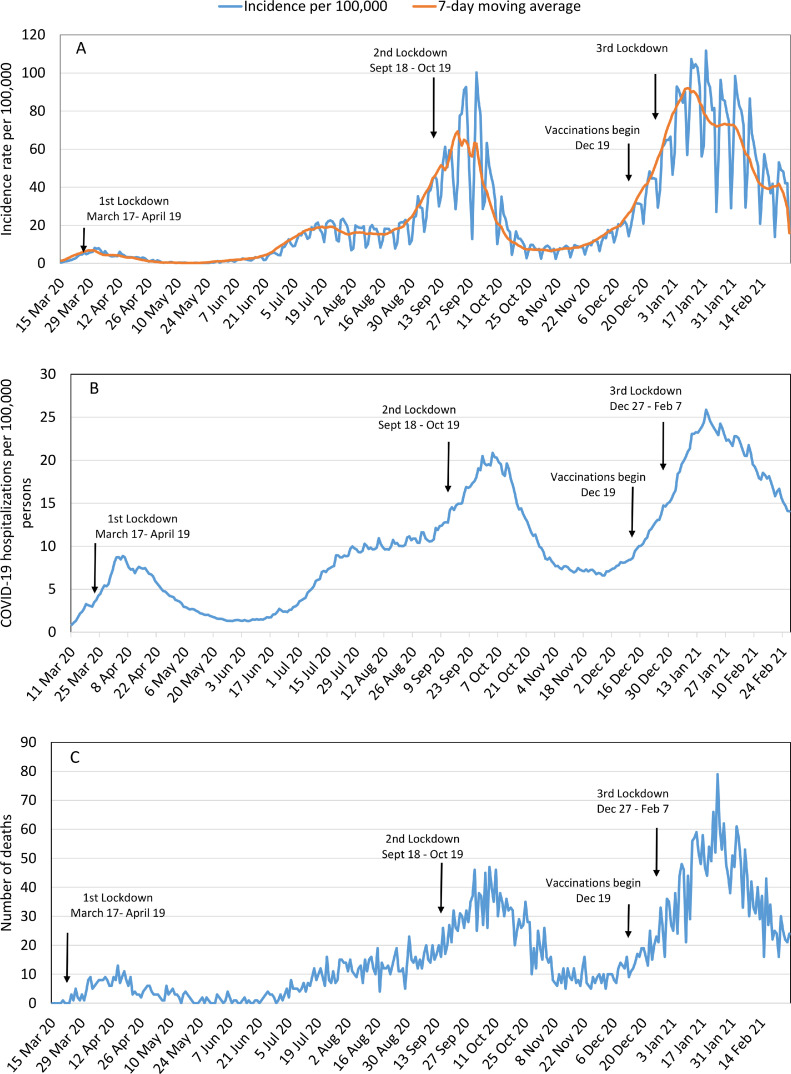
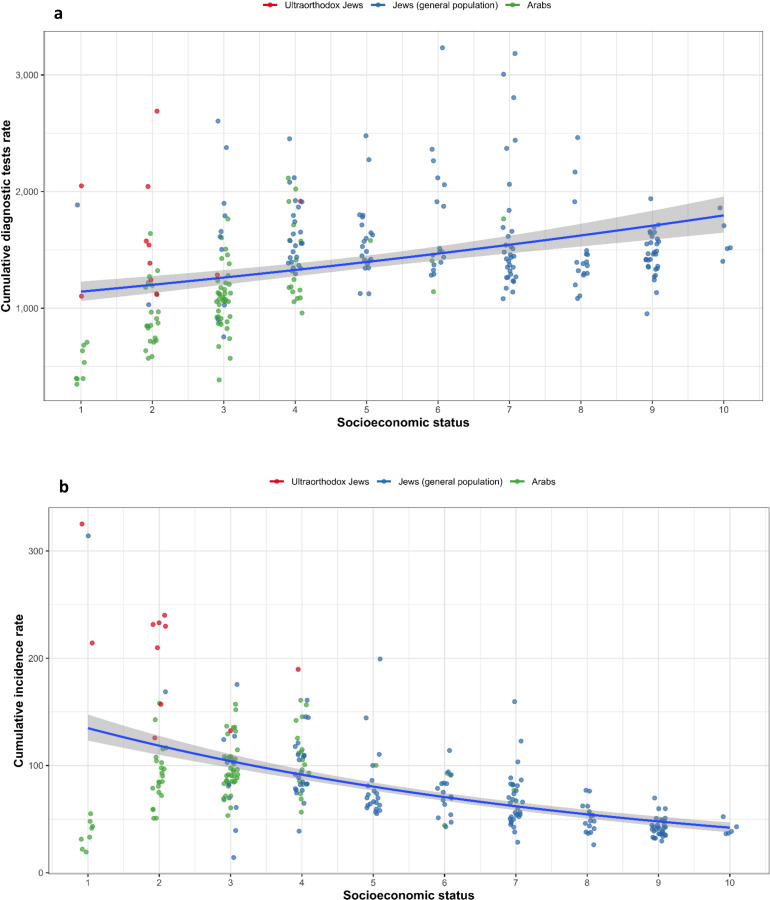
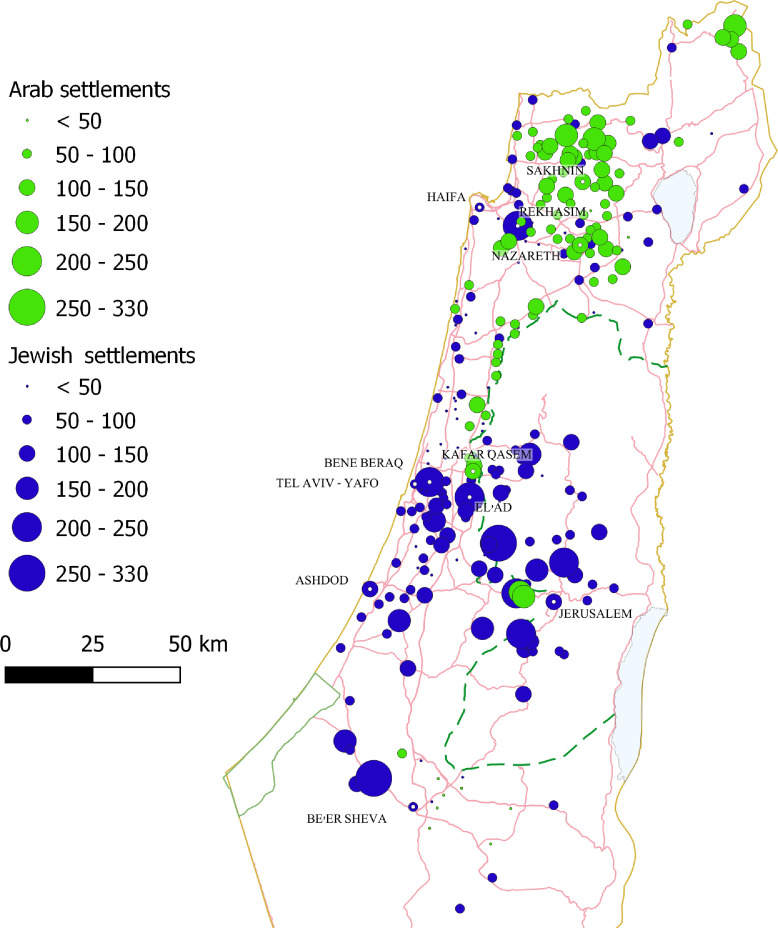
Methods: We analysed nationwide publicly available, aggregated data on PCR-confirmed SARS-CoV-2 infections and COVID-19 deaths between March 2020 and February 2021, as well as the first three months of COVID-19 immunisation according to sociodemographics, including population group and residential socioeconomic status (SES). We computed incidence and mortality rates of COVID-19. Comparisons between towns with predominantly Arab, ultra-Orthodox Jewish (the minorities), general Jewish populations, and according to SES, were conducted using generalised linear models with negative binomial distribution.

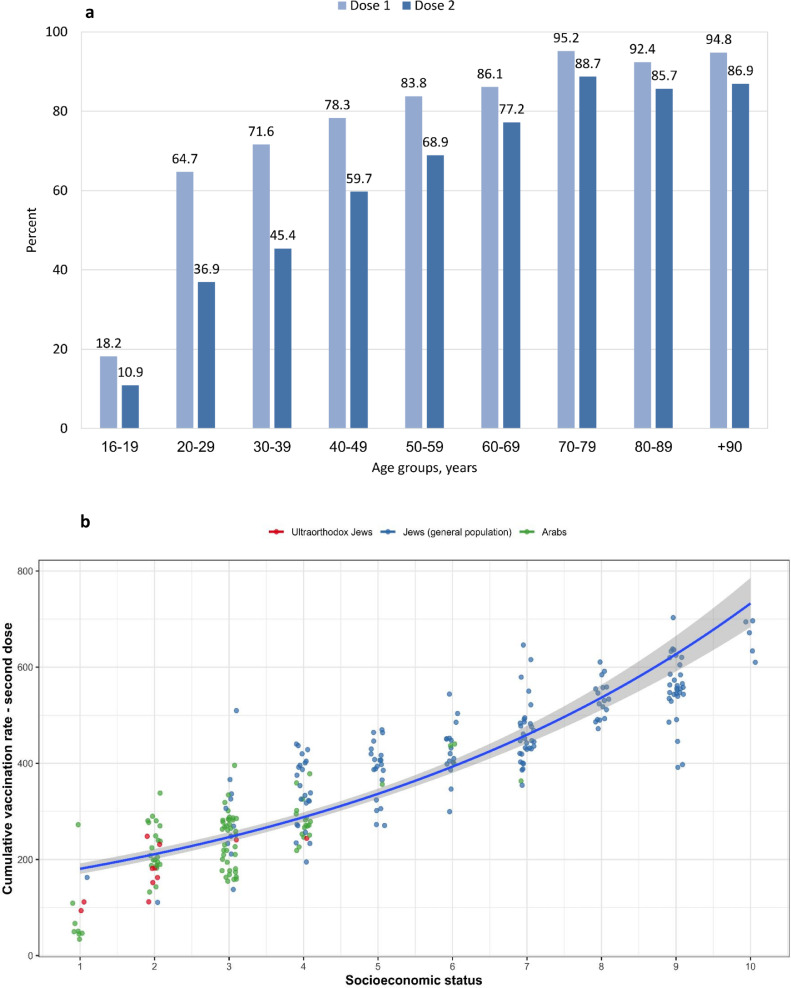
Findings: Overall, 774,030 individuals had SARS-CoV-2 infection (cumulative incidence 84•5 per 1,000 persons) and 5687 COVID-19 patients had died (mortality rate 62•8 per 100,000 persons). The highest mortality rate was found amongst the elderly. Most (>75%) individuals aged 60 years or above have been vaccinated with BNT162b2 vaccine. The risk of SARS-CoV-2 infection was higher in towns with predominantly Arab and ultra-Orthodox Jewish populations than in the general Jewish population, and in low SES communities. COVID-19 mortality rate was highest amongst Arabs. Conversely, vaccine uptake was lower amongst Arab and ultra-Orthodox Jewish populations and low SES communities.

Interpretation: Ethnic and religious minorities and low SES communities experience substantial COVID-19 burden, and have lower vaccine uptake, even in a society with universal accessibility to healthcare. Quantifying these inequalities is fundamental towards reducing these gaps, which imposes a designated apportion of resources to adequately control the pandemic.

Funding: No external funding was available for this study.

Keywords: BNT162b2 vaccine; Immunisation uptake; Incidence; Israel; Minority; Mortality; SARS-CoV-2; Social determinants.


Conflict of interest statement

All authors declare no conflict of interest.

Figures

Fig. 1
Fig. 1
Epidemiological curve of SARS-CoV-2 infection in Israel, March 2020–February 2021. COVID-19: Coronavirus disease 2019; SARS-CoV-2: Severe acute respiratory syndrome coronavirus 2. (A) Daily incidence rate (per 100,000 persons) of PCR-confirmed SARS-CoV-2 infection (blue line) and 7-day moving average (orange line); (B) Prevalence proportion of COVID-19 hospitalisations (per 100,000 persons); (C) Daily number of COVID-19 deaths.
Fig. 2
Fig. 2
Uptake of SARS-CoV-2 PCR test (per 1000 persons), SARS-CoV-2 incidence rates (per 1000 persons) according to subpopulation group and residential SES. PCR: Polymerase chain reaction; SARS-CoV-2: Severe acute respiratory syndrome coronavirus 2; SES: socioeconomic status. (a) Cumulative uptake rate (per 1000 persons) of diagnostic SARS-CoV-2 PCR test (b) Cumulative rate of PCR-confirmed SARS-CoV-2 infection in 260 towns with 2000 residents or more, according to residential SES ranks (10 being the highest SES and 1 being the lowest SES), and population subgroup. Each circle represents a town; red circles=towns with mostly ultra-Orthodox Jewish residents, green circles=Arab towns and blue=towns with mostly general Jewish populations, and trends line in relation to SES rank.
Fig. 3
Fig. 3
Cumulative incidence rates (per 1000 persons) in towns with 2000 residents or more according to population group and geographic distribution. Towns with mixed Arab and Jewish residents were classified as towns with mostly Jewish population since more than 60% of the population was Jewish. Each circle represents a town; the larger the circle, the higher the incidence rate. Circles in green represent towns with predominantly Arab population (e.g., Nazareth, Sakhnin, Kafar Qasem), Circles in blue represent towns with predominantly Jewish populations; the towns Rekhasim, Bene Beraq (Bnei Brak) and Elad represent towns with mainly ultra-Orthodox Jewish populations.
Fig. 4
Fig. 4
Adherance to COVID-19 non-pharmaceutical preventive measures amongst adults, Israel 2020. Results from periodical national surveys conducted by the Israel Central Bureau of Statistics on public adherence to COVID-19 non-pharmaceutical preventive measures. Adherence was defined based on the self-reports of the participants in these surveys to the question of to which degree they complied with the recommendation of maintaining two-metre physical distancing between people in public settings, wearing a mask, and personal hygiene such as hand washing and use of hand sanitiser.
Fig. 5
Fig. 5
BNT162b2 COVID-19 vaccine uptake by age and vaccine dose (a), population subgroup and residential SES (b). COVID-19: Coronavirus disease 2019; SES: socioeconomic status. (a): The percentage of vaccinated people in each age group, dose 1 in light blue and dose 2 in dark blue. (b): Cumulative uptake rate (per 1000 persons) of the second dose of COVID-19 vaccine in all age groups in each town. An analysis of 260 towns with 2000 residents or more, according to residential SES ranks (10 being the highest SES and 1 being the lowest SES), and population subgroup. Each circle represents a town; red circles=towns with mostly ultra-Orthodox Jewish residents, green circles=Arab towns and blue=towns with mostly general Jewish populations, and trends line in relation to SES rank.

References

    1. WHO . 2020. Coronavirus disease (COVID-19) pandemic.https://www.who.int/emergencies/diseases/novel-coronavirus-2019 (accessed January 17, 2021) - PubMed
    1. Hradsky O., Komarek A. Demographic and public health characteristics explain large part of variability in COVID-19 mortality across countries. Eur J Public Health. 2021;31(1):12–16. - PMC - PubMed
    1. Green M.S., Peer V., Schwartz N., Nitzan D. The confounded crude case-fatality rates (CFR) for COVID-19 hide more than they reveal-a comparison of age-specific and age-adjusted CFRs between seven countries. PLoS ONE. 2020;15(10) - PMC - PubMed
    1. Karmakar M., Lantz P.M., Tipirneni R. Association of social and demographic factors with COVID-19 incidence and death rates in the US. JAMA Netw Open. 2021;4(1) - PMC - PubMed
    1. Niedzwiedz C.L., O'Donnell C.A., Jani B.D. Ethnic and socioeconomic differences in SARS-CoV-2 infection: prospective cohort study using UK Biobank. BMC Med. 2020;18(1):160. - PMC - PubMed