. 2021 Jun 30;17(25):6225-6237.
doi: 10.1039/d1sm00463h.

Effect of collagen and EPS components on the viscoelasticity of Pseudomonas aeruginosa biofilms

Affiliations

Effect of collagen and EPS components on the viscoelasticity of Pseudomonas aeruginosa biofilms

Minhaz Ur Rahman et al. Soft Matter. .

Abstract

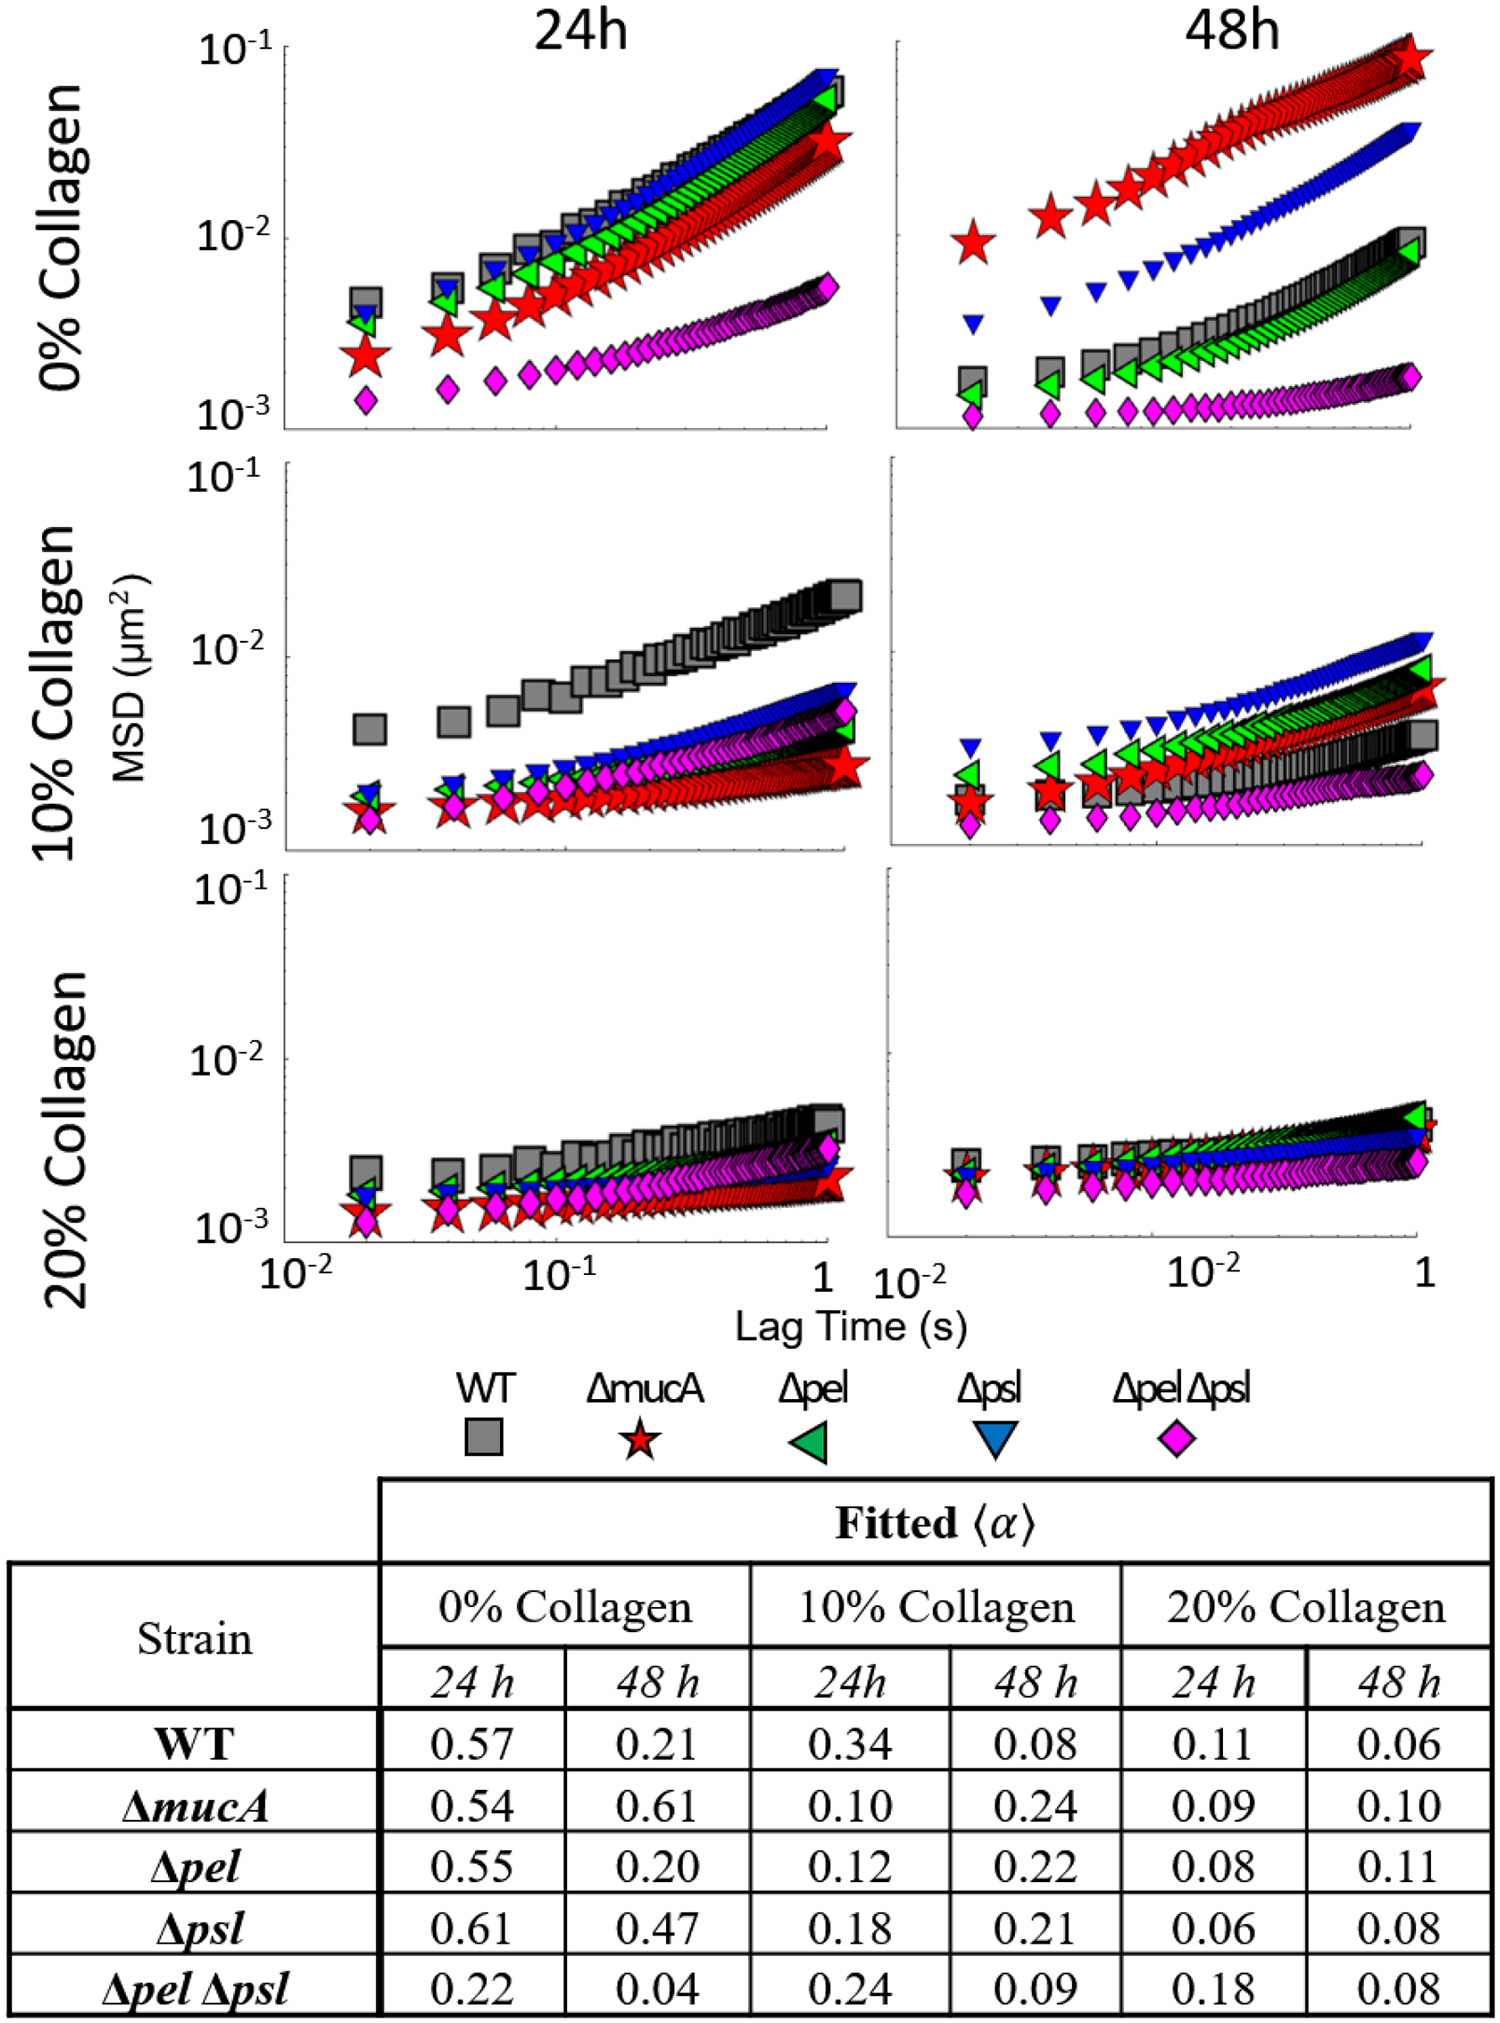
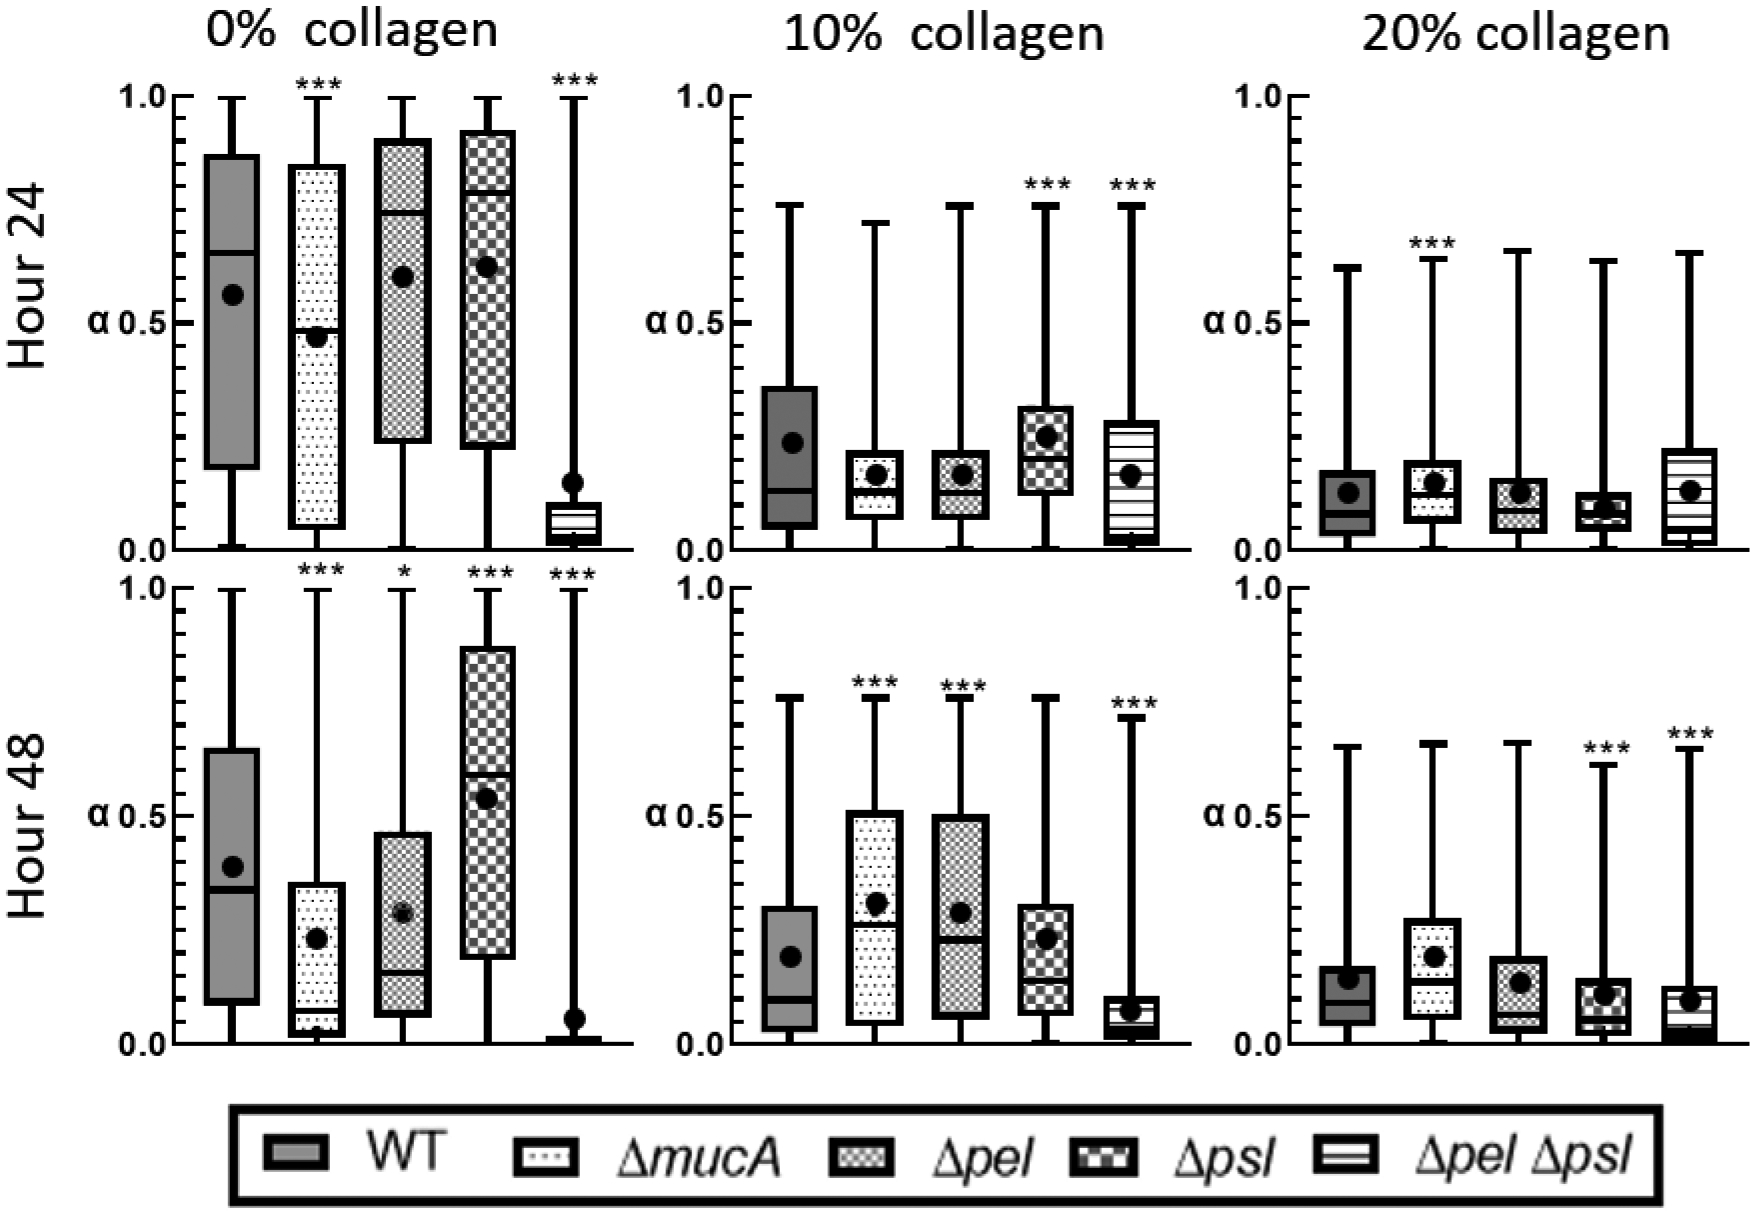
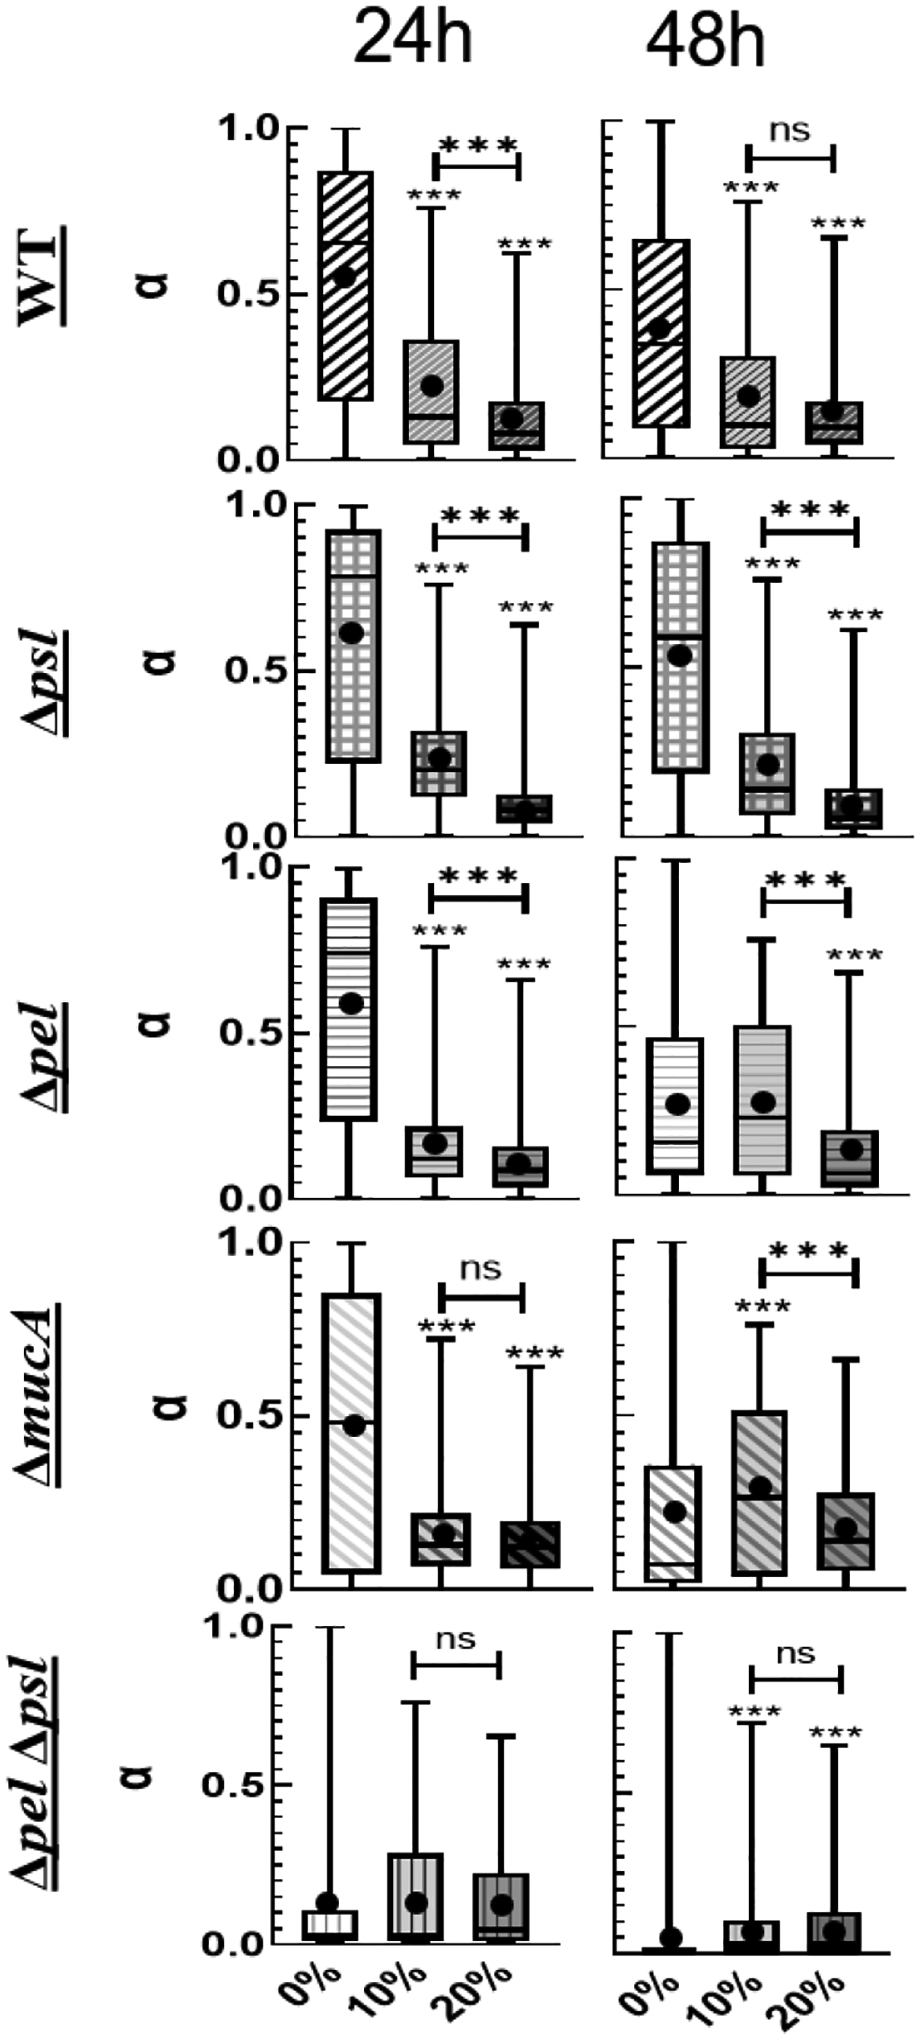
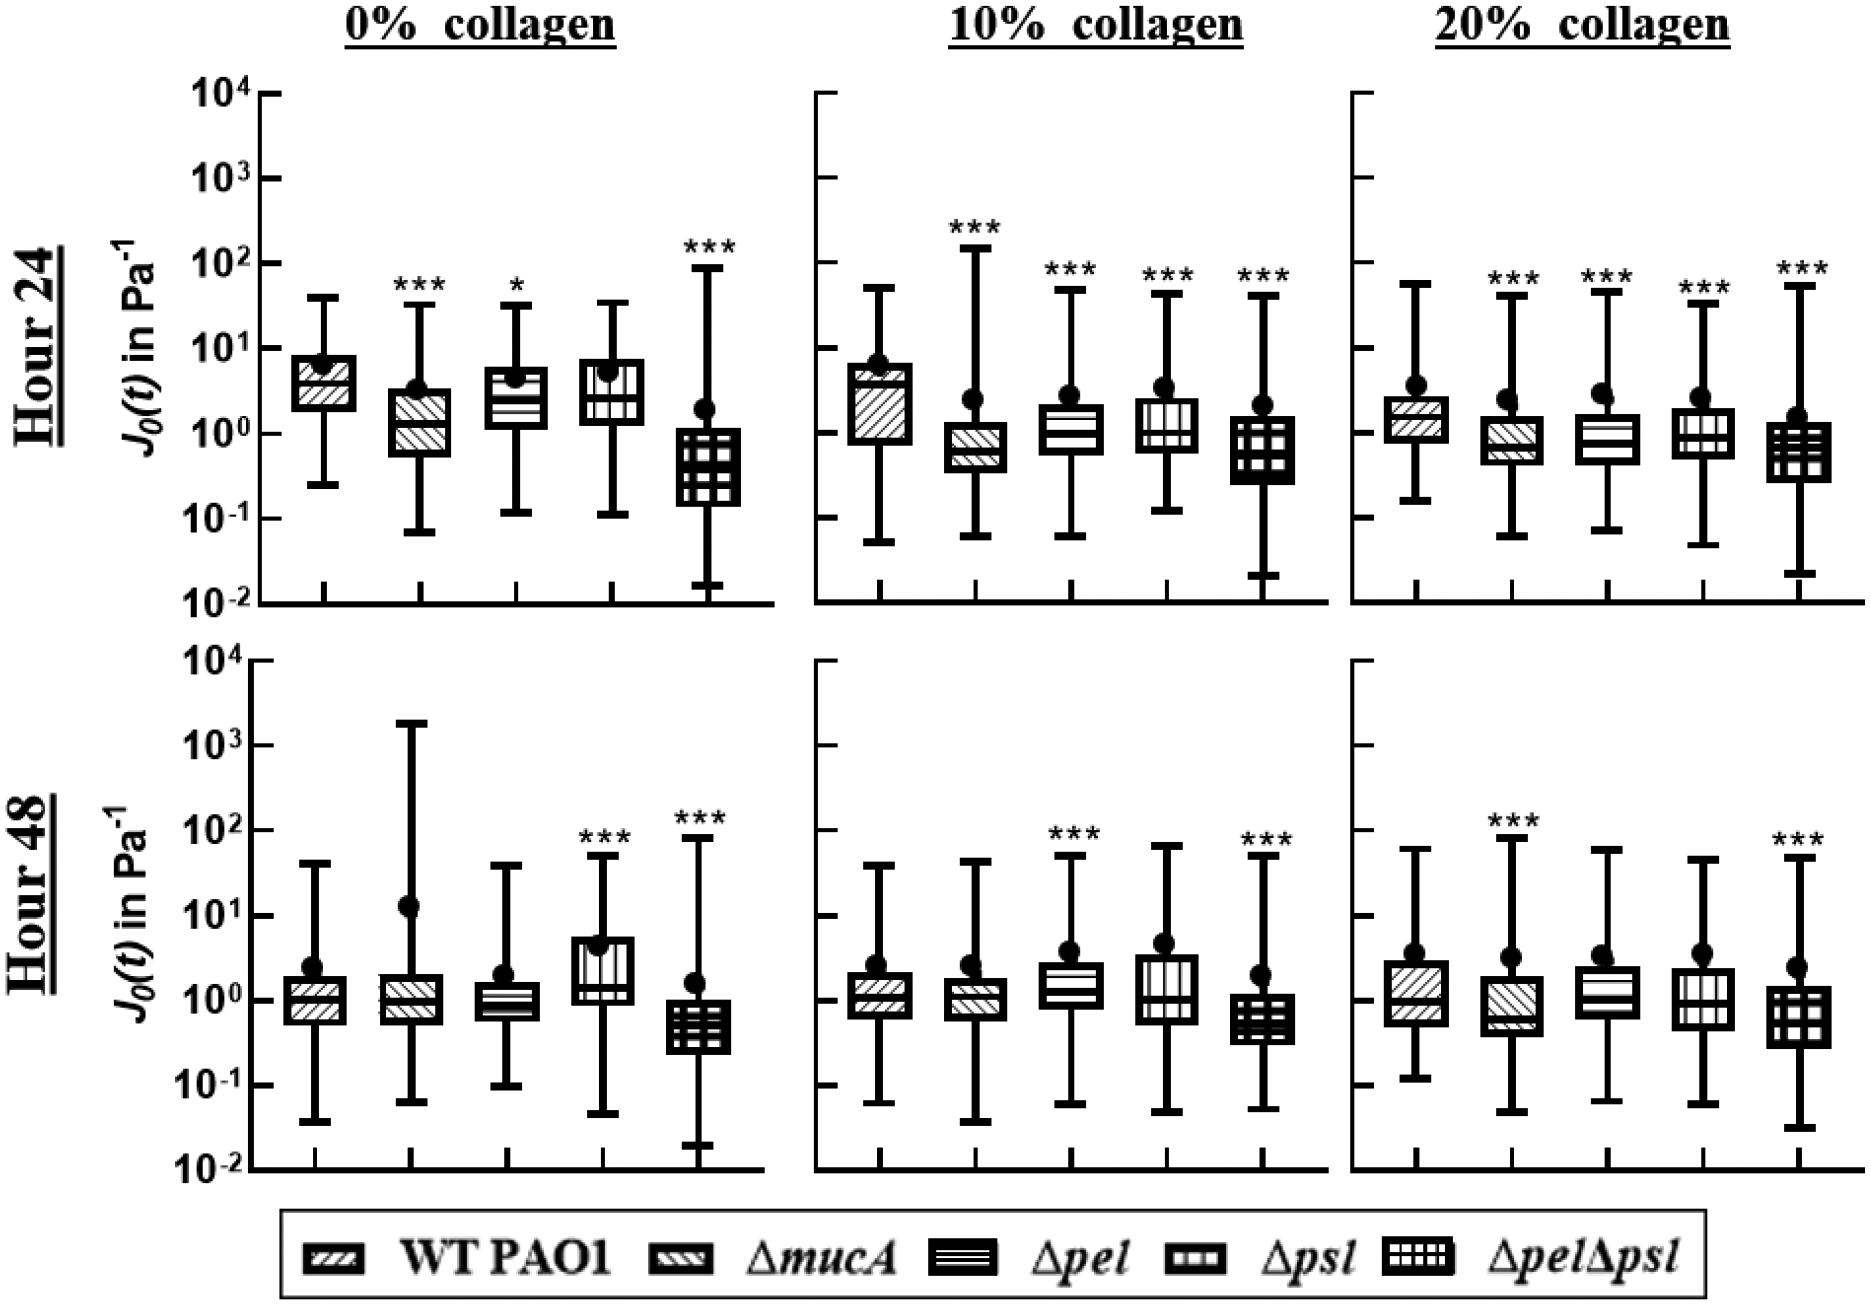
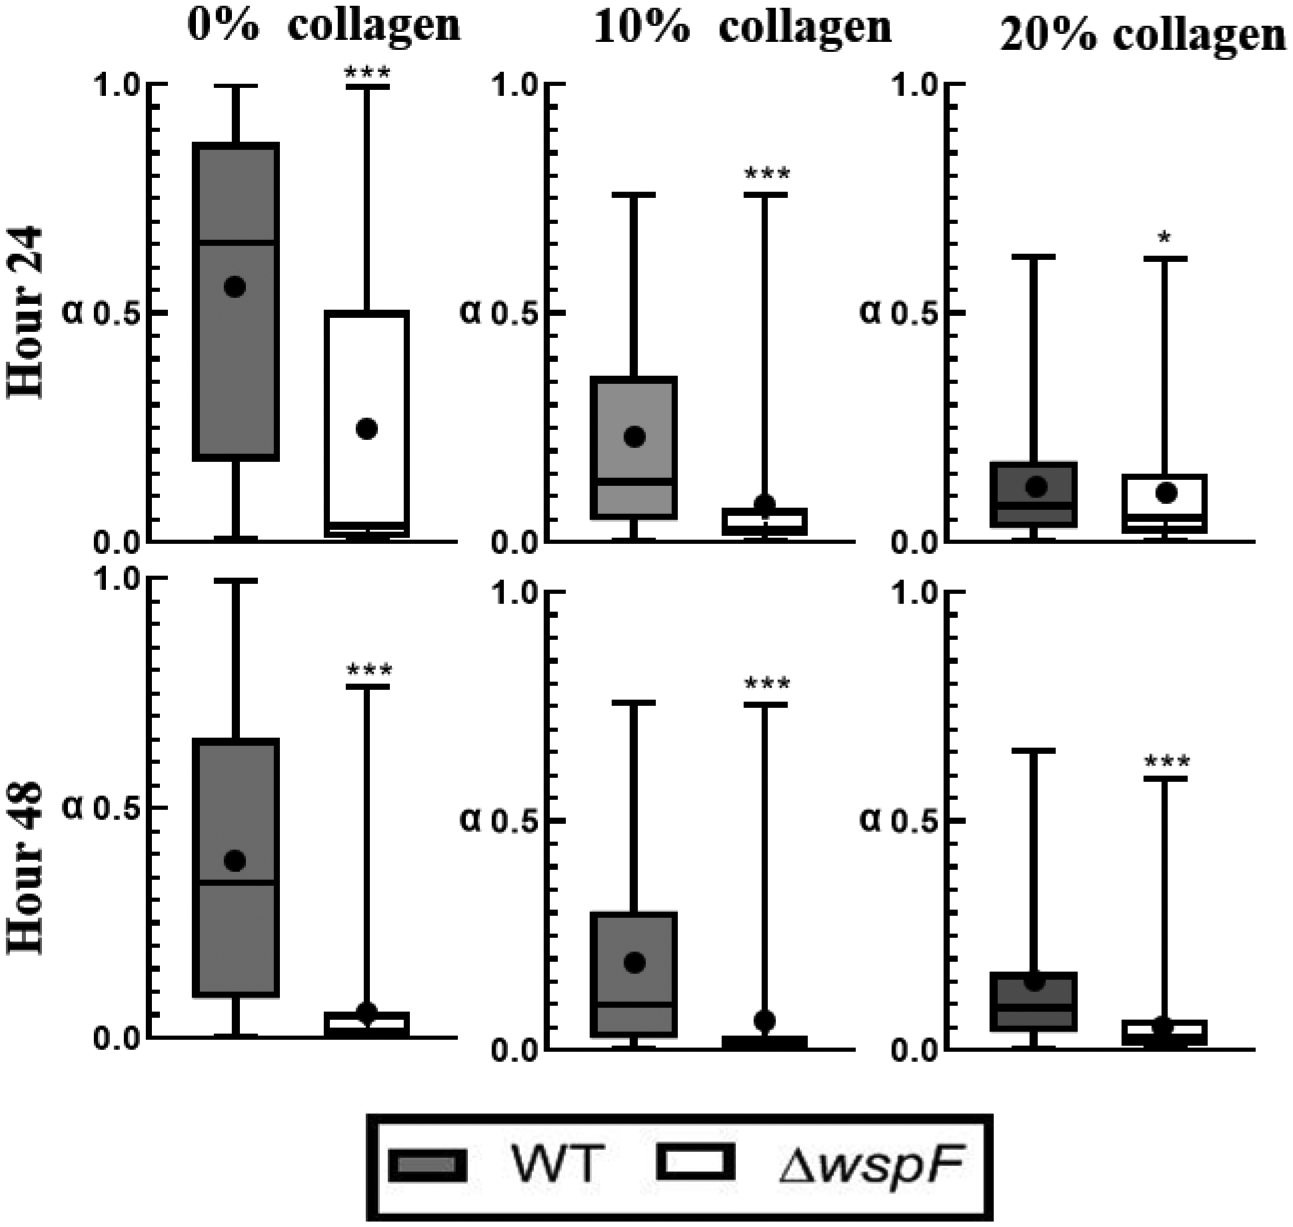
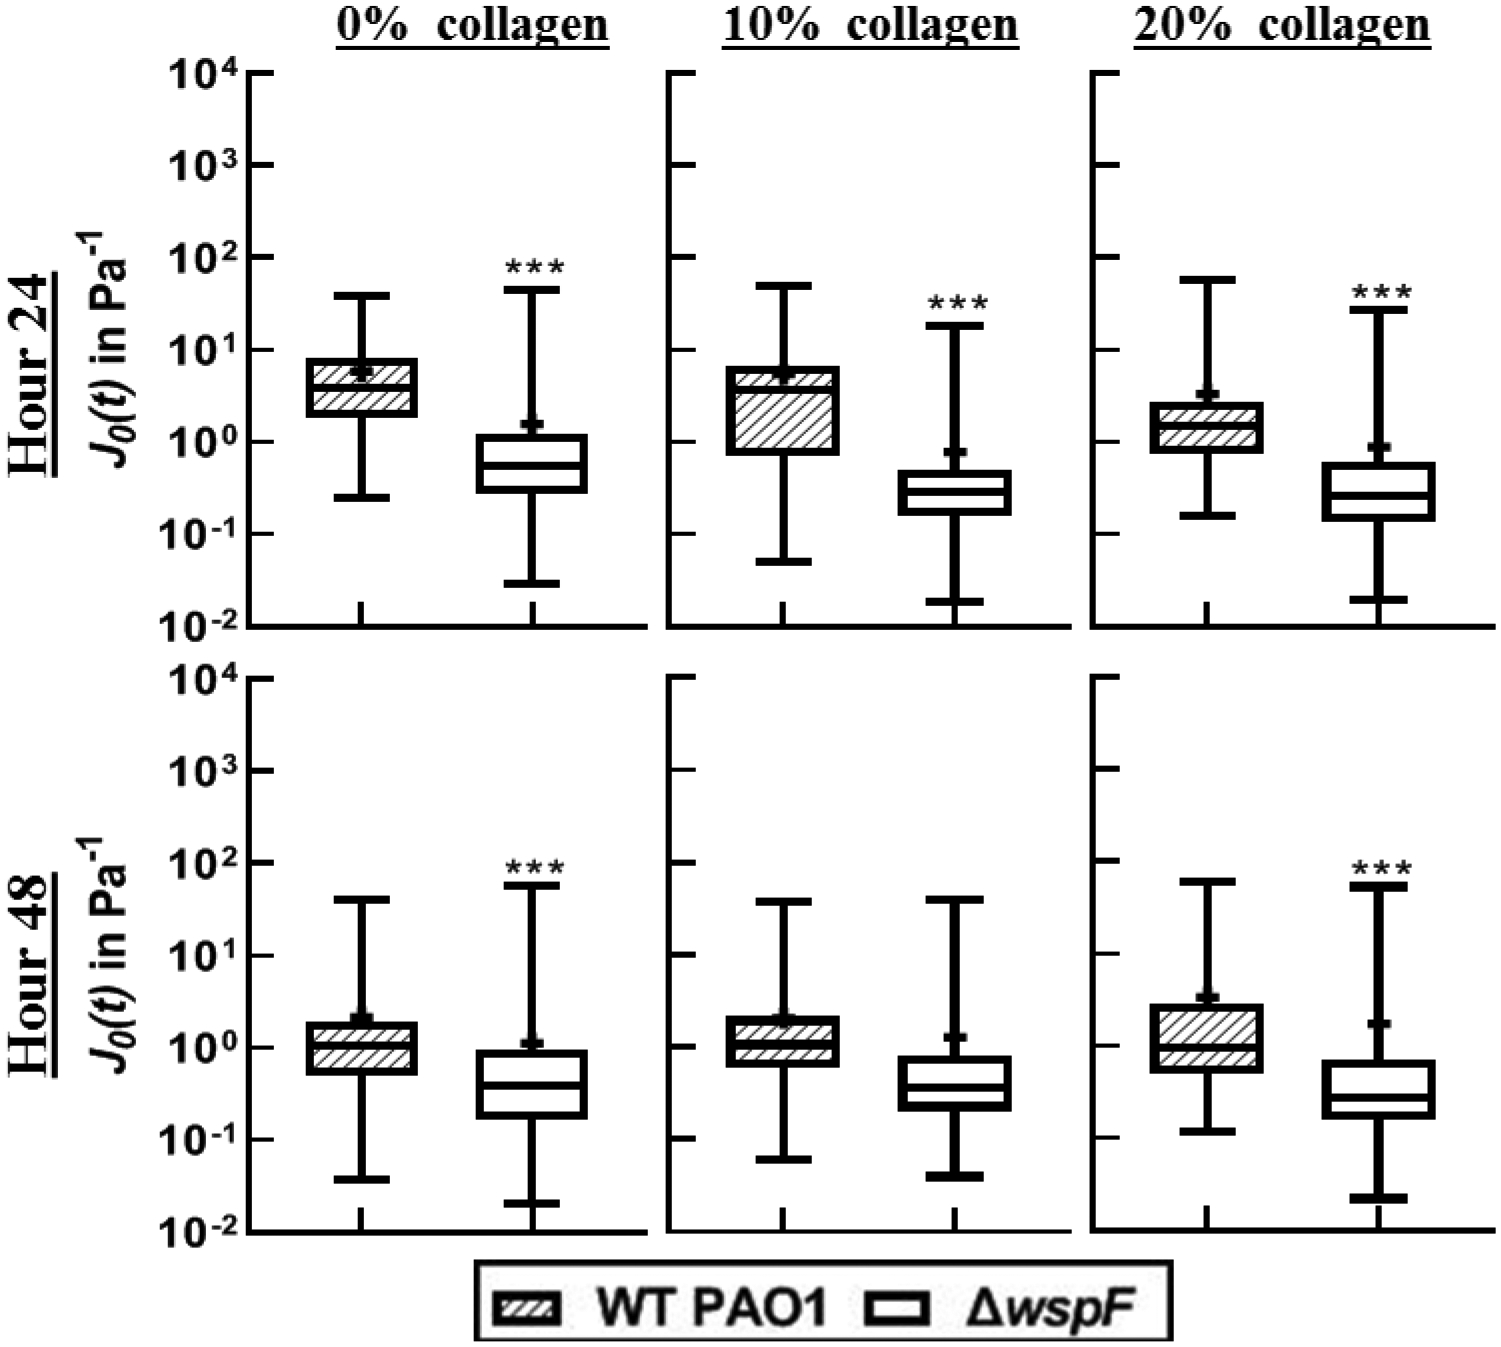
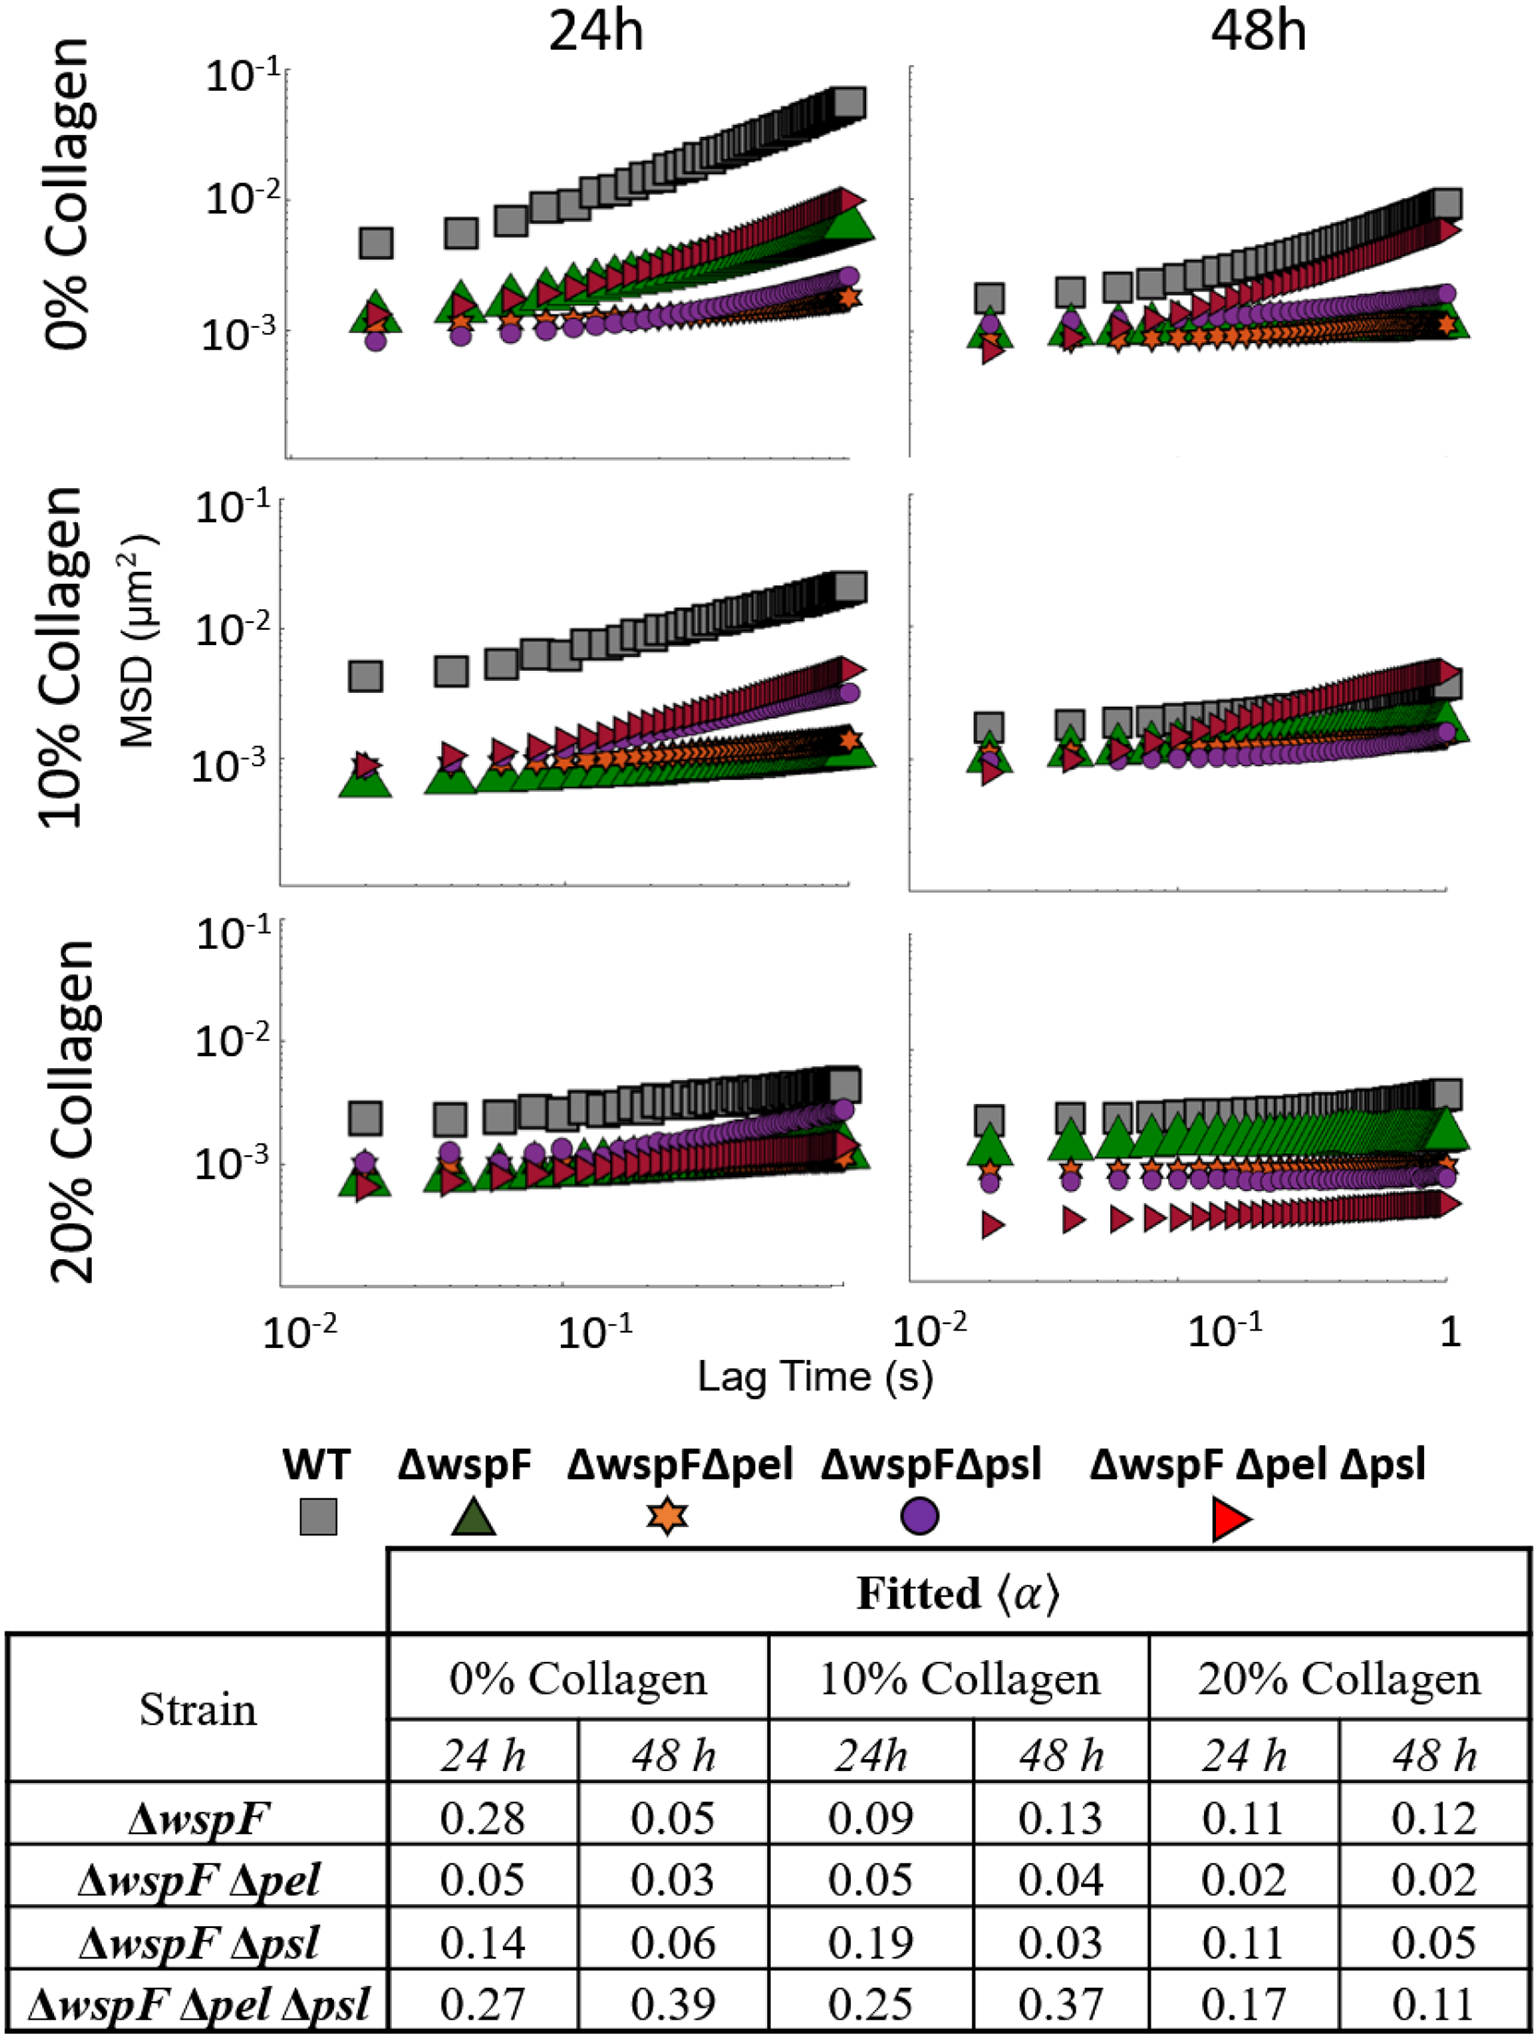
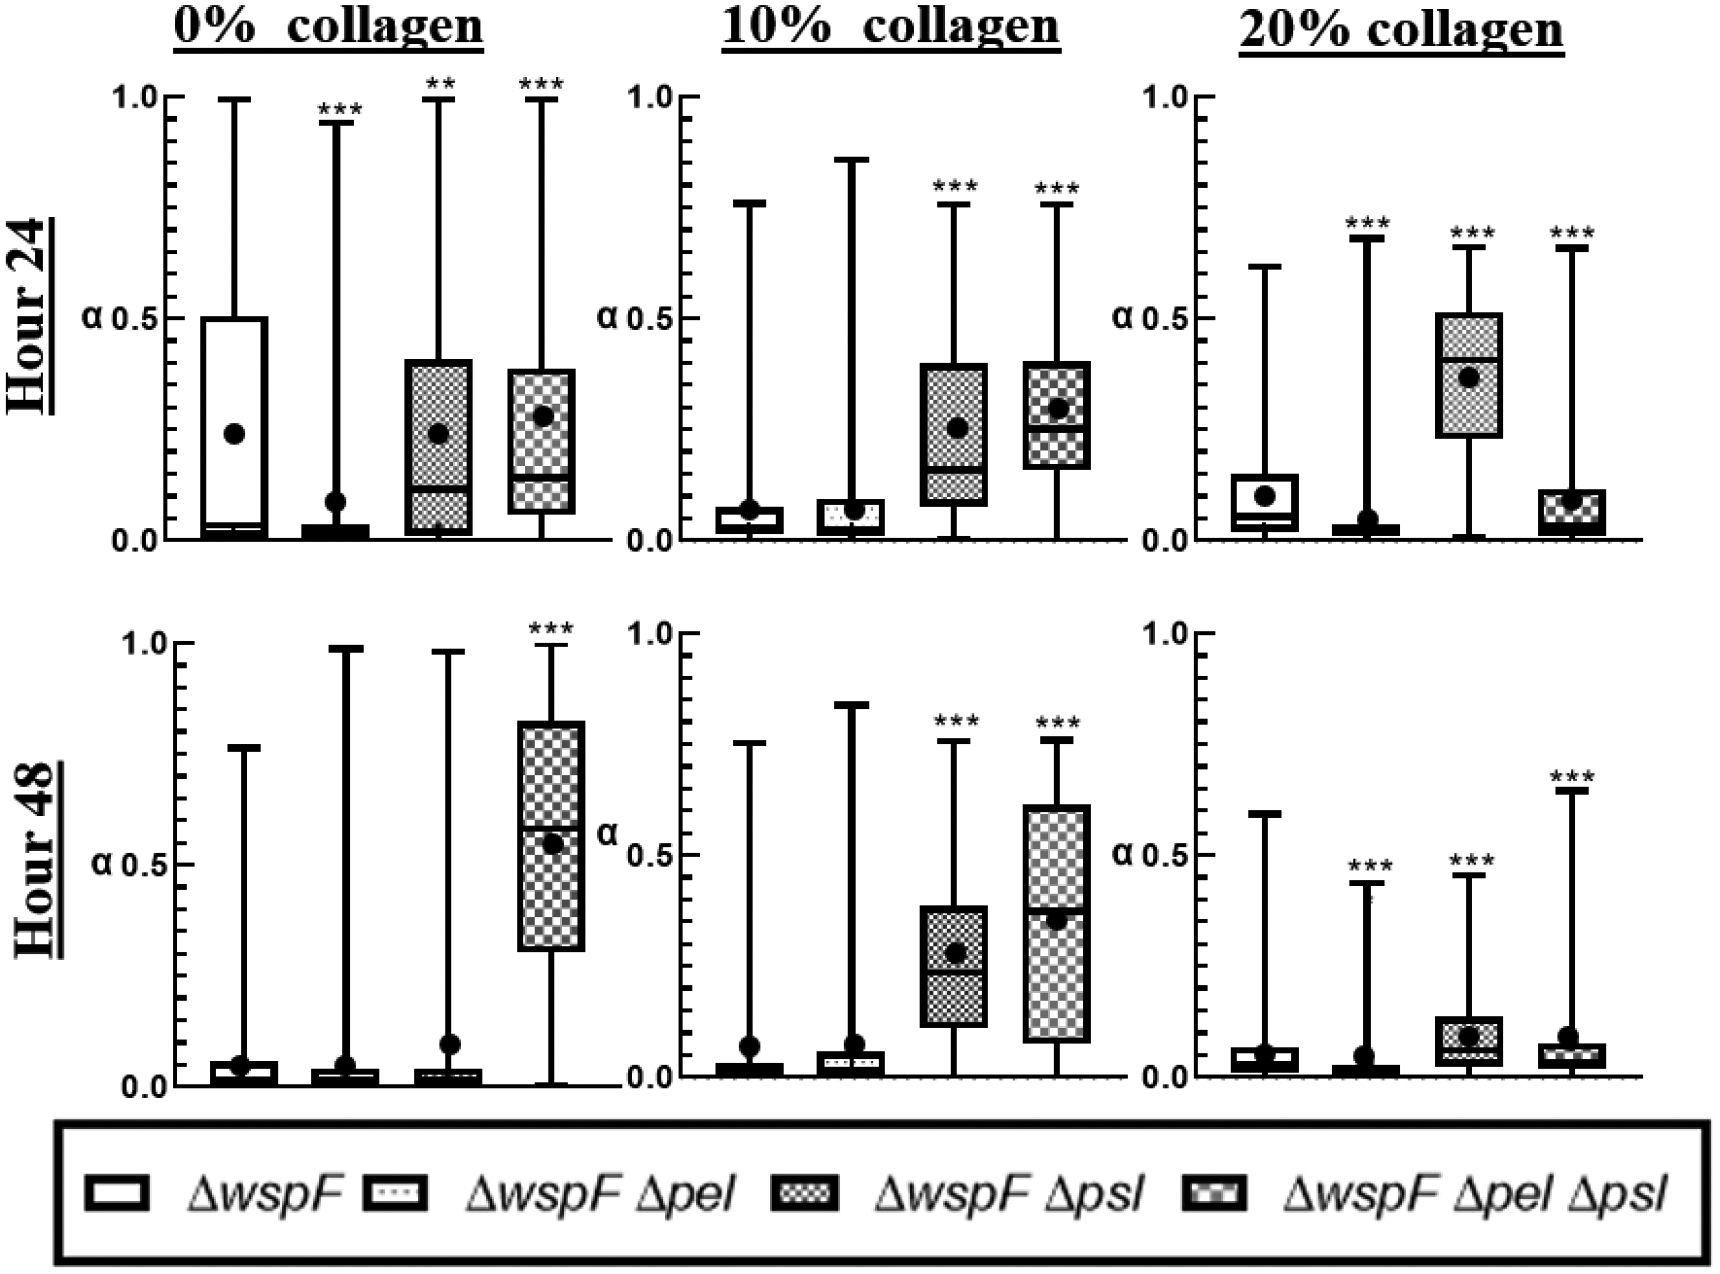
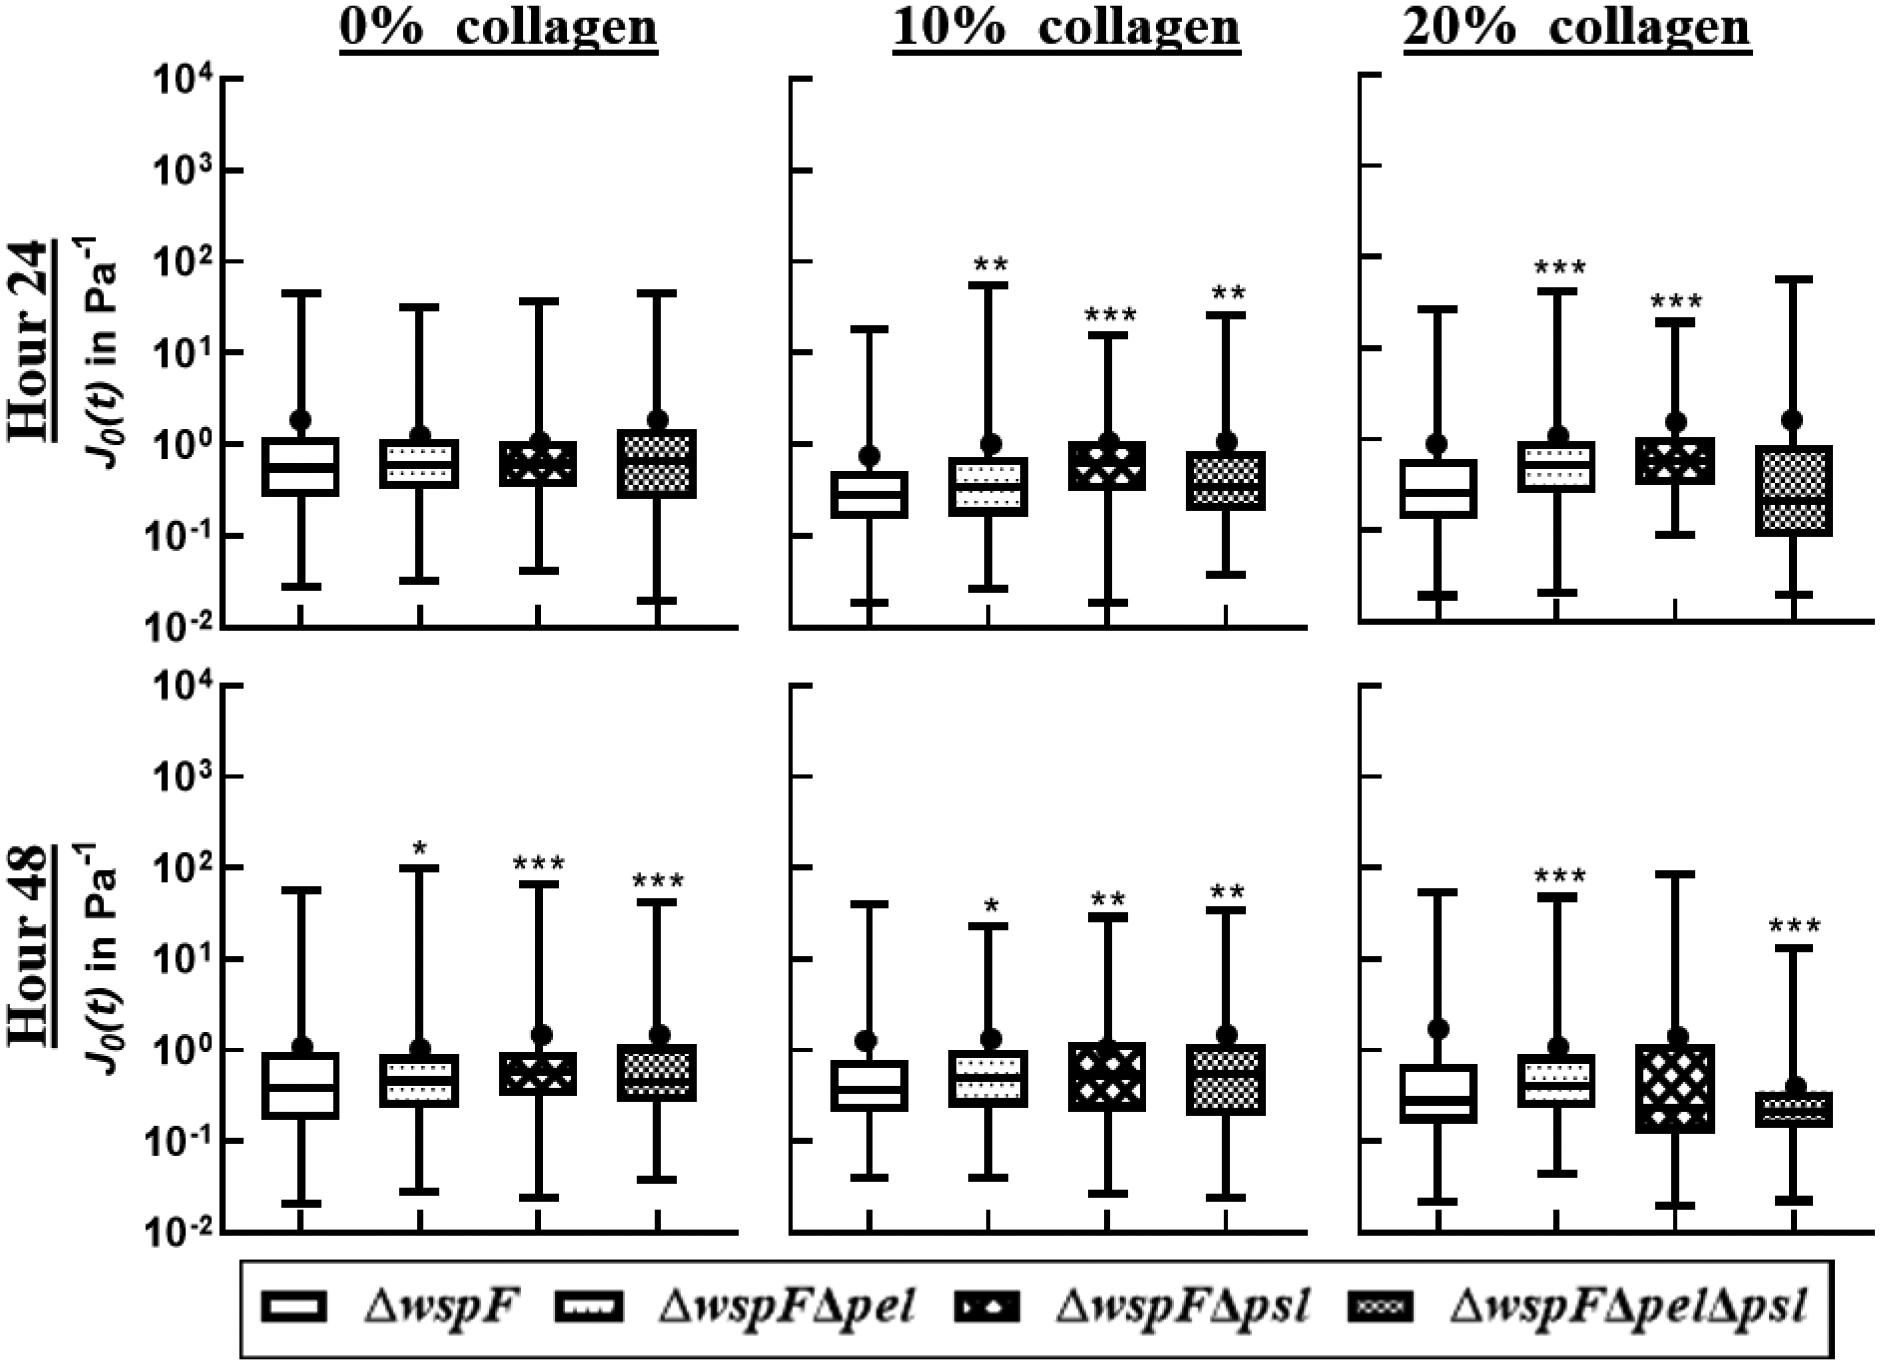
Pseudomonas aeruginosa is an opportunistic pathogen that causes thousands of deaths every year in part due to its ability to form biofilms composed of bacteria embedded in a matrix of self-secreted extracellular polysaccharides (EPS), e-DNA, and proteins. In chronic wounds, biofilms are exposed to the host extracellular matrix, of which collagen is a major component. How bacterial EPS interacts with host collagen and whether this interaction affects biofilm viscoelasticity is not well understood. Since physical disruption of biofilms is often used in their removal, knowledge of collagen's effects on biofilm viscoelasticity may enable new treatment strategies that are better tuned to biofilms growing in host environments. In this work, biofilms are grown in the presence of different concentrations of collagen that mimic in vivo conditions. In order to explore collagen's interaction with EPS, nine strains of P. aeruginosa with different patterns of EPS production were used to grow biofilms. Particle tracking microrheology was used to characterize the mechanical development of biofilms over two days. Collagen is found to decrease biofilm compliance and increase relative elasticity regardless of the EPS present in the system. However, this effect is minimized when biofilms overproduce EPS. Collagen appears to become a de facto component of the EPS, through binding to bacteria or physical entanglement.


Figures

Figure 1:
Figure 1:
Microchannel schematic. Cross section of channel is 100×60 μm2. Channel length is 6 mm with reference locations 1mm apart.
Figure 2:
Figure 2:
Ensemble mean squared displacement as a function of lag time for all WT derived strains for all times and collagen concentrations. Summary of slope values provided in table.
Figure 3:
Figure 3:
Distribution of alpha from individual particle tracks. The box represents the middle 50% of the data, the line within the box represents the median of the distribution, the black dot represents the mean, the upper vertical line represents the upper quartile, and the lower vertical line represents the bottom quartile. P≤0.05 demarcated with *, P≤0.01 demarcated with **, and P≤0.001 demarcated with ***.
Figure 4:
Figure 4:
Distribution of α organized by strain as a function of collagen concentration. P≤0.05 demarcated with *, P≤0.01 demarcated with **, and P≤0.001 demarcated with ***.
Figure 5:
Figure 5:
Distribution of compliance at t=0.2s. The box represents the middle 50% of the data, the line within the box represents the median of the distribution, the black dot represents the mean, the upper vertical line represents the upper quartile, and the lower vertical line represents the bottom quartile. P≤0.05 demarcated with *, P≤0.01 demarcated with **, and P≤0.001 demarcated with ***.
Figure 6:
Figure 6:
Distribution of alpha in a Box-whisker plot comparing c-di-GMP over-expressers to WT strain. The box represents the middle 50% of the data, line within the box represents the median of the distribution, the black dot represents the mean, the top line represents the upper quartile, and the bottom line represents the bottom quartile. P≤0.05 demarcated with *, P≤0.01 demarcated with **, and P≤0.001 demarcated with ***.
Figure 7:
Figure 7:
Distribution of compliance at time t=0.2 in a Box-whisker plot comparing c-di-GMP over-expressers to WT strains. The box represents the middle 50% of the data, the line within the box represents the median of the distribution, the black dot represents the mean, the upper vertical line represents the upper quartile, and the lower vertical line represents the bottom quartile. P≤0.05 demarcated with *, P≤0.01 demarcated with **, and P≤0.001 demarcated with ***.
Figure 8:
Figure 8:
Ensemble MSD as a function of lag time for all strains with baseline c-di-GMP expression strains at all times and collagen concentrations. Summary of slope values provided in table.
Figure 9
Figure 9
Distribution of alpha in a box-whisker plot. The box represents the middle 50% of the data, the line within the box represents the median of the distribution, the black dot represents the mean, the upper vertical line represents the upper quartile, and the lower vertical line represents the bottom quartile. P≤0.05 demarcated with *, P≤0.01 demarcated with **, and P≤0.001 demarcated with ***.
Figure 10:
Figure 10:
Distribution of compliance at t=0.2s in a box-whisker plot. The box represents the middle 50% of the data, the line within the box represents the median of the distribution, the black dot represents the mean, the upper vertical line represents the upper quartile, and the lower vertical line represents the bottom quartile. P≤0.05 demarcated with *, P≤0.01 demarcated with **, and P≤0.001 demarcated with ***.

References

    1. Costerton JW, Stewart PS and Greenberg EP, Science, 1999, 284, 1318–1322. - PubMed
    1. Costerton JW, International journal of antimicrobial agents, 1999, 11, 217–221. - PubMed
    1. Hall-Stoodley L, Costerton JW and Stoodley P, Nature Reviews Microbiology, 2004, 2, 95–108. - PubMed
    1. Bjarnsholt T, Jensen PØ, Fiandaca MJ, Pedersen J, Hansen CR, Andersen CB, Pressler T, Givskov M and Høiby N, Pediatric pulmonology, 2009, 44, 547–558. - PubMed
    1. Bjarnsholt T, Kirketerp‐Møller K, Jensen PØ, Madsen KG, Phipps R, Krogfelt K, Høiby N and Givskov M, Wound repair and regeneration, 2008, 16, 2–10. - PubMed