. 2021 Aug;24(2):564.
doi: 10.3892/mmr.2021.12203. Epub 2021 Jun 10.

Resveratrol affects the expression of uric acid transporter by improving inflammation

Affiliations

Resveratrol affects the expression of uric acid transporter by improving inflammation

Xuemei Zhang et al. Mol Med Rep. 2021 Aug.

Abstract

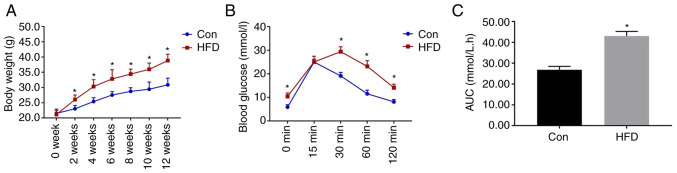
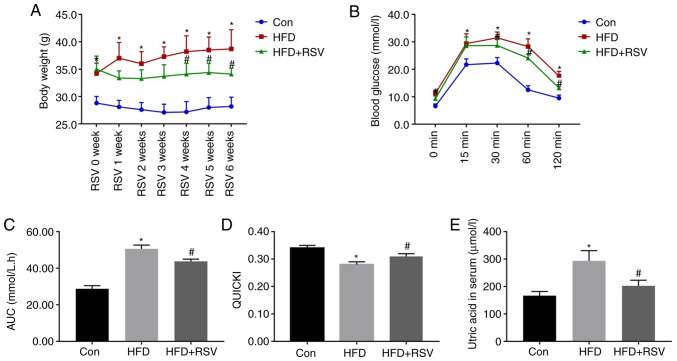
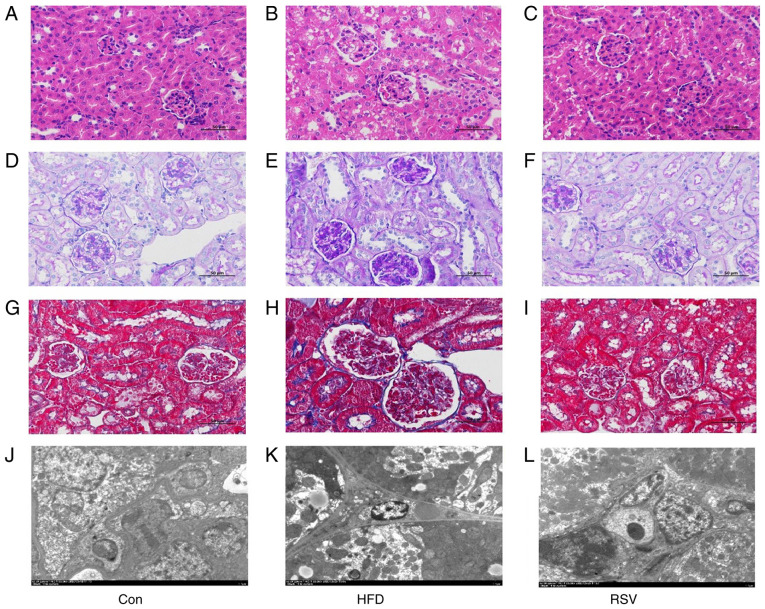
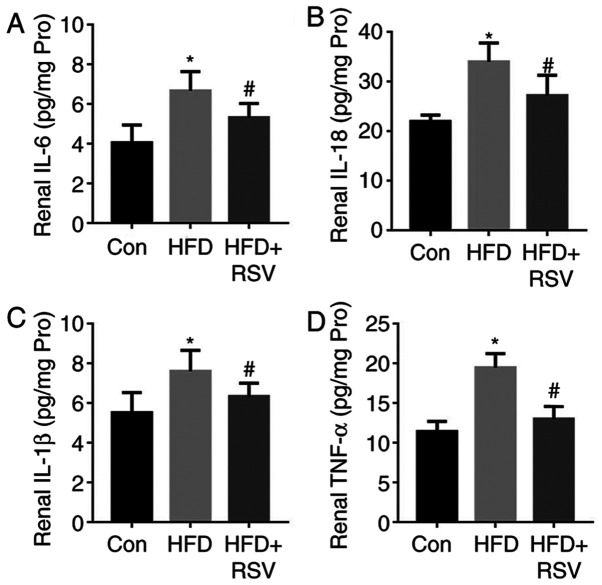
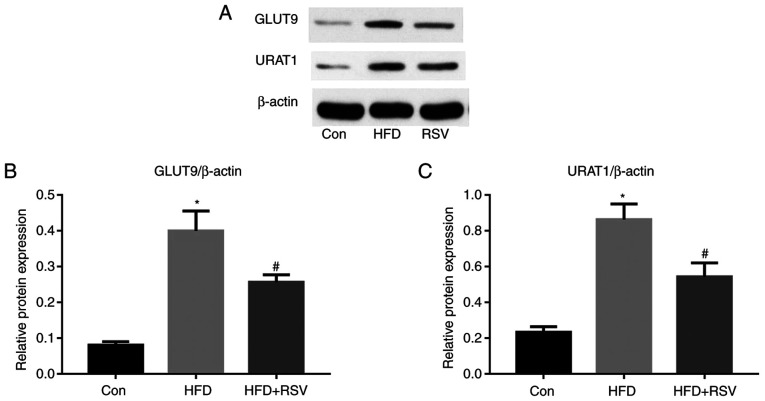
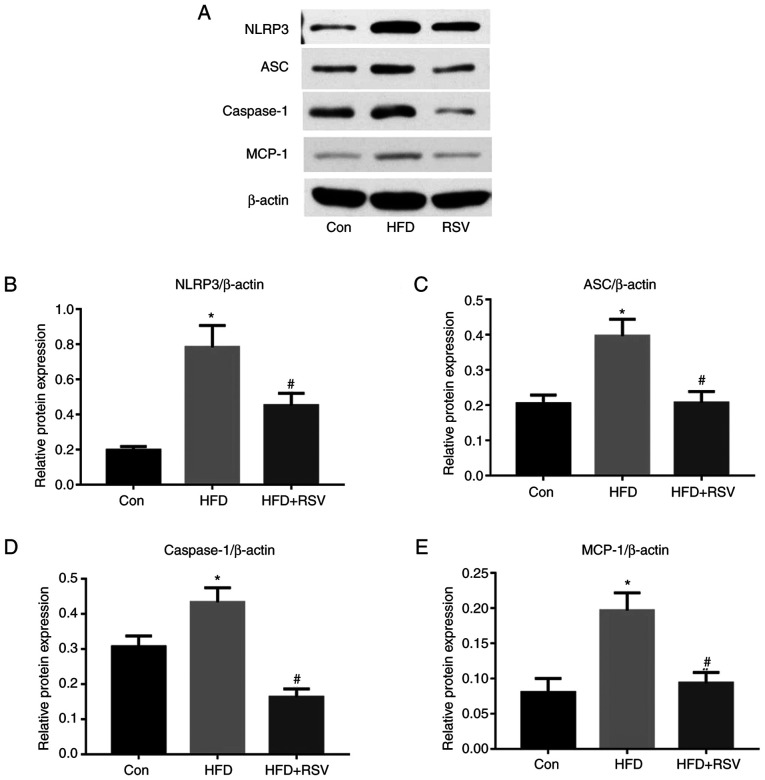
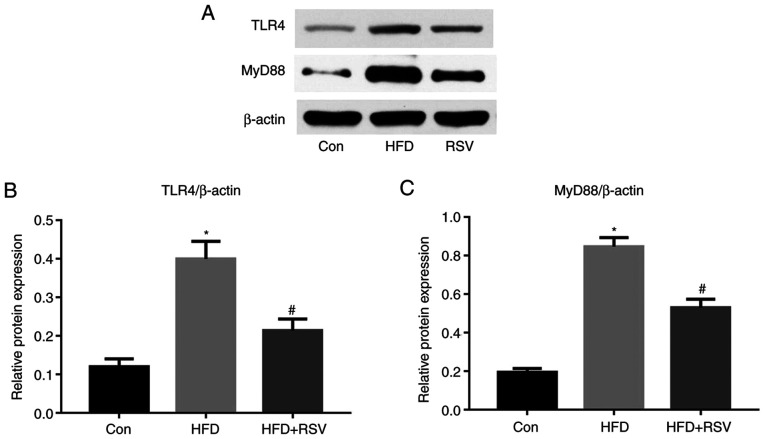
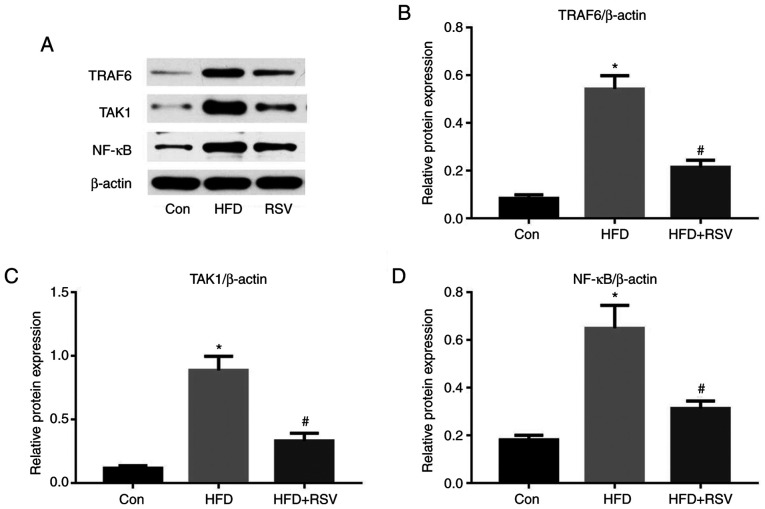
Resveratrol (RSV), a polyphenol, non‑flavonoid plant‑derived antitoxin, ameliorates hyperuricemia and kidney inflammation. The present study aimed to establish a model of high‑fat diet (HFD)‑induced insulin resistance (IR) and to determine the specific mechanism of RSV to improve kidney inflammation and reduce uric acid (UA). C57BL/6J mice were fed a HFD for 12 weeks and their glucose tolerance was evaluated by intraperitoneal glucose tolerance testing. The mice were then administered RSV for 6 weeks, and blood and kidney samples were collected. Serum UA and insulin concentrations were determined using ELISA kits. Hematoxylin and eosin, periodic acid‑Schiff and Masson staining were performed to observe the pathological changes of the kidney, and electron microscopy was used to observe changes in the kidney ultrastructure. The renal concentrations of interleukin (IL)‑6, IL‑18, IL‑1β and tumor necrosis factor‑α (TNF‑α) were measured using ELISA kits, and western blotting evaluated changes in the protein expression levels of various indicators. RSV significantly ameliorated HFD‑induced IR and reduced blood UA levels. Long‑term IR can lead to lipid deposition, glycogen accumulation, inflammatory damage and fibrotic changes in the kidney of mice. This leads to a significant increase in the expression of UA transport‑related proteins, an increase in UA reabsorption and an increase in blood UA levels. Notably, RSV intervention was able to reverse this process. The effect of RSV may be achieved by inhibiting the NOD‑like receptor family, pyrin domain‑containing 3 (NLRP3) inflammasome and Toll‑like receptor 4 (TLR4)/myeloid differentiation factor 88/nuclear factor‑κB signaling pathway. In conclusion, RSV may improve kidney inflammation through TLR4 and NLRP3 signaling pathways, and reduce the expression of UA transporter proteins in the kidney of insulin‑resistant mice, thereby reducing blood UA levels.

Keywords: GLUT9; RSV; UA; URAT1; inflammation.


Conflict of interest statement

The authors declare that they have no competing interests.

Figures

Figure 1.
Figure 1.
Body mass and intraperitoneal glucose tolerance testing data after diet consumption for 12 weeks. (A) Body mass of the Con and HFD-fed groups. (B) Blood glucose concentrations 0, 15, 30, 60 and 120 min after the intraperitoneal injection of glucose. (C) Area under the glucose curve. Data are presented as the mean ± SD (n=10/Con group; n=24, HFD group). Student's t-test was used for statistical analysis. *P<0.05 vs. Con group. AUC, area under the curve; Con, control; HFD, high-fat diet.
Figure 2.
Figure 2.
Body mass, serum uric acid concentration, glucose tolerance and insulin sensitivity after RSV administration. (A) Body mass of Con, HFD-fed and HFD + RSV-administered groups. (B) Blood glucose concentrations 0, 15, 30, 60 and 120 min after the intraperitoneal injection of glucose. (C) Area under the glucose curve. (D) Quantitative insulin sensitivity check index. (E) Serum uric acid concentrations in the Con, HFD and HFD + RSV groups. Data are presented as the mean ± SD (n=10). One-way ANOVA, followed by Bonferroni's post hoc, or Tamhane's multiple comparison post hoc tests, was used for statistical analysis. *P<0.05 vs. Con group; #P<0.05 vs. HFD group. AUC, area under the curve; Con, control; HFD, high-fat diet; RSV, resveratrol.
Figure 3.
Figure 3.
Effects of RSV administration on the renal histopathology of HFD-fed mice. (A-C) H&E staining; (D-F) periodic acid-Schiff staining; (G-I) Masson staining; and (J-L) transmission electron microscopy. (A-I) Magnification, ×400, scale bar, 50 µm; (J-L) magnification, ×2,500; scale bar, 5.0 µm. Con, control; HFD, high-fat diet; RSV, resveratrol.
Figure 4.
Figure 4.
Effects of RSV on the serum pro-inflammatory cytokine concentrations of HFD-fed mice. (A) IL-6, (B) IL-18, (C) IL-1β and (D) TNF-α levels. Data are presented as the mean ± SD (n=10). *P<0.05 vs. Con group; #P<0.05 vs. HFD group. Con, control; HFD, high-fat diet; IL, interleukin; RSV, resveratrol; TNF-, tumor necrosis factor-α.
Figure 5.
Figure 5.
Effect of RSV administration on the protein expression levels of GLUT9 and URAT1 in the kidneys of HFD-fed mice. (A) Western blot analysis of GLUT9 and URAT1 expression in the kidney. Relative protein expression levels of (B) GLUT9 and (C) URAT1, normalized to β-actin. Data are presented as the mean ± SD (n=10). *P<0.05 vs. Con group; #P<0.05 vs. HFD group. Con, control; GLUT9, glucose transporter 9; HFD, high-fat diet; RSV, resveratrol; URAT1, urate transporter 1.
Figure 6.
Figure 6.
Effect of RSV administration on the protein expression levels of MCP-1, NLRP3, ASC and caspase-1 in the kidneys of HFD-fed mice. (A) Western blot analysis of NLRP3, ASC, caspase-1, and MCP-1 expression in the kidney. Relative protein expression levels of (B) NLRP3, (C) ASC, (D) caspase-1 and (E) MCP-1, normalized to β-actin. Data are presented as the mean ± SD (n=10). *P<0.05 vs. Con group; #P<0.05 vs. HFD group. ASC, apoptosis-associated speck-like protein; Con, control; HFD, high-fat diet; MCP-1, monocyte chemotactic protein-1; NLRP3, NOD-like receptor family, pyrin domain-containing 3; RSV, resveratrol.
Figure 7.
Figure 7.
Effect of RSV administration on the protein expression levels of TLR4 and MyD88 in the kidneys of HFD-fed mice. (A) Western blot analysis of TLR4 and MyD88 expression in the kidney. Relative protein expression levels of (B) TLR4 and (C) MyD88, normalized to β-actin. Data are presented as the mean ± SD (n=10). *P<0.05 vs. Con group; #P<0.05 vs. HFD group. Con, control; HFD, high-fat diet; MyD88, myeloid differentiation factor 88; RSV, resveratrol; TLR4, Toll-like receptor 4.
Figure 8.
Figure 8.
Effect of RSV on the protein expression levels of TRAF6, TAK1 and NF-κB in the kidneys of HFD-fed mice. (A) Western blot analysis of TRAF6, TAK1 and NF-κB in the kidney. Relative protein expression levels of (B) TRAF6, (C) TAK1 and (D) NF-κB, normalized to β-actin. Data are presented as the mean ± SD (n=10). *P<0.05 vs. Con group; #P<0.05 vs. HFD group. Con, control; HFD, high-fat diet; NF-κB, nuclear factor-κB; RSV, resveratrol; TAK1, TGF-β-activated kinase 1; TRAF6, tumor necrosis factor receptor-associated factor 6.

References

    1. El Ridi R, Tallima H. Physiological functions and pathogenic potential of uric acid: A review. J Adv Res. 2017;8:487–493. doi: 10.1016/j.jare.2017.03.003. - DOI - PMC - PubMed
    1. Billiet L, Doaty S, Katz JD, Velasquez MT. Review of hyperuricemia as new marker for metabolic syndrome. ISRN Rheumatol. 2014;2014:852954. doi: 10.1155/2014/852954. - DOI - PMC - PubMed
    1. Sharaf El Din UAA, Salem MM, Abdulazim DO. Uric acid in the pathogenesis of metabolic, renal, and cardiovascular diseases: A review. J Adv Res. 2017;8:537–548. doi: 10.1016/j.jare.2016.11.004. - DOI - PMC - PubMed
    1. Tan PK, Farrar JE, Gaucher EA, Miner JN. Coevolution of URAT1 and Uricase during Primate Evolution: Implications for Serum Urate Homeostasis and Gout. Mol Biol Evol. 2016;33:2193–2200. doi: 10.1093/molbev/msw116. - DOI - PMC - PubMed
    1. Ebert K, Ludwig M, Geillinger KE, Schoberth GC, Essenwanger J, Stolz J, Daniel H, Witt H. Reassessment of GLUT7 and GLUT9 as Putative Fructose and Glucose Transporters. J Membr Biol. 2017;250:171–182. doi: 10.1007/s00232-016-9945-7. - DOI - PubMed

MeSH terms

Substances