Lineage-specific mechanisms and drivers of breast cancer chemoresistance revealed by 3D biomimetic culture
- PMID: 34109737
- PMCID: PMC8847989
- DOI: 10.1002/1878-0261.13037
Lineage-specific mechanisms and drivers of breast cancer chemoresistance revealed by 3D biomimetic culture
Abstract
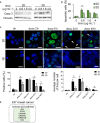
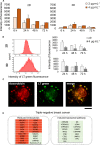
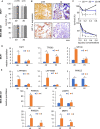
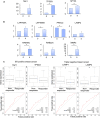
To improve the success rate of current preclinical drug trials, there is a growing need for more complex and relevant models that can help predict clinical resistance to anticancer agents. Here, we present a three-dimensional (3D) technology, based on biomimetic collagen scaffolds, that enables the modeling of the tumor hypoxic state and the prediction of in vivo chemotherapy responses in terms of efficacy, molecular alterations, and emergence of resistance mechanisms. The human breast cancer cell lines MDA-MB-231 (triple negative) and MCF-7 (luminal A) were treated with scaling doses of doxorubicin in monolayer cultures, 3D collagen scaffolds, or orthotopically transplanted murine models. Lineage-specific resistance mechanisms were revealed by the 3D tumor model. Reduced drug uptake, increased drug efflux, and drug lysosomal confinement were observed in triple-negative MDA-MB-231 cells. In luminal A MCF-7 cells, the selection of a drug-resistant subline from parental cells with deregulation of p53 pathways occurred. These cells were demonstrated to be insensitive to DNA damage. Transcriptome analysis was carried out to identify differentially expressed genes (DEGs) in treated cells. DEG evaluation in breast cancer patients demonstrated their potential role as predictive biomarkers. High expression of the transporter associated with antigen processing 1 (TAP1) and the tumor protein p53-inducible protein 3 (TP53I3) was associated with shorter relapse in patients affected by ER+ breast tumor. Likewise, the same clinical outcome was associated with high expression of the lysosomal-associated membrane protein 1 LAMP1 in triple-negative breast cancer. Hypoxia inhibition by resveratrol treatment was found to partially re-sensitize cells to doxorubicin treatment. Our model might improve preclinical in vitro analysis for the translation of anticancer compounds as it provides: (a) more accurate data on drug efficacy and (b) enhanced understanding of resistance mechanisms and molecular drivers.
Keywords: 3D models; DNA repair; breast cancer; doxorubicin; drug resistance; lysosomes.
© 2021 The Authors. Published by FEBS Press and John Wiley & Sons Ltd.
Conflict of interest statement
The authors declare no conflict of interest.
Figures


Similar articles
-
PLLA Porous Scaffold as a 3D Breast Cancer Model to Investigate Drug Resistance.J Biomed Mater Res A. 2025 Jan;113(1):e37836. doi: 10.1002/jbm.a.37836. Epub 2024 Nov 16. J Biomed Mater Res A. 2025. PMID: 39548890
-
Three-dimensional tissue culture model of human breast cancer for the evaluation of multidrug resistance.J Tissue Eng Regen Med. 2018 Sep;12(9):1959-1971. doi: 10.1002/term.2729. Epub 2018 Aug 13. J Tissue Eng Regen Med. 2018. PMID: 30055109
-
Enhancing chemosensitivity of wild-type and drug-resistant MDA-MB-231 triple-negative breast cancer cell line to doxorubicin by silencing of STAT 3, Notch-1, and β-catenin genes.Breast Cancer. 2020 Sep;27(5):989-998. doi: 10.1007/s12282-020-01098-9. Epub 2020 Apr 23. Breast Cancer. 2020. PMID: 32328816
-
Breast cancer preclinical models: a vital resource for comprehending disease mechanisms and therapeutic development.EXCLI J. 2025 Feb 19;24:267-285. doi: 10.17179/excli2024-7973. eCollection 2025. EXCLI J. 2025. PMID: 40071025 Free PMC article. Review.
-
3D Breast Tumor Models for Radiobiology Applications.Cancers (Basel). 2021 Nov 15;13(22):5714. doi: 10.3390/cancers13225714. Cancers (Basel). 2021. PMID: 34830869 Free PMC article. Review.
Cited by
-
Emerging roles of 3D-culture systems in tackling tumor drug resistance.Cancer Drug Resist. 2023 Nov 21;6(4):788-804. doi: 10.20517/cdr.2023.93. eCollection 2023. Cancer Drug Resist. 2023. PMID: 38263982 Free PMC article. Review.
-
Development of a Triple-Negative Breast Cancer Leptomeningeal Disease Model in Zebrafish.Cells. 2023 Mar 24;12(7):995. doi: 10.3390/cells12070995. Cells. 2023. PMID: 37048068 Free PMC article.
-
New Uracil Analog with Exocyclic Methylidene Group Can Reverse Resistance to Taxol in MCF-7 Cancer Cells.Biologics. 2023 May 15;17:69-83. doi: 10.2147/BTT.S405080. eCollection 2023. Biologics. 2023. PMID: 37213261 Free PMC article.
-
Deciphering the Genomic Landscape and Pharmacological Profile of Uncommon Entities of Adult Rhabdomyosarcomas.Int J Mol Sci. 2021 Oct 26;22(21):11564. doi: 10.3390/ijms222111564. Int J Mol Sci. 2021. PMID: 34768995 Free PMC article.
-
Growing Role of 3D In Vitro Cell Cultures in the Study of Cellular and Molecular Mechanisms: Short Focus on Breast Cancer, Endometriosis, Liver and Infectious Diseases.Cells. 2024 Jun 18;13(12):1054. doi: 10.3390/cells13121054. Cells. 2024. PMID: 38920683 Free PMC article. Review.
References
-
- Yan X, Zhou L, Wu Z, Wang X, Chen X, Yang F, Guo Y, Wu M, Chen Y, Li W et al. (2019) High throughput scaffold‐based 3D micro‐tumor array for efficient drug screening and chemosensitivity testing. Biomaterials 198, 167–179. - PubMed
-
- Hay M, Thomas DW, Craighead JL, Economides C & Rosenthal J (2014) Clinical development success rates for investigational drugs. Nat Biotechnol 32, 40–51. - PubMed
MeSH terms
Substances
LinkOut - more resources
Full Text Sources
Medical
Research Materials
Miscellaneous

