

Functional brain network topology across the menstrual cycle is estradiol dependent and correlates with individual well-being
- PMID: 34110041
- PMCID: PMC8453714
- DOI: 10.1002/jnr.24898
Functional brain network topology across the menstrual cycle is estradiol dependent and correlates with individual well-being
Abstract
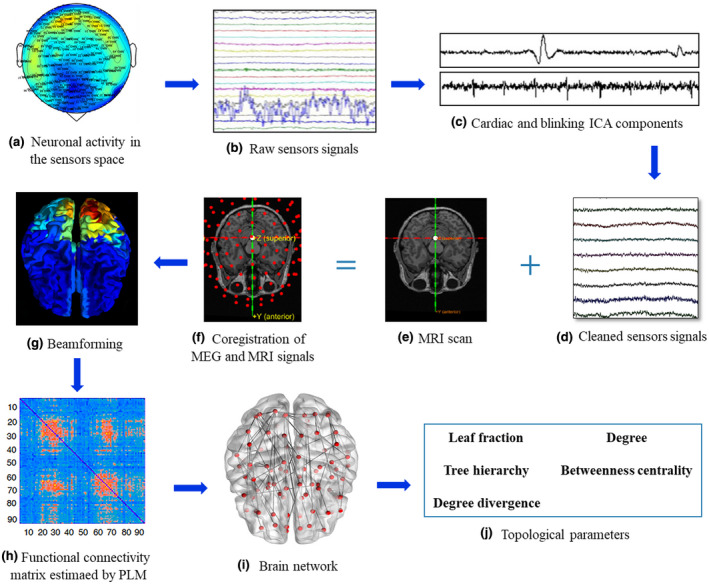
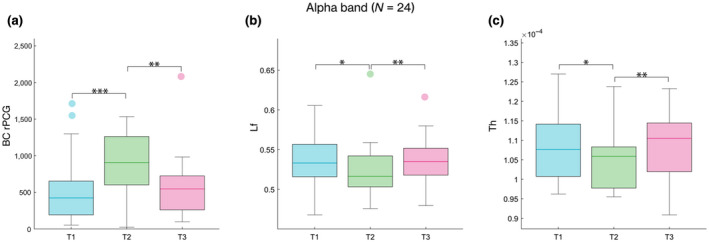
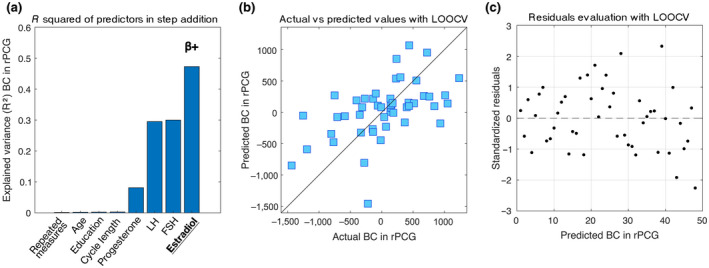
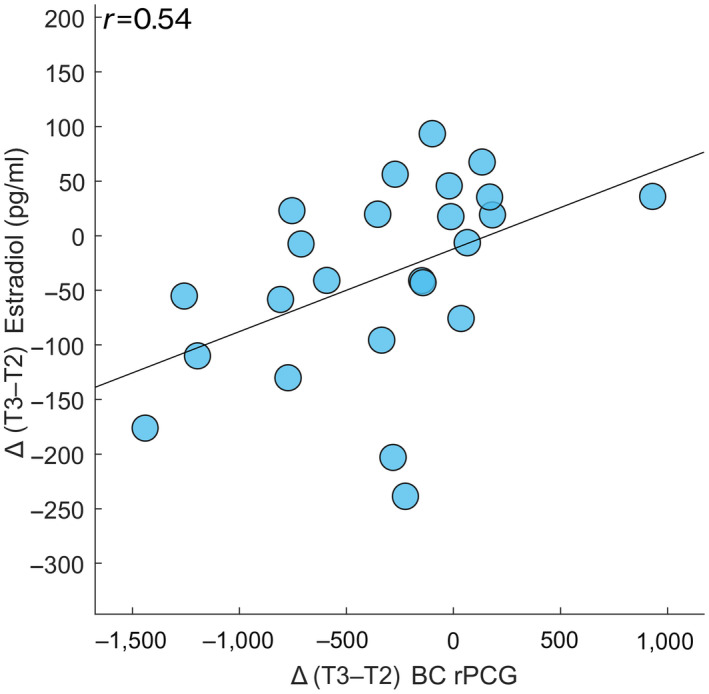
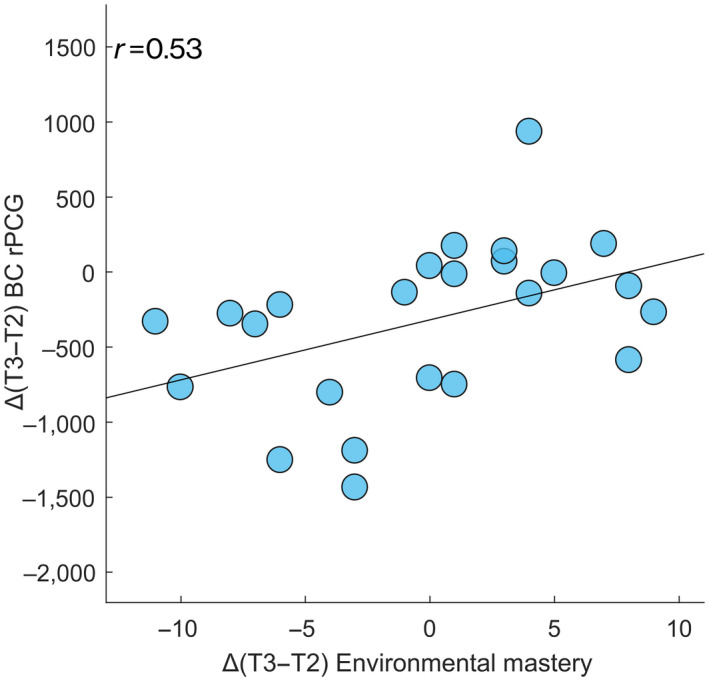
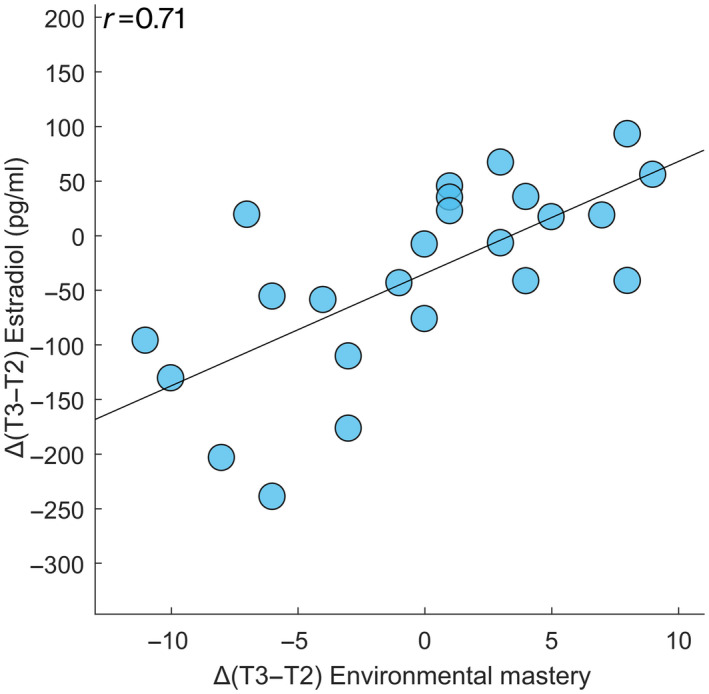
The menstrual cycle (MC) is a sex hormone-related phenomenon that repeats itself cyclically during the woman's reproductive life. In this explorative study, we hypothesized that coordinated variations of multiple sex hormones may affect the large-scale organization of the brain functional network and that, in turn, such changes might have psychological correlates, even in the absence of overt clinical signs of anxiety and/or depression. To test our hypothesis, we investigated longitudinally, across the MC, the relationship between the sex hormones and both brain network and psychological changes. We enrolled 24 naturally cycling women and, at the early-follicular, peri-ovulatory, and mid-luteal phases of the MC, we performed: (a) sex hormone dosage, (b) magnetoencephalography recording to study the brain network topology, and (c) psychological questionnaires to quantify anxiety, depression, self-esteem, and well-being. We showed that during the peri-ovulatory phase, in the alpha band, the leaf fraction and the tree hierarchy of the brain network were reduced, while the betweenness centrality (BC) of the right posterior cingulate gyrus (rPCG) was increased. Furthermore, the increase in BC was predicted by estradiol levels. Moreover, during the luteal phase, the variation of estradiol correlated positively with the variations of both the topological change and environmental mastery dimension of the well-being test, which, in turn, was related to the increase in the BC of rPCG. Our results highlight the effects of sex hormones on the large-scale brain network organization as well as on their possible relationship with the psychological state across the MC. Moreover, the fact that physiological changes in the brain topology occur throughout the MC has widespread implications for neuroimaging studies.
Keywords: behavior; emotional stimuli; magnetoencephalography; posterior cingulate gyrus; premenstrual dysphoric disorder; sex hormones.
© 2021 The Authors. Journal of Neuroscience Research published by Wiley Periodicals LLC.
Conflict of interest statement
The authors declare that there is no conflict of interest regarding the publication of this paper.
Figures
Similar articles
-
Brain flexibility increases during the peri-ovulatory phase as compared to early follicular phase of the menstrual cycle.Sci Rep. 2024 Jan 23;14(1):1976. doi: 10.1038/s41598-023-49588-y. Sci Rep. 2024. PMID: 38263324 Free PMC article.
-
Trait-related changes in brain network topology in premenstrual dysphoric disorder.Horm Behav. 2020 Aug;124:104782. doi: 10.1016/j.yhbeh.2020.104782. Epub 2020 Jun 17. Horm Behav. 2020. PMID: 32470339
-
Sex differences during emotion processing are dependent on the menstrual cycle phase.Psychoneuroendocrinology. 2019 Feb;100:85-95. doi: 10.1016/j.psyneuen.2018.09.032. Epub 2018 Oct 5. Psychoneuroendocrinology. 2019. PMID: 30296706
-
The Menstrual Cycle Influences Emotion but Has Limited Effect on Cognitive Function.Vitam Horm. 2018;107:349-376. doi: 10.1016/bs.vh.2018.01.016. Epub 2018 Feb 19. Vitam Horm. 2018. PMID: 29544637 Review.
-
Neuroimaging the Menstrual Cycle and Premenstrual Dysphoric Disorder.Curr Psychiatry Rep. 2015 Oct;17(10):77. doi: 10.1007/s11920-015-0619-4. Curr Psychiatry Rep. 2015. PMID: 26272540 Review.
Cited by
-
Fading of brain network fingerprint in Parkinson's disease predicts motor clinical impairment.Hum Brain Mapp. 2023 Feb 15;44(3):1239-1250. doi: 10.1002/hbm.26156. Epub 2022 Nov 22. Hum Brain Mapp. 2023. PMID: 36413043 Free PMC article.
-
Brain flexibility increases during the peri-ovulatory phase as compared to early follicular phase of the menstrual cycle.Sci Rep. 2024 Jan 23;14(1):1976. doi: 10.1038/s41598-023-49588-y. Sci Rep. 2024. PMID: 38263324 Free PMC article.
-
High-amplitude network co-fluctuations linked to variation in hormone concentrations over the menstrual cycle.Netw Neurosci. 2023 Oct 1;7(3):1181-1205. doi: 10.1162/netn_a_00307. eCollection 2023. Netw Neurosci. 2023. PMID: 37781152 Free PMC article.
-
The kinectome: A comprehensive kinematic map of human motion in health and disease.Ann N Y Acad Sci. 2022 Oct;1516(1):247-261. doi: 10.1111/nyas.14860. Epub 2022 Jul 15. Ann N Y Acad Sci. 2022. PMID: 35838306 Free PMC article.
-
Analyzing Information Exchange in Parkinson's Disease via Eigenvector Centrality: A Source-Level Magnetoencephalography Study.J Clin Med. 2025 Feb 5;14(3):1020. doi: 10.3390/jcm14031020. J Clin Med. 2025. PMID: 39941689 Free PMC article.
References
-
- Baker, C. M., Burks, J. D., Briggs, R. G., Conner, A. K., Glenn, C. A., Manohar, K., Milton, C. K., Sali, G., McCoy, T. M., Battiste, J. D., O’Donoghue, D. L., & Sughrue, M. E. (2018). A connectomic atlas of the human cerebrum—Chapter 8: The posterior cingulate cortex, medial parietal lobe, and parieto‐occipital sulcus. Operative Neurosurgery, 15(Suppl. 1), S350–S371. - PMC - PubMed
MeSH terms
Substances
LinkOut - more resources
Full Text Sources
