. 2021 Jun 10;95(13):e0026621.
doi: 10.1128/JVI.00266-21. Epub 2021 Jun 10.

SARS-CoV-2 Nonstructural Protein 1 Inhibits the Interferon Response by Causing Depletion of Key Host Signaling Factors

Affiliations

SARS-CoV-2 Nonstructural Protein 1 Inhibits the Interferon Response by Causing Depletion of Key Host Signaling Factors

Anil Kumar et al. J Virol. .

Abstract

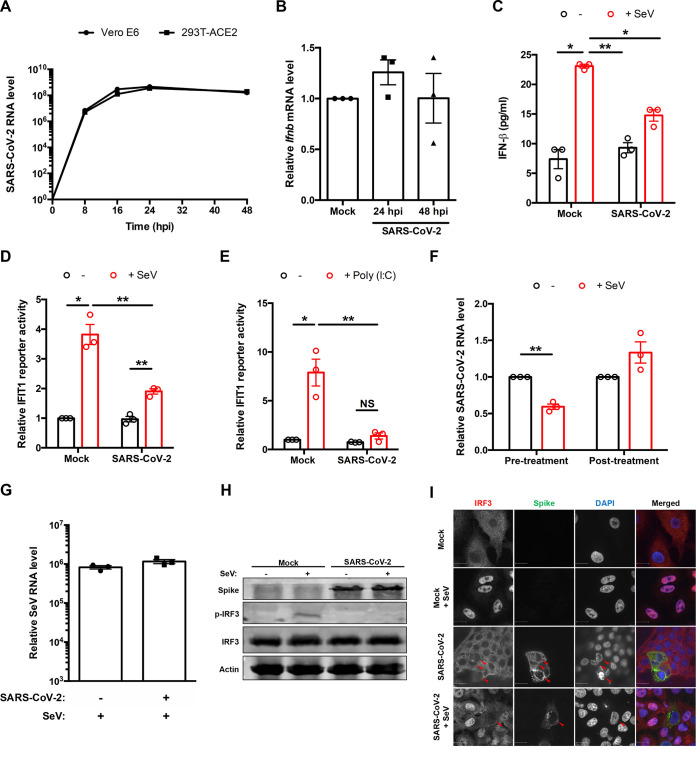
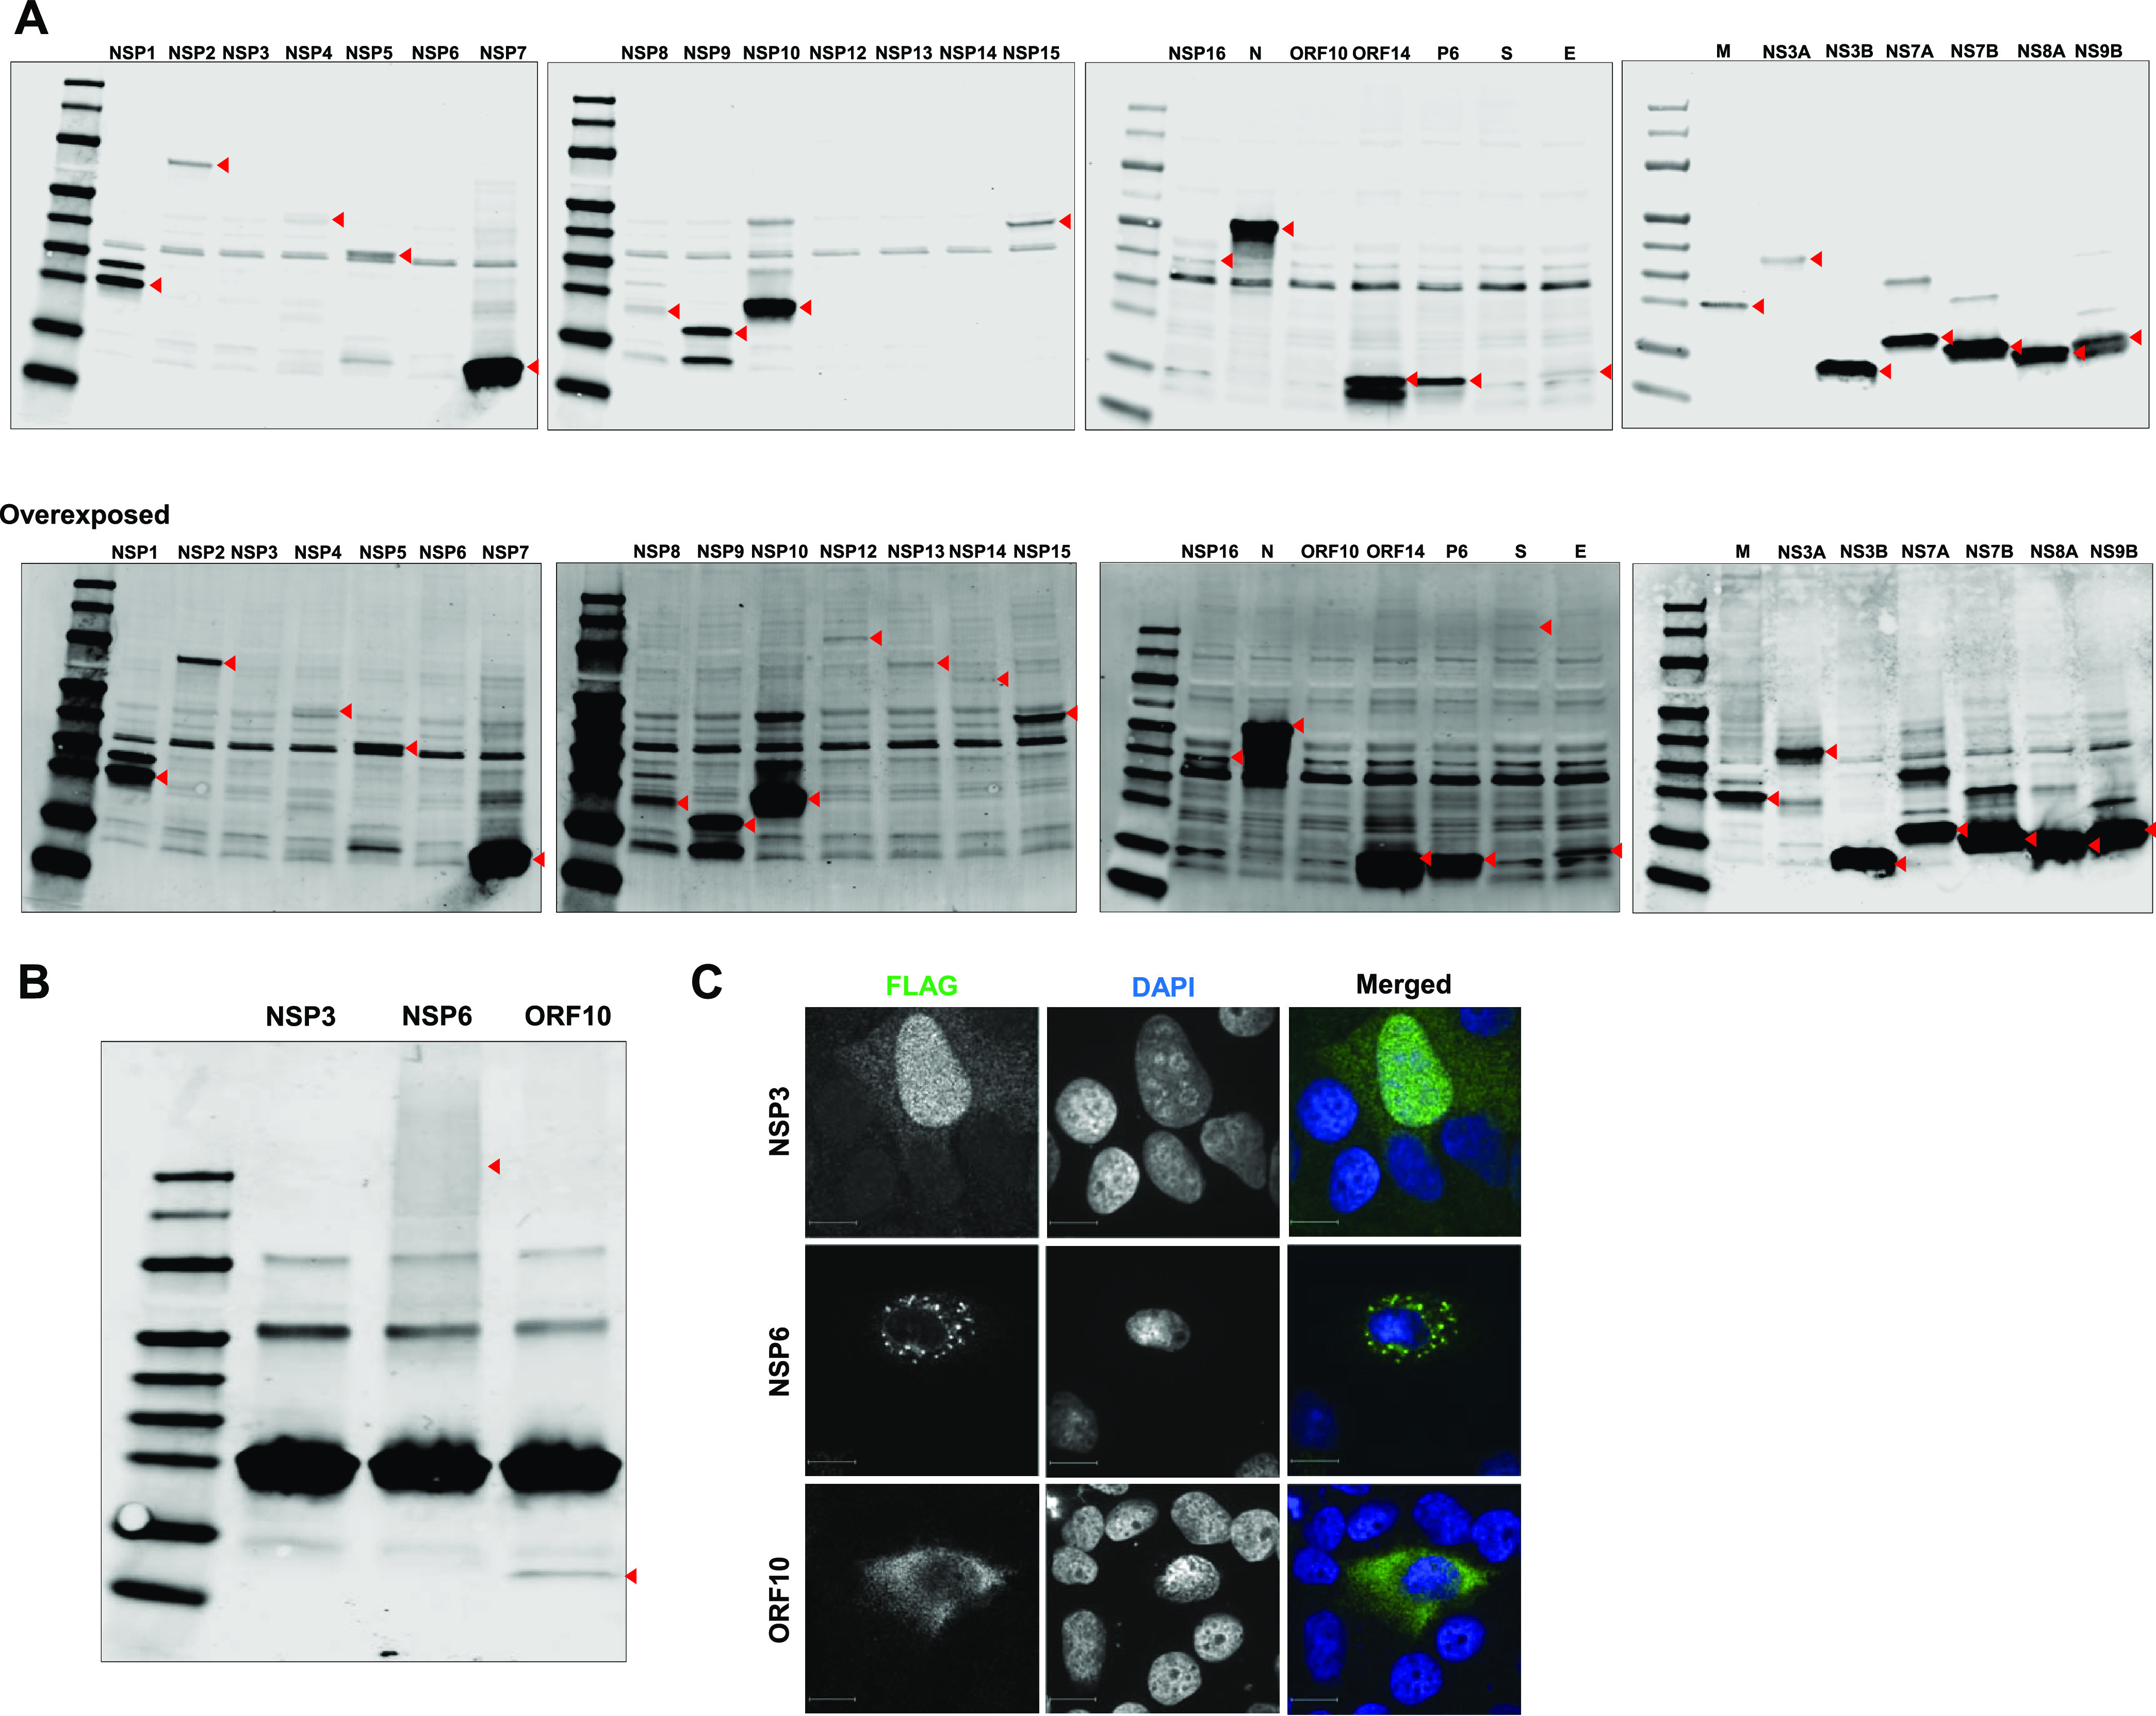
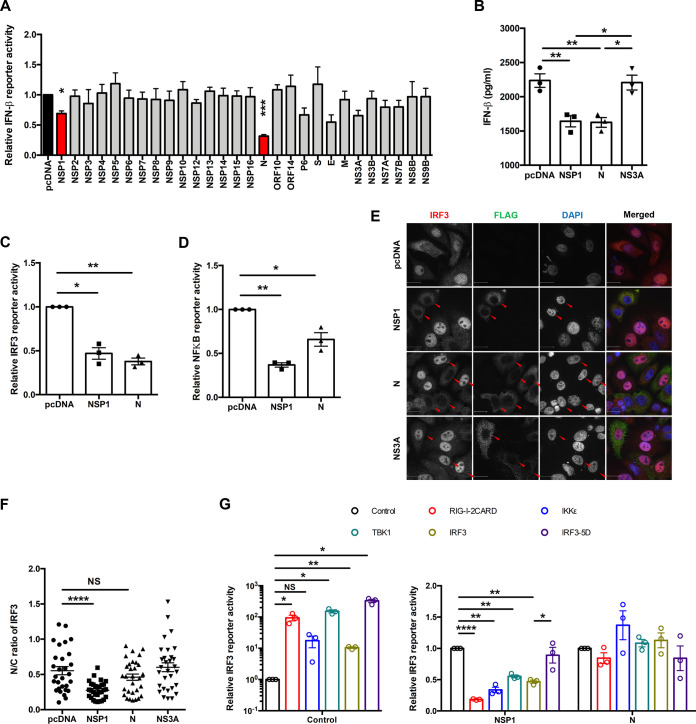
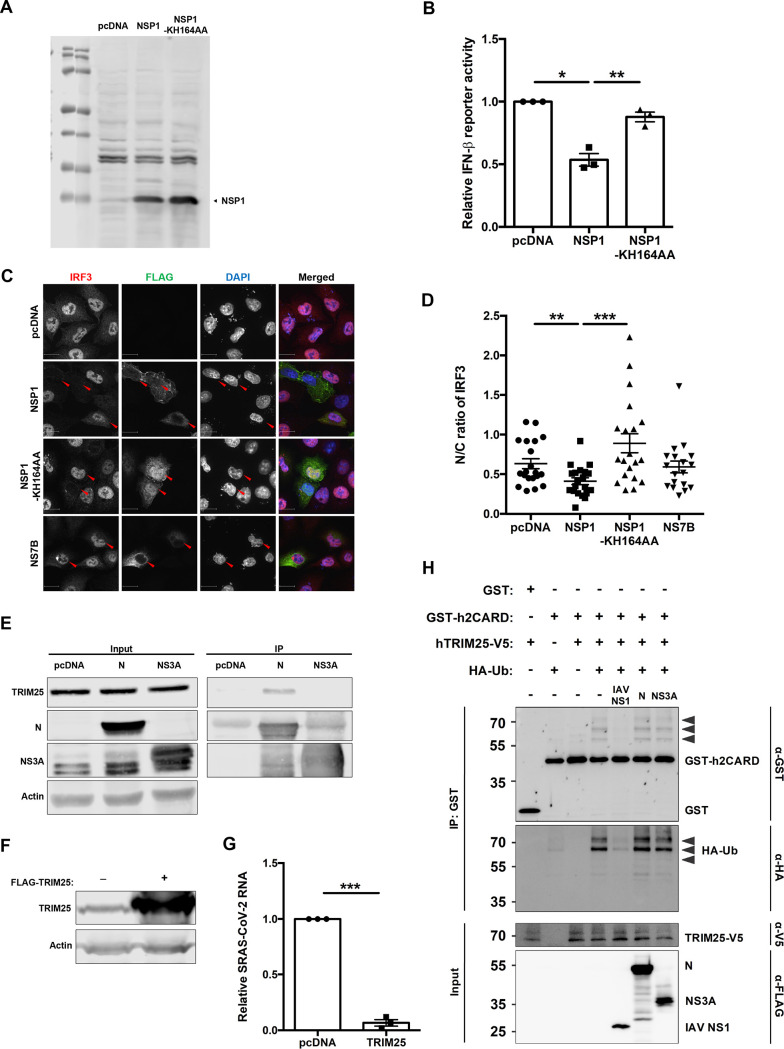
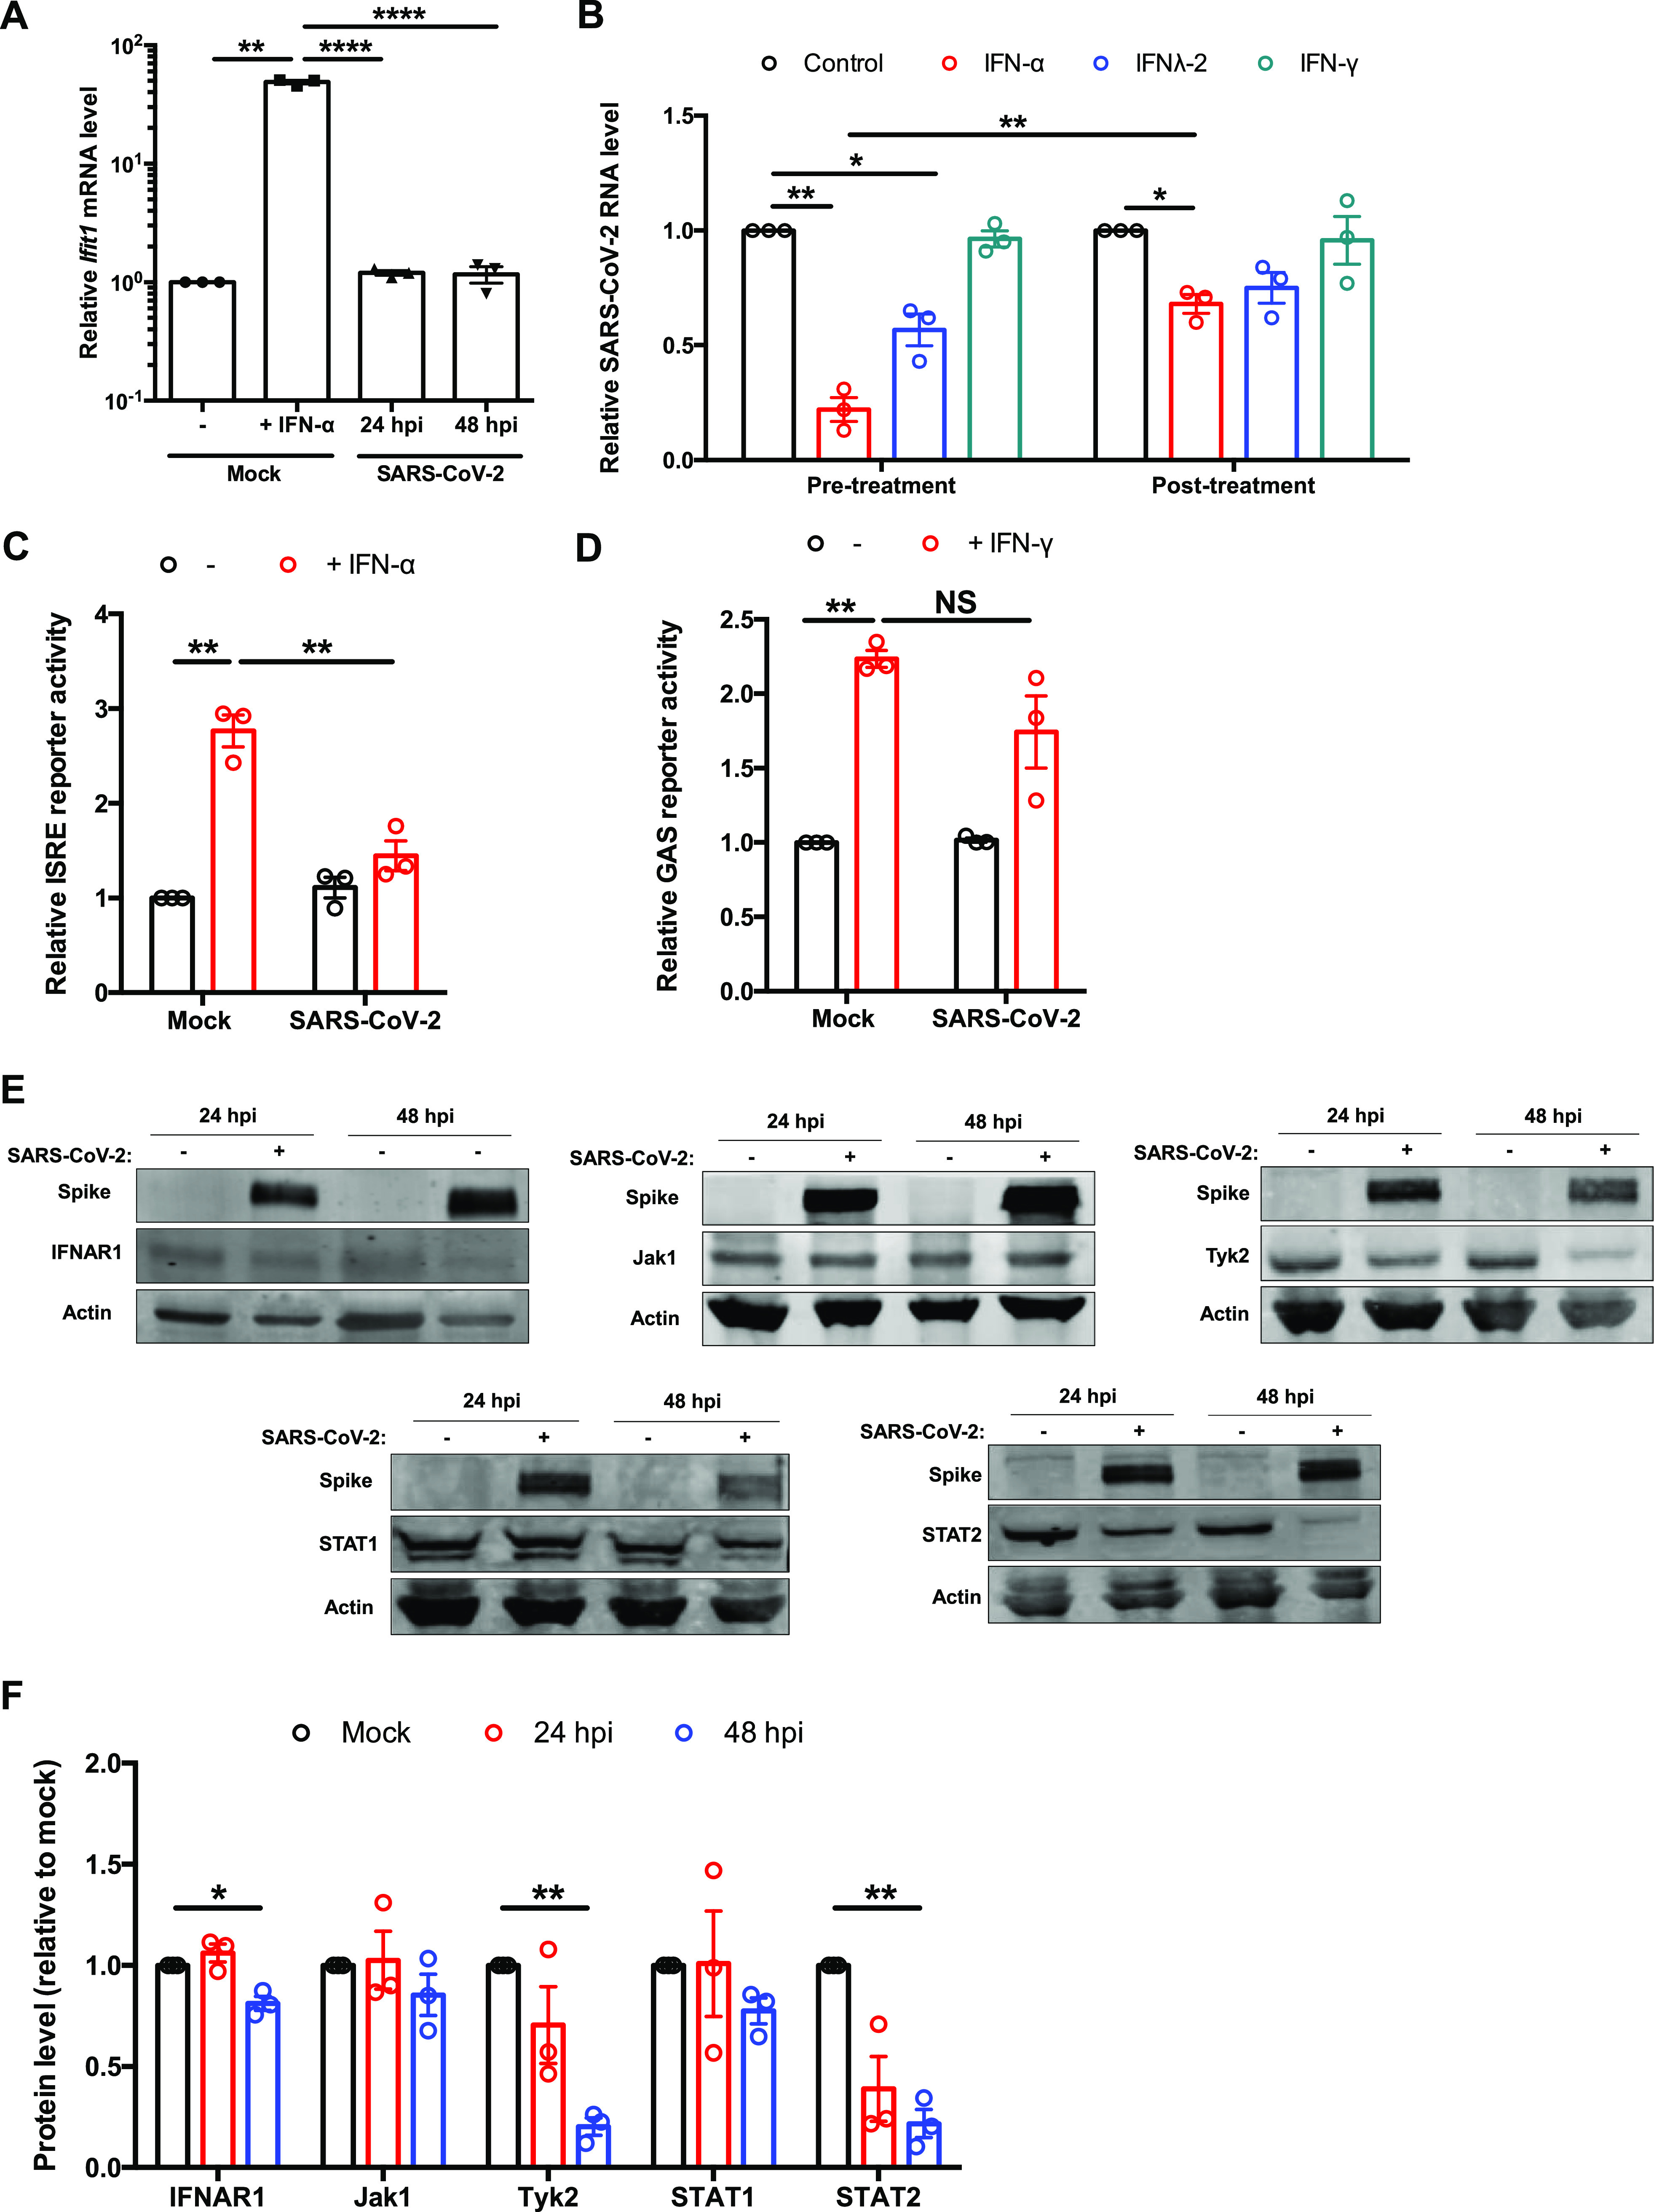
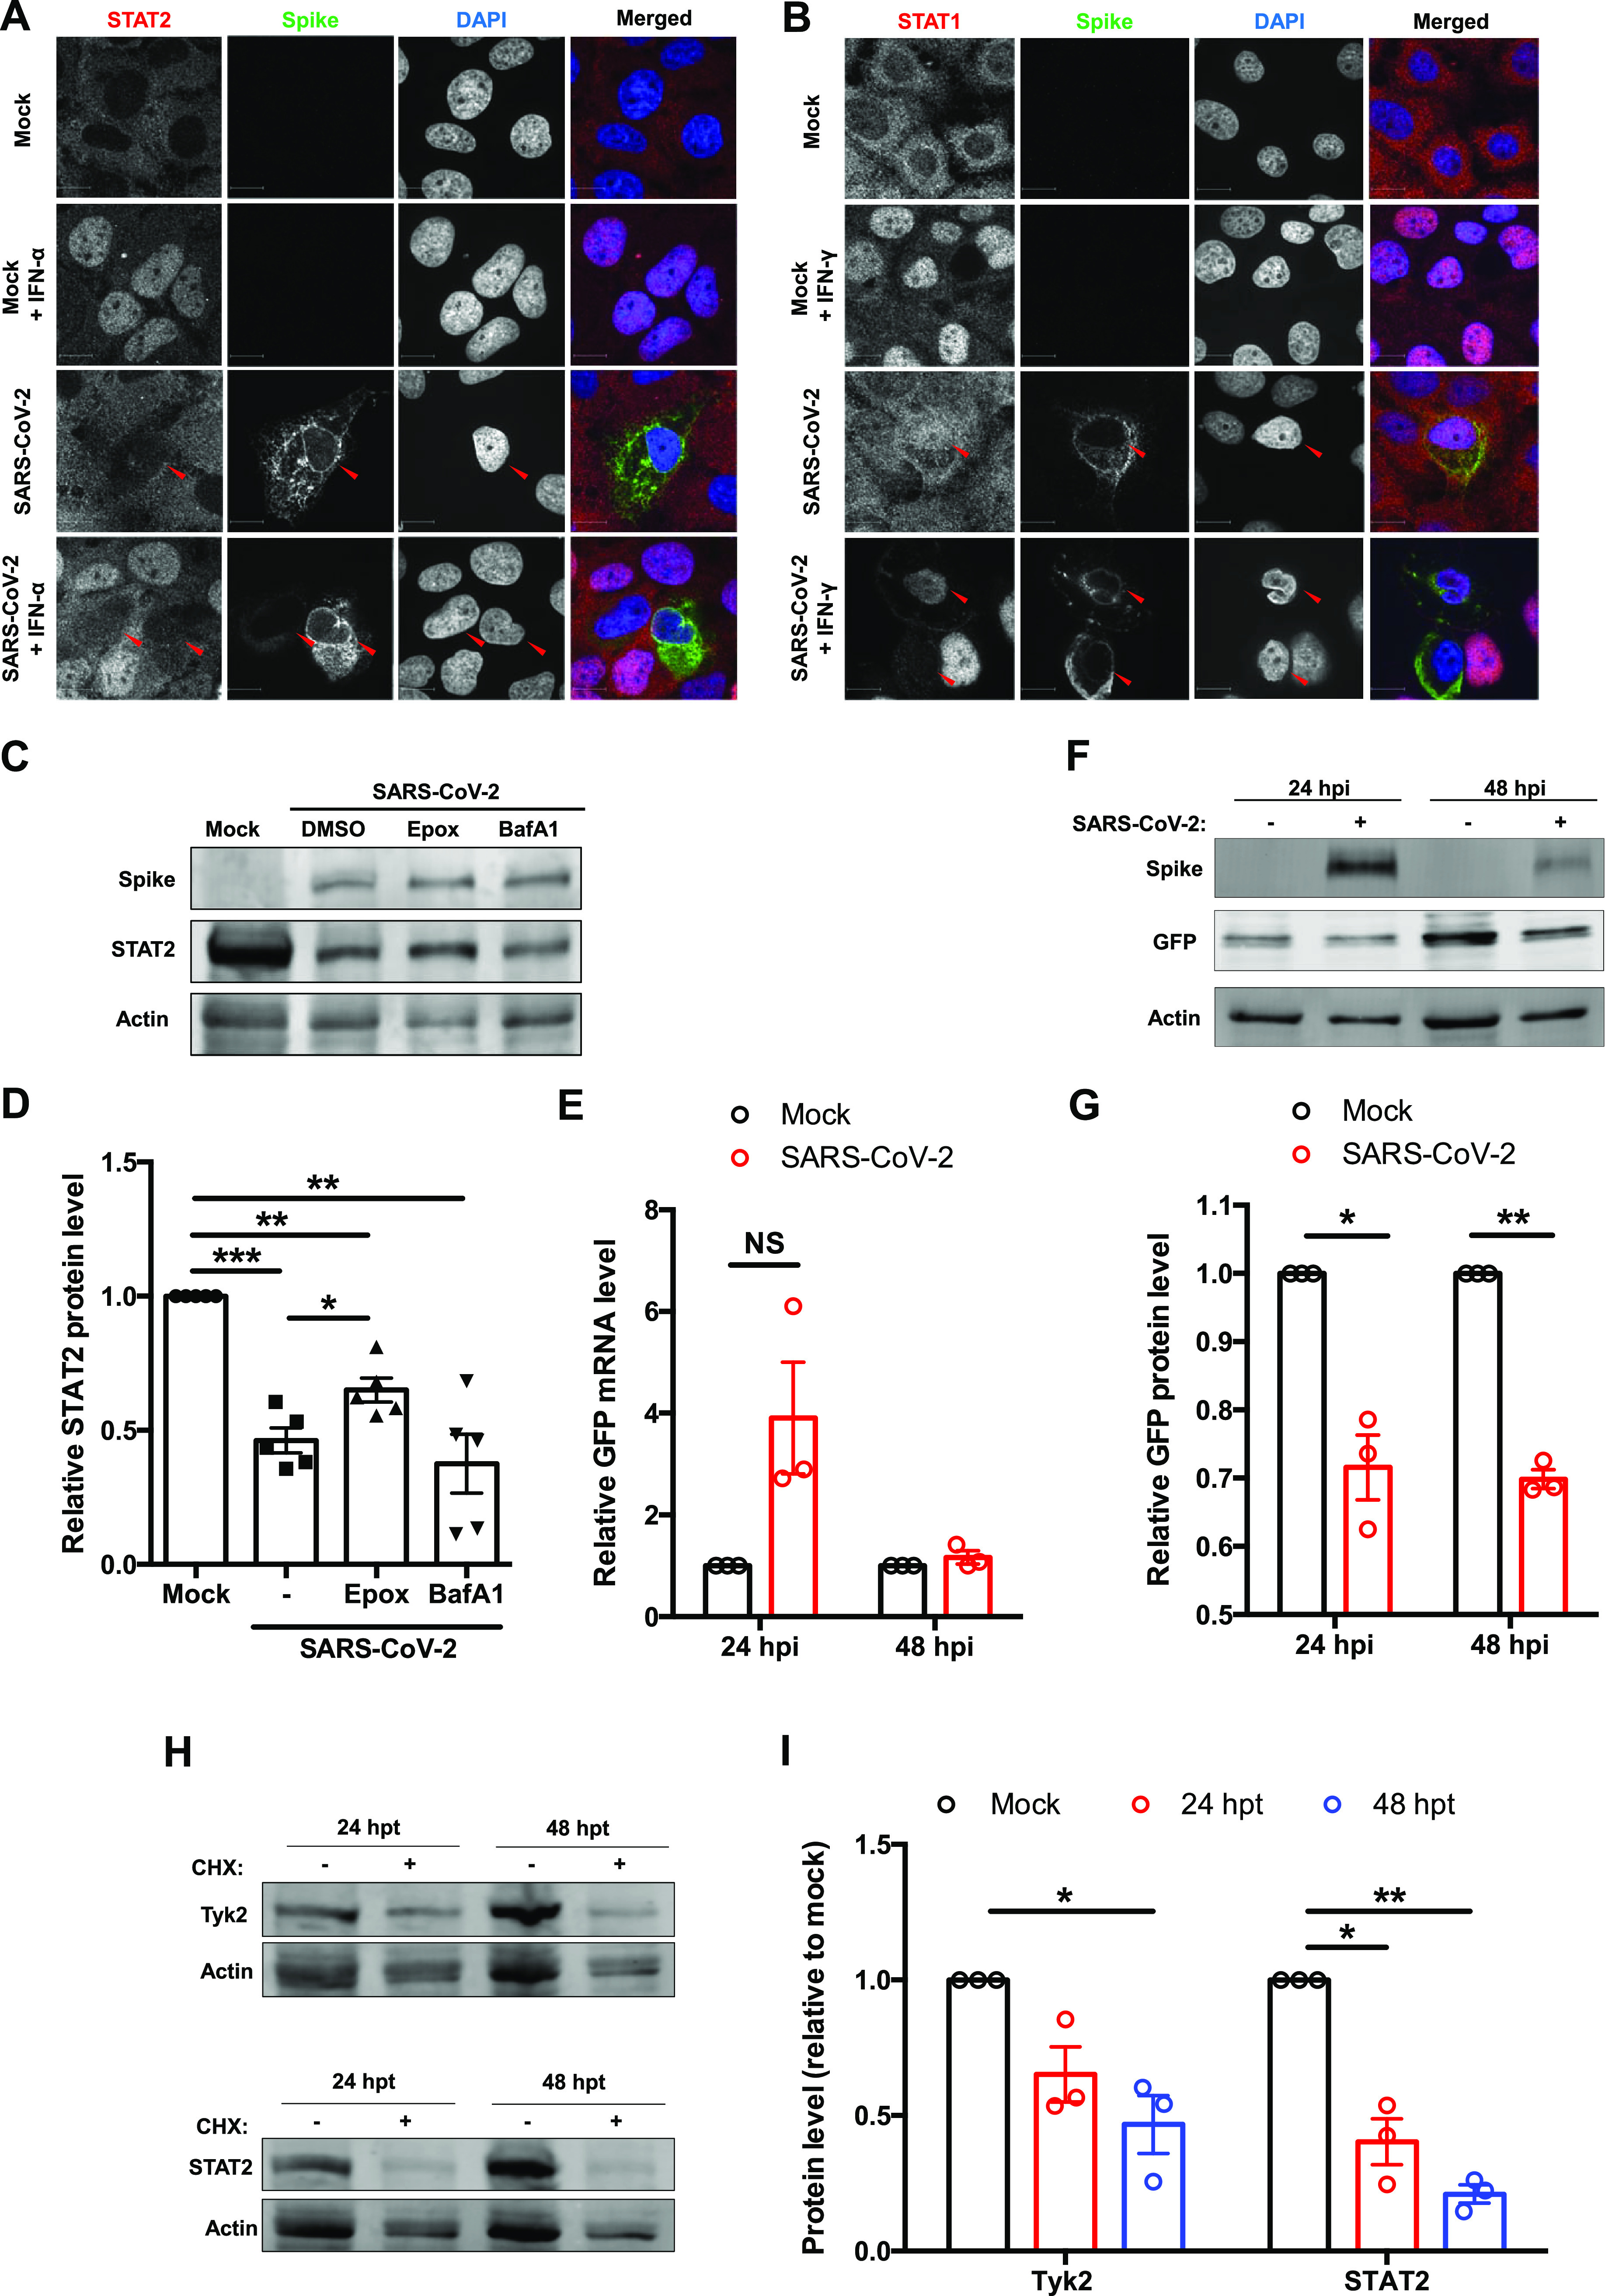
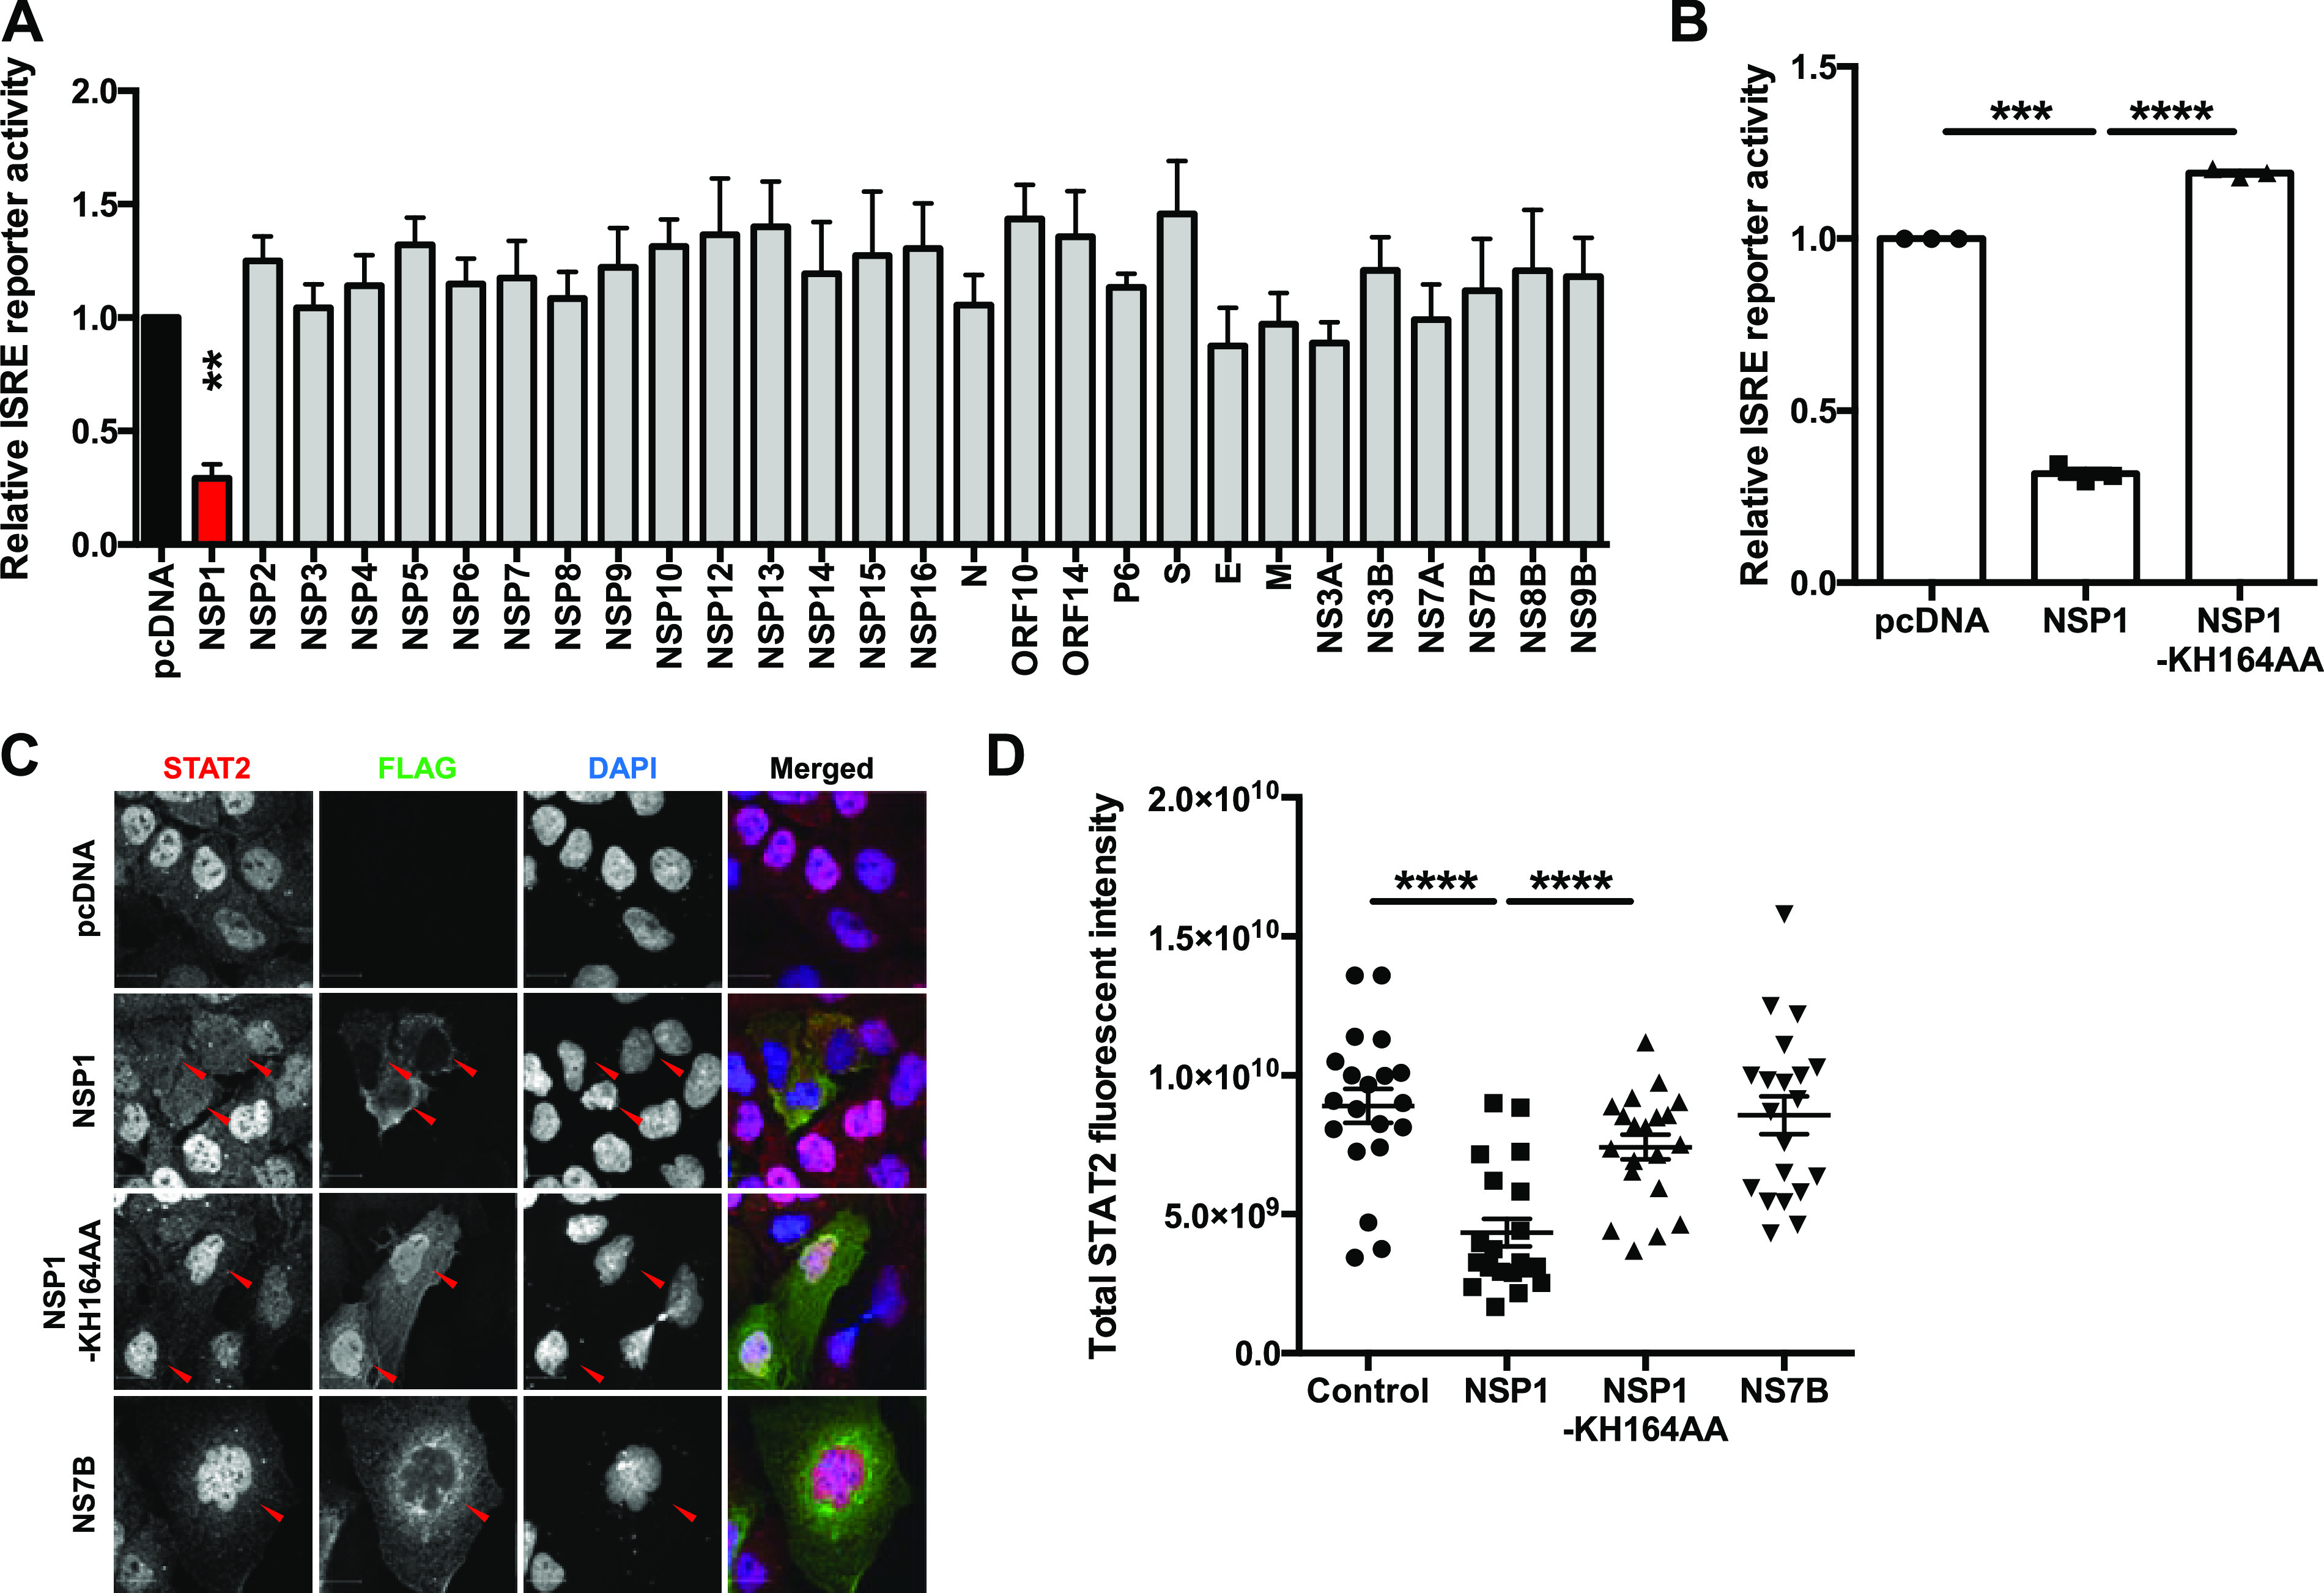
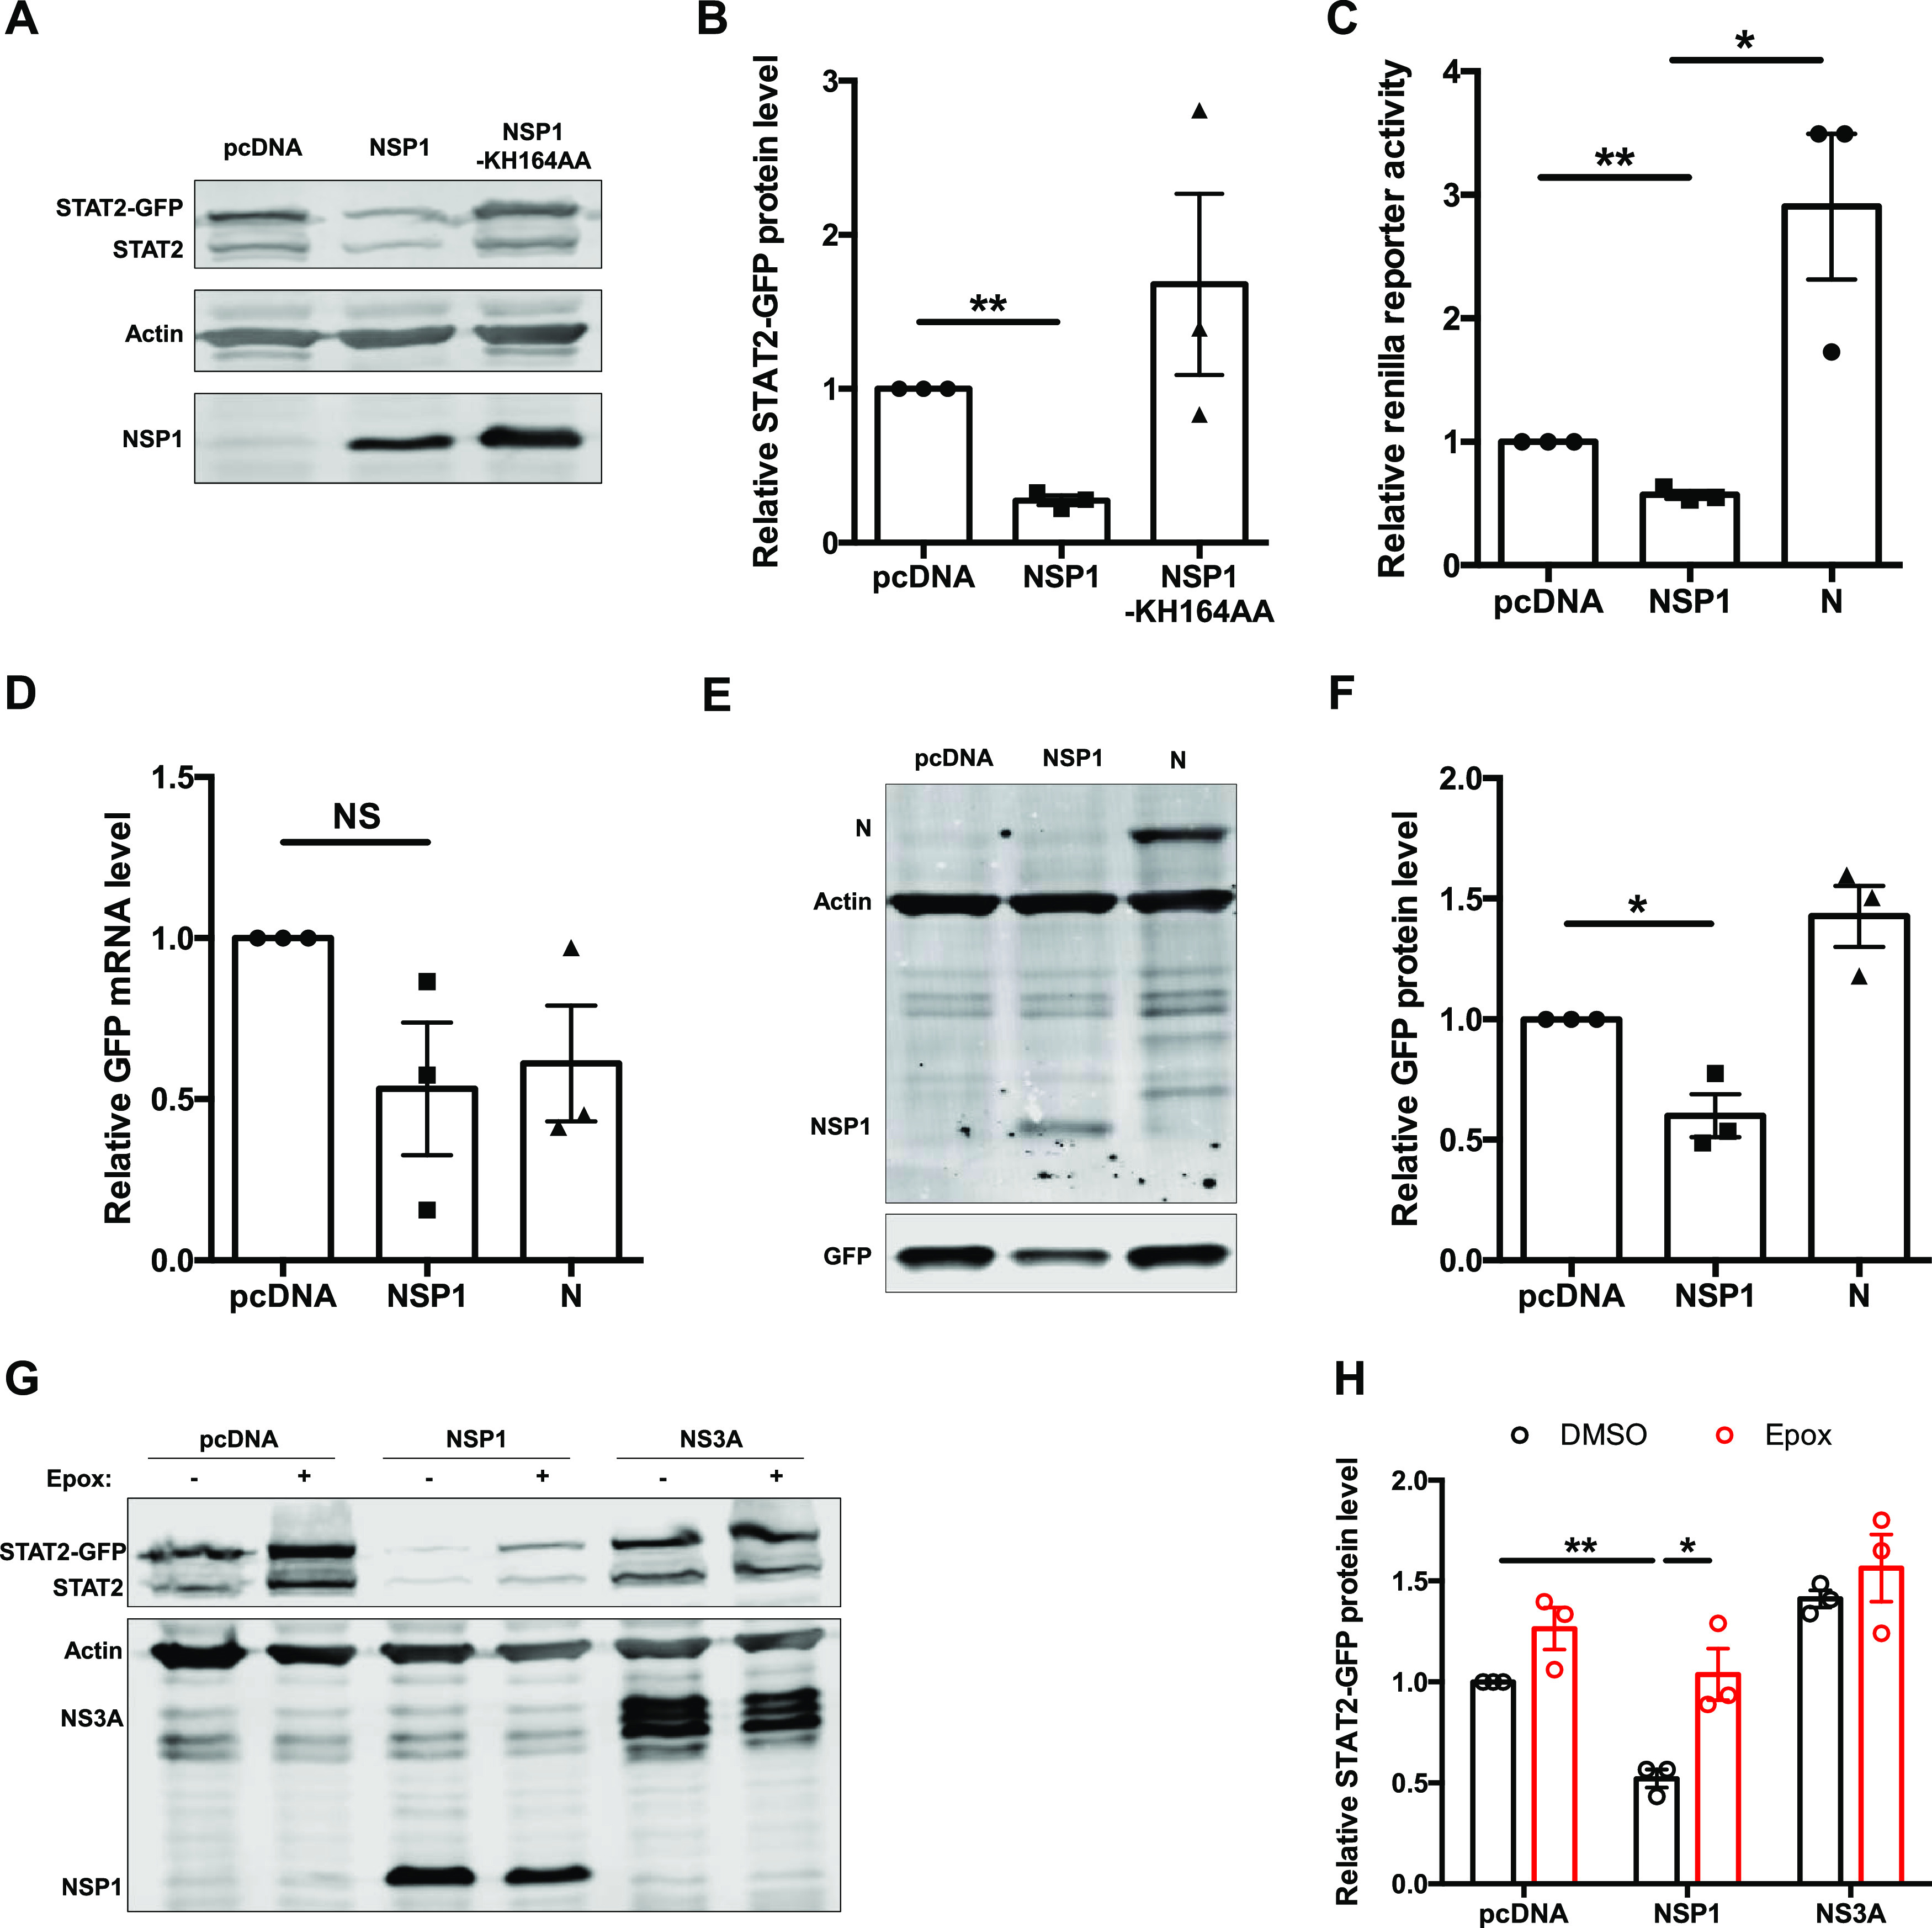
Severe acute respiratory syndrome coronavirus 2 (SARS-CoV-2) is the causative agent of the ongoing coronavirus disease 2019 (COVID-19) pandemic. While previous studies have shown that several SARS-CoV-2 proteins can antagonize the interferon (IFN) response, some of the mechanisms by which they do so are not well understood. In this study, we describe two novel mechanisms by which SARS-CoV-2 blocks the IFN pathway. Type I IFNs and IFN-stimulated genes (ISGs) were poorly induced during SARS-CoV-2 infection, and once infection was established, cells were highly resistant to ectopic induction of IFNs and ISGs. Levels of two key IFN signaling pathway components, Tyk2 and STAT2, were significantly lower in SARS-CoV-2-infected cells. Expression of nonstructural protein 1 (NSP1) or nucleocapsid in the absence of other viral proteins was sufficient to block IFN induction, but only NSP1 was able to inhibit IFN signaling. Mapping studies suggest that NSP1 prevents IFN induction in part by blocking IRF3 phosphorylation. In addition, NSP1-induced depletion of Tyk2 and STAT2 dampened ISG induction. Together, our data provide new insights into how SARS-CoV-2 successfully evades the IFN system to establish infection. IMPORTANCE SARS-CoV-2 is the causative agent of COVID-19, a serious disease that can have a myriad of symptoms from loss of taste and smell to pneumonia and hypercoagulation. The rapid spread of SARS-CoV-2 can be attributed in part to asymptomatic transmission, where infected individuals shed large amounts of virus before the onset of disease. This is likely due to the ability of SARS-CoV-2 to effectively suppress the innate immune system, including the IFN response. Indeed, we show that the IFN response is efficiently blocked during SARS-CoV-2 infection, a process that is mediated in large part by nonstructural protein 1 and nucleocapsid. Our study provides new insights on how SARS-CoV-2 evades the IFN response to successfully establish infection. These findings should be considered for the development and administration of therapeutics against SARS-CoV-2.

Keywords: NSP1; SARS-CoV-2; innate immunity; type I interferons.


Figures

FIG 1
FIG 1
SARS-CoV-2 blocks IFN induction. (A) Vero E6 and HEK 293T-ACE2 cells were infected with SARS-CoV-2 (multiplicity of infection [MOI] = 1), and total RNA was harvested at 0, 8, 16, 24, and 48 h postinfection (hpi). Viral RNA level was measured by qRT-PCR, normalized to the ACTB mRNA level, and expressed as fold values relative to mock-infected cells. (B) HEK 293T-ACE2 cells were infected with SARS-CoV-2 (MOI = 1), and total RNA was harvested at 24 and 48 hpi. Ifnb level was measured by qRT-PCR, normalized to ACTB mRNA level, and expressed as fold values relative to mock-infected cells. (C) Mock- or SARS-CoV-2-infected (30 hpi) HEK 293T-ACE2 cells were challenged with 50 hemagglutination units (HAU)/ml Sendai virus (SeV) for 16 h. IFN-β in cell culture supernatants was measured by ELISA. (D and E) HEK 293T-ACE2 cells were infected with SARS-CoV-2 (MOI = 1). After 24 h, the cells were transfected with IFIT1 firefly luciferase reporter and control Renilla reporter plasmids and then challenged with 100 HAU/ml of SeV (D) or 2 μg/ml of poly(I·C) (E) for 16 h. Firefly and Renilla luciferase activities were measured in cell lysates, after which the IFIT1 reporter luciferase activity was normalized against Renilla reporter values and further normalized to the activity in uninduced mock-infected cells. (F) HEK 293T-ACE2 cells infected with SeV (50 HAU/ml) for 8 h preinfection (pretreatment) or 16 h postinfection (posttreatment) were subsequently infected with SARS-CoV-2 (MOI = 1). Total RNA was harvested 48 hpi. SARS-CoV-2 genomic RNA was measured by qRT-PCR, normalized to ACTB mRNA level, and expressed as fold values relative to mock-infected cells. (G) HEK 293T cells were infected with SARS-CoV-2 (MOI = 1). After 24 h, cells were infected with SeV (50 HAU/ml) for 16 h, after which total RNA was harvested. SeV genomic RNA was measured by qRT-PCR, normalized to ACTB mRNA level, and expressed as fold value relative to mock-infected cells. (H) HEK 293T-ACE2 cells were infected with SARS-CoV-2 (MOI = 1) for 16 h and then mock infected or infected with 50 HAU/ml of SeV for 8 h. Cell lysates were subjected to immunoblotting using antibodies against spike, IRF3, phospho-IRF3, and β-actin. (I) A549 cells were electroporated with plasmid encoding ACE2 and then infected with SARS-CoV-2 (MOI = 1) for 16 h, followed by challenge with 50 HAU/ml of SeV for 8 h. Cells were fixed, and spike and IRF3 localization was determined by indirect-immunofluorescence analysis. Data are means ± SEM from three independent experiments. *, P < 0.05; **, P < 0.01.
FIG 2
FIG 2
Expression of SARS-CoV-2 proteins. (A) Huh7 cells were transfected with plasmids encoding the indicated viral proteins with 3× FLAG tags. After 24 h, cell lysates were subjected to immunoblotting with antibodies against FLAG. The positions of the FLAG-tagged viral proteins are indicated with red arrowheads. (B) HEK 293T cells were transfected with plasmids encoding FLAG-tagged SARS-CoV-2 NSP3, NSP6, and ORF10, for which protein expression was not confirmed by Western blotting. Cells were harvested 24 h posttransfection, immunoprecipitated with anti-FLAG antibody, and subjected to Western blot analysis with immunostaining with antibody against FLAG. (C) Huh7 cells were transfected with NSP3, NSP6, and ORF10 for 48 h, fixed, and imaged by IF microscopy after staining using antibody against FLAG.
FIG 3
FIG 3
SARS-CoV-2 NSP1 and N block IFN induction. (A) HEK 293T cells were transfected with plasmids encoding the indicated viral proteins, IFN-β firefly luciferase reporter and control Renilla reporter. Twenty-four hours later cells were infected with 100 HAU/ml of SeV for 16 h, after which firefly and Renilla luciferase activities were measured in cell lysates. IFN-β reporter activity was normalized against Renilla reporter values, and the data are presented as fold activity relative to a pcDNA empty vector control. (B) HEK 293T cells were transfected with plasmids encoding NSP1, NS3A, or N and 24 h later challenged with 100 HAU/ml of Sendai virus for 16 h. The culture supernatants were harvested, and IFN-β levels were determined by ELISA. (C and D) HEK 293T cells were transfected with plasmids encoding NSP1 or N proteins and firefly luciferase under the control of IRF3 (C)- or NF-κB (D)-responsive promoters as well as a constitutively expressed Renilla luciferase reporter. Twenty-four hours later, cells were challenged with 100 HAU/ml of SeV for 16 h, after which firefly and Renilla luciferase activities were measured in cell lysates. The firefly luciferase activity was normalized against Renilla luciferase values, and the data are presented as fold activity relative to a pcDNA empty vector control. (E and F) A549 cells were transfected with plasmids encoding NSP1, N, or NS3A and 24 h later challenged with 100 HAU/ml of SeV for 8 h. The cells were then processed for indirect immunofluorescence using antibodies against FLAG and IRF3. The cytoplasmic and nuclear IRF3 signal were quantitated using Volocity software (n = 30). (G) HEK 293T cells were transfected with plasmids encoding NSP1 or N and RIG-I, IKKε, TBK1, IRF3, or IRF3-5D, IRF3-promoter firefly luciferase reporter, and constitutively expressed Renilla luciferase reporter. Samples were harvested at 24 h posttransfection, after which firefly and Renilla luciferase activities were measured in cell lysates. The firefly luciferase activity was normalized against Renilla luciferase values, and the data are presented as fold activity relative to a pcDNA empty vector control. Data are means ± SEM from three independent experiments. *, P < 0.05; **, P < 0.01; ***, P < 0.001; ****, P < 0.0001.
FIG 4
FIG 4
Translational shut off by NSP1 and TRIM25-independent mechanism by N blocks IFN induction. (A) HEK 293T cells were transfected with wither empty vector (pcDNA) and plasmids encoding wild-type NSP1 or mutant NSP1-KH164AA for 24 h. Cell lysates were then subjected to immunoblotting with antibodies against FLAG. (B) HEK 293T cells were transfected with empty vector (pcDNA) or plasmids encoding wild-type NSP1 or mutant NSP1-KH164AA, IFN-β-responsive firefly luciferase reporter, and control Renilla reporter. After 24 h, the cells were challenged with 100 HAU/ml of SeV for 16 h and then harvested for luciferase assays. The firefly reporter activities were normalized against Renilla reporter values, and the data are presented as fold activity relative to uninduced pcDNA empty vector control. (C and D) A549 cells were transfected with plasmid encoding wild-type NSP1, mutant (KH164AA) NSP1, or NS7B (negative control) for 24 h, after which cells were challenged with 100 HAU/ml of SeV for 8 h. Samples were then processed for indirect immunofluorescence microscopy using antibodies against FLAG and IRF3. The fluorescent intensities in the nucleus and cytoplasm were measured using Volocity software (n = 20). (E) HEK 293T cells were transfected with plasmids encoding SARS-CoV-2 N or NS3A proteins or empty vector (pcDNA). After 48 h, cell lysates were immunoprecipitated with anti-FLAG antibody and then subjected immunoblot analysis using antibodies against FLAG, TRIM25, and β-actin. (F) HEK 293T cells were transfected with a plasmid encoding FLAG-TRIM25 or empty vector (pcDNA) for 48 h, after which cell lysates were subjected to immunoblot analysis using antibodies against TRIM25 and β-actin. (G) HEK 293T-ACE2 cells were transfected with a plasmid encoding FLAG-tagged TRIM25 or empty vector (pcDNA) for 48 h. Cells were then infected with SARS-CoV-2 (MOI = 1) for 48 h, after which total RNA was harvested and subjected to qRT-PCR to quantify viral genomic RNA, which was normalized to ACTB mRNA level and expressed as fold values relative to pcDNA empty vector-transfected cells. (H) HEK 293T cells were transfected with plasmids encoding GST-tagged human RIG-I CARD domains (GST-h2CARD) or GST alone, together with HA-tagged ubiquitin (HA-Ub), V5-tagged human TRIM25 (hTRIM25-V5), and the indicated FLAG-tagged viral proteins. Clarified whole-cell lysates were subjected to GST pulldown (IP: GST), followed by immunoblot analysis with anti-GST, anti-HA, anti-V5, and anti-FLAG antibodies. Influenza A virus (IAV) NS1 served as a positive control for blocking TRIM25-mediated ubiquitination of the RIG-I CARD domains. Data are means ± SEM from three independent experiments. *, P < 0.05; **, P < 0.01; ***, P < 0.001.
FIG 5
FIG 5
SARS-CoV-2 blocks ISG induction. (A) HEK 293T-ACE2 cells were infected with SARS-CoV-2 (MOI = 2), and total RNA was harvested at 24 and 48 hpi. Mock-infected cells were treated with IFN-α (100 U/ml) for 16 h as a control. Ifit1 level was measured by qRT-PCR and normalized to the ACTB mRNA level. (B) HEK 293T-ACE2 cells were treated with IFN-α (100 U/ml), IFN-λ (100 ng/ml), or IFN-γ (10 U/ml) for 6 h preinfection (pretreatment) or 16 hpi (posttreatment) of SARS-CoV-2 (MOI = 1). Total RNA was harvested 48 hpi, and viral genomic RNA was measured by qRT-PCR. All values are expressed as fold values relative to mock-infected samples. (C) HEK 293T-ACE2 cells were infected with SARS-CoV-2 (MOI = 1), transfected 24 h later with ISRE firefly luciferase reporter and control Renilla reporter plasmids, and then induced with 100 U/ml of IFN-α for 16 h. The samples were harvested and processed by luciferase assay. The ISRE reporter activity was normalized against Renilla reporter values, which were further normalized to values for the uninduced mock-infected cells. (D) HEK 293T-ACE2 cells were infected with SARS-CoV-2 (MOI = 1), transfected 24 h later with IFN-γ-responsive (GAS) firefly luciferase reporter and control Renilla reporter, and induced with 10 U/ml of IFN-γ. After 16 h, luciferase activities were measured, and GAS-dependent luciferase activities were normalized against Renilla reporter values; the data are presented as fold activity relative to mock samples. (E and F) HEK 293T-ACE2 cells were infected with SARS-CoV-2 (MOI = 1), and cell lysates collected 24 and 48 hpi were subjected to immunoblotting using antibodies against spike, IFNAR1, Jak1, Tyk2, STAT1, STAT2, and β-actin. The intensities of the protein bands were measured using Image Studio software, normalized to β-actin level, and expressed as fold values relative to mock-infected controls. Data are means ± SEM from three independent experiments. *, P < 0.05; **, P < 0.01; ***, P < 0.001; ****, P < 0.0001; NS, not significant.
FIG 6
FIG 6
Host cell protein expression during SARS-CoV-2 infection. (A and B) Huh7 cells were infected with SARS-CoV-2 (MOI = 0.5) and at 46 hpi treated with IFN-α (100 U/ml) for 2 h. Cells were then processed for indirect immunofluorescence using antibodies against spike and STAT2 (A) or STAT1 (B). (C and D) HEK 293T-ACE2 cells were infected with SARS-CoV-2 (MOI = 2) and at 16 hpi treated with either dimethyl sulfoxide (DMSO), 100 μM epoxomicin, or bafilomycin A1 for 36 h. Cell lysates were subjected to immunoblotting using antibodies against spike, STAT2, and β-actin. The intensities of the protein bands were measured using Image Studio software, normalized to β-actin level, and expressed as fold values relative to uninfected controls (n = 5). (E to G) HEK 293T-ACE2 cells were transduced with a lentivirus encoding AcGFP for 4 h and then infected with SARS-CoV-2 (MOI = 1). Total RNA and proteins were extracted at 24 and 48 hpi, and relative GFP transcript (normalized to ACTB mRNA) and protein (normalized to β-actin) levels were determined by qRT-PCR and immunoblotting, respectively. (H and I) HEK 293T cells were treated with 100 μM cycloheximide for 24 or 48 h, after which cell lysates were subjected to immunoblotting using antibodies against STAT2, Tyk2, and β-actin. The intensities of the protein bands were measured using Image Studio software, normalized to β-actin levels, and expressed as fold values relative to uninfected control. Data are means ± SEM from three independent experiments. *, P < 0.05; **, P < 0.01; ***, P < 0.001; NS, not significant.
FIG 7
FIG 7
SARS-CoV-2 NSP1 blocks IFN signaling. (A) HEK 293T cells were transfected with plasmids encoding the indicated viral proteins, ISRE firefly luciferase reporter, and control Renilla luciferase reporter. Twenty-four hours later, cells were induced with 100 U/ml of IFN-α for 16 h. Firefly and Renilla reporter activity was measured by luciferase assay. The ISRE reporter activity was normalized against Renilla reporter values, and the data are presented as fold activity relative to the pcDNA empty vector control. (B) HEK 293T cells were transfected with pcDNA carrying the indicated proteins, ISRE firefly luciferase reporter, and control Renilla reporter. The cells were induced 24 h later with 100 U/ml of IFN-α for 16 h, and then firefly and Renilla luciferase activities were measured. The ISRE reporter activity was normalized against Renilla reporter values, and the data are presented as fold activity relative to the pcDNA empty vector control. (C and D) Huh7 cells were transfected with plasmids encoding the indicated SARS-CoV-2 proteins. Twenty-four hours later, cells were induced with 100 U/ml of IFN-α for 2 h and then processed for indirect immunofluorescence microscopy with antibodies against FLAG and STAT2. The total fluorescent intensity of STAT2 was measured using Volocity software (n = 20). Data are means ± SEM from three independent experiments. *, P < 0.05; **, P < 0.01; ***, P < 0.001; ****, P < 0.0001.
FIG 8
FIG 8
Host cell protein expression in SARS-CoV-2 NSP1-transfected cells. (A and B) HEK 293T cells were transfected with plasmids encoding wild-type or mutant (KH164AA) NSP1 proteins and STAT2-GFP for 24 h, after which lysates were subjected to immunoblotting with antibodies against FLAG, STAT2, and β-actin. The intensities of the bands were calculated using Image Studio software, normalized to β-actin levels, and expressed as fold values compared to empty vector-transfected samples. (C) HEK 293T cells were transfected with plasmids encoding NSP1 or N protein or empty vector (pcDNA) and Renilla luciferase reporter. After 24 h, cell lysates were subjected to luciferase assay. The data are presented as fold activity relative to the empty vector control. (D to F) HEK 293T cells were transduced with lentivirus encoding AcGFP for 4 h and then transfected with plasmids encoding NSP1 or N protein for 24 h. Total RNA and protein were harvested, and GFP transcript (normalized to ACTB mRNA) and protein (normalized to β-actin) levels were determined by qRT-PCR and immunoblotting, respectively. (G and H) HEK 293T cells were transfected with plasmids encoding NSP1 or NS3A and STAT2-GFP. After 24 h, cells were treated with either DMSO or 100 μM epoxomicin for 24 h. Cell lysates were then processed by immunoblotting with antibodies against FLAG, STAT2, and β-actin. Data are means ± SEM from three independent experiments. *, P < 0.05; **, P < 0.01; NS, not significant.

Similar articles

Cited by

References

    1. Wang D, Hu B, Hu C, Zhu F, Liu X, Zhang J, Wang B, Xiang H, Cheng Z, Xiong Y, Zhao Y, Li Y, Wang X, Peng Z. 2020. Clinical characteristics of 138 hospitalized patients with 2019 novel coronavirus-infected pneumonia in Wuhan, China. JAMA 323:1061. 10.1001/jama.2020.1585. - DOI - PMC - PubMed
    1. Zhu N, Zhang D, Wang W, Li X, Yang B, Song J, Zhao X, Huang B, Shi W, Lu R, Niu P, Zhan F, Ma X, Wang D, Xu W, Wu G, Gao GF, Tan W, China Novel Coronavirus Investigating and Research Team . 2020. A novel coronavirus from patients with pneumonia in China, 2019. N Engl J Med 382:727–733. 10.1056/NEJMoa2001017. - DOI - PMC - PubMed
    1. Andersen KG, Rambaut A, Lipkin WI, Holmes EC, Garry RF. 2020. The proximal origin of SARS-CoV-2. Nat Med 26:450–452. 10.1038/s41591-020-0820-9. - DOI - PMC - PubMed
    1. Xie M, Chen Q. 2020. Insight into 2019 novel coronavirus—an updated interim review and lessons from SARS-CoV and MERS-CoV. Int J Infect Dis 94:119–124. 10.1016/j.ijid.2020.03.071. - DOI - PMC - PubMed
    1. Arons MM, Hatfield KM, Reddy SC, Kimball A, James A, Jacobs JR, Taylor J, Spicer K, Bardossy AC, Oakley LP, Tanwar S, Dyal JW, Harney J, Chisty Z, Bell JM, Methner M, Paul P, Carlson CM, McLaughlin HP, Thornburg N, Tong S, Tamin A, Tao Y, Uehara A, Harcourt J, Clark S, Brostrom-Smith C, Page LC, Kay M, Lewis J, Montgomery P, Stone ND, Clark TA, Honein MA, Duchin JS, Jernigan JA, Public Health–Seattle and King County and CDC COVID-19 Investigation Team . 2020. Presymptomatic SARS-CoV-2 Infections and Transmission in a Skilled Nursing Facility. N Engl J Med 382:2081–2090. 10.1056/NEJMoa2008457. - DOI - PMC - PubMed

Publication types

MeSH terms

LinkOut - more resources