. 2021 Jul;35(7):e21725.
doi: 10.1096/fj.202002652RR.

PAI-1 induction during kidney injury promotes fibrotic epithelial dysfunction via deregulation of klotho, p53, and TGF-β1-receptor signaling

Affiliations

PAI-1 induction during kidney injury promotes fibrotic epithelial dysfunction via deregulation of klotho, p53, and TGF-β1-receptor signaling

Cody C Gifford et al. FASEB J. 2021 Jul.

Abstract

Renal fibrosis leads to chronic kidney disease, which affects over 15% of the U.S. population. PAI-1 is highly upregulated in the tubulointerstitial compartment in several common nephropathies and PAI-1 global ablation affords protection from fibrogenesis in mice. The precise contribution of renal tubular PAI-1 induction to disease progression, however, is unknown and surprisingly, appears to be independent of uPA inhibition. Human renal epithelial (HK-2) cells engineered to stably overexpress PAI-1 underwent dedifferentiation (E-cadherin loss, gain of vimentin), G2/M growth arrest (increased p-Histone3, p21), and robust induction of fibronectin, collagen-1, and CCN2. These cells are also susceptible to apoptosis (elevated cleaved caspase-3, annexin-V positivity) compared to vector controls, demonstrating a previously unknown role for PAI-1 in tubular dysfunction. Persistent PAI-1 expression results in a loss of klotho expression, p53 upregulation, and increases in TGF-βRI/II levels and SMAD3 phosphorylation. Ectopic restoration of klotho in PAI-1-transductants attenuated fibrogenesis and reversed the proliferative defects, implicating PAI-1 in klotho loss in renal disease. Genetic suppression of p53 reversed the PA1-1-driven maladaptive repair, moreover, confirming a pathogenic role for p53 upregulation in this context and uncovering a novel role for PAI-1 in promoting renal p53 signaling. TGF-βRI inhibition also attenuated PAI-1-initiated epithelial dysfunction, independent of TGF-β1 ligand synthesis. Thus, PAI-1 promotes tubular dysfunction via klotho reduction, p53 upregulation, and activation of the TGF-βRI-SMAD3 axis. Since klotho is an upstream regulator of both PAI-1-mediated p53 induction and SMAD3 signaling, targeting tubular PAI-1 expression may provide a novel, multi-level approach to the therapy of CKD.

Keywords: PAI-1; TGF-β1; cell cycle arrest; chronic kidney disease; epithelial dysfunction; klotho; obstructive nephropathy; p53; renal fibrosis.


Conflict of interest statement

CONFLICT OF INTEREST

All authors declared no conflict of interest and agreed on the manuscript prior to submission.

Figures

FIGURE 1
FIGURE 1
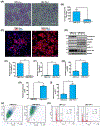
Generation and validation of stable PAI-1 induction in renal epithelial cells. A, Schematic for generation of the PAI-1 stable transductants. HK2s cells are infected with either a control or PAI-1 vector driven by the CMV promoter, followed by stable selection with puromycin. PAI-1 expression in transgenic populations are confirmed in (B) by immunofluorescence imaging, showing PAI-1 [in green] and nuclear staining with DAPI [in blue]. 20x magnification. Scale bar = 165 μm. The highlighted region in the CMV-Con panel in (B) illustrates that these cells do express PAI-1 but at considerably lower levels relative to CMV-PAI-1 cultures. C, Percentage of PAI-1 positivity from 5 individual fields of CMV-Con and CMV-PAI-1 immunofluorescent staining from (B); data represented as (DAPI+/PAI-1+), n = 3, ***P < .001. D, Western blot analysis of PAI-1 expression between CMV-Con and CMV-PAI-1 cells in biological triplicate experiments with high and low exposure, with GAPDH serving as a loading control. n = 10, **P < .01. E, Histogram depicting PAI-1 levels from western blots in (D), data represented as (mean ± SD)
FIGURE 2
FIGURE 2
PAI-1 overexpression in kidney epithelial cells results in dedifferentiation and G2/M growth arrest. A, Crystal violet staining of equally seeded (10 000 cells per dish) CMV-Con and CMV-PAI-1 cultures grown for 5 days. B, Quantification of cell number per field from (A). Three fields per replicate were counted for three separate studies (n = 3). Scale bar = 400 μm, P < .05. C, Immunofluorescent imaging of CMV-Con and CMV-PAI-1 cultures seeded equivalently, showing α-SMA [in red] and nuclear staining with DAPI [in blue]. 20x magnification. Scale bar = 165 μm. D-I, Western blot analysis of CMV-Con and CMV-PAI-1 cells confirming loss of expression of E-Cadherin (D, E; P < .001), upregulation of vimentin (D, F; P < .001), α-SMA (D, G; P < .01), p21 (D, H; P < .001) and p-H3 (D, I; P < .05). Histograms (E-I) depict the relative expression of the indicated markers for biological triplicate cultures for 10 independent studies (n = 10). J-K, Flow analysis of propidium iodide-stained CMV-Con and CMV-PAI-1 cultures demonstrating cell-scattering properties in (J) and the percentage of cells in the G1, S and G2/M phase of the cell cycle in (K). n = 3, *P < .05, ***P < .001
FIGURE 3
FIGURE 3
Overexpression of PAI-1 in renal epithelial cells results in a predisposition to apoptosis. A, Phase contrast images of confluent CMV-Con and CMV-PAI-1 HK2 cultures at day 0 and crystal violet images of the cultures taken 6 days after serum deprivation to assess cell monolayer detachment. n = 3, Scale bar = 400 μm B, Histogram showing the number of cells positive for Annexin-V staining between CMV-Con (Black) and CMV-PAI-1 (red) HK2s. C, Representative graphs showing the frequency of healthy cells (Annexin−/PI−) and early apoptotic cells (Annexin+/PI−). D, Western blot analysis showing biological triplicate experiments of CMV-Con and CMV-PAI-1 cultures for basal expression levels of pro-caspase-9 (D, E; P < .001) and cleaved caspase-3 (D, F; P < .05), with GAPDH as the loading control. G, Confluent Con-shRNA and PAI-1 shRNA HK2s subjected to phase contrast microscopy before serum deprivation. Cells are fixed and stained with crystal violet on day 8 to assess for monolayer detachment. n = 3, Scale bar = 400 μm. Data in (E) and (F) are presented as (mean ± SD). n = 3, *P < .05, **P < .01, ***P < .001
FIGURE 4
FIGURE 4
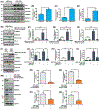
Sustained PAI-1 expression leads to fibrotic factor induction. Immunoblot analysis of biological triplicate experiments of CMV-Con and CMV-PAI-1 HK2 cell extracts showing relative expression levels of fibronectin (A, B; P < .01), collagen-1 (A, C; P < .01), and CCN2 (A, D; P < .001) for ten separate studies, n = 10. E-H, LOXL2 (E, F; P < .01), MMP-9 (E, G; P < .05), Snail1 (E, H; P < .01), MMP-2, Endothelin and VEGF-C (E; n.s.) expression levels between cultures assessed for 3 separate studies. I-J, Cytokine protein array analysis of CMV-Con and CMV-PAI-1 cell lysate extracts for TIMP1 (I; P < .05) and TIMP2 (J; P < .05) expression. n = 3. *P < .05, **P < .01, ***P < .001. Histograms (B-D and F-J) depict the relative expression (mean ± SD) of the indicated markers. ns, not significant
FIGURE 5
FIGURE 5
PAI-1 induced p53 upregulation is critical for the subsequent maladaptive response. A, Western blot assessments for total and p-p53 protein levels between CMV-Con and CMV-PAI-1 populations. B-C, Histograms depicting the relative expression of p53 levels (mean ± SD) for three independent studies, n = 3. D-G, Lysates of CMV-PAI-1+Con-shRNA and CMV-PAI-1+p53-shRNA double transductants are immunoblotted for p53 (D, E; P < .001), p21 (D, F; P < .01), p-H3 (D, G; P < .01), fibronectin (H, I; P < .01), collagen-1 (H, J; P < .01). Histograms in (E-G) and (I-J) depict the relative expression (mean ± SD) for indicated proteins from the immunoblots in (D) and (H), shown as biological triplicates for three independent studies (n = 3). K, Confluent monolayers of CMV-PAI-1+Con-shRNA and CMV-PAI-1+p53-shRNA HK2 cultures are serum-starved for 6 days. Phase contrast and crystal violet images are taken on day 0 and day 6 to assess cell monolayer detachment. Scale bar = 400 μm. L, Western blot analysis for FAK and p-ERK1/2 protein levels between CMV-Con and CMV-PAI-1 cultures, with ERK2 serving as a loading control, (n = 3). *P < .05, **P < .01, ***P < .001
FIGURE 6
FIGURE 6
Klotho downregulation consequent to PAI-1 induction contributes to epithelial dysfunction. A-C, Immunoblot analysis of CMV-Con and CMV-PAI-1 cell lysates for PAI-1 (A, B; P < .001) and klotho (A, C; P < .01) expression. Histograms in (B-C) represent the relative expression of the indicated proteins as (mean ± SD) for three independent studies (n = 3). D-I, Protein extracts of CMV-PAI-1+CMV-Con and CMV-PAI-1+CMV-Klotho double transgenic cultures are immunoblotted for klotho (D, E; P < .001), CCN2 (D, F; P < .001), p21 (D, G; P < .01), p53 (D, H; P < .001), p-SMAD3 (D, I; P < .01). GAPDH serves as loading control. Histograms in (E-I) depict the relative levels (mean ± SD) of the indicated proteins for three separate experiments (n = 3). **P < .01, ***P < .001
FIGURE 7
FIGURE 7
TGF-β1 receptor involvement in the PAI-1-driven fibrotic response. A-D, Western blot assessment of CMV-Con and CMV-PAI-1 lysate extracts for TGF-βRI (A, B; P < .05), TGF-βRII (A, C; P < .001), and p-SMAD3 (A, D; P < .05) protein levels for three independent studies. E-H, Drug control experiment for SB431542. CMV-Con cells are treated with either DMSO or the TGF-β1 receptor-1 inhibitor SB431542 (10 μM) followed by either no stimulation or stimulation with 2 ng/mL TGF-β1 for 24 hours prior to western blot analysis for protein levels of p-SMAD3 (E, F; P < .05), fibronectin (E, G; P < .01), and PAI-1 (E, H; P < .001). Histograms in (F-H) represent the relative expression of the indicated protein as (mean ± SD), n = 3. I-L, CMV-Con and CMV-PAI-1 cultures are treated with DMSO or 10 μM SB431542 for 24 hours, followed by western blot analysis for p-SMAD3 (I, J; P < .01), fibronectin (I, K; P < .01) and vimentin (I, L; P < .05). Histograms in (J-L) represent the relative levels (mean ± SD) of the indicated protein. M-Q, Western blot analysis of CMV-PAI-1+Con shRNA and CMV-PAI-1+TGF-βRI shRNA HK2 lysate extracts for TGF-βRI (M, N; P < .05), p-SMAD3 (M, O; P < .05), fibronectin (M, P; P < .05), and p21 (M, Q; P < .01). N-Q, represent the relative expression of the indicated protein as (mean ± SD), n = 3. *P < .05, **P < .01, ***P < .001, n.s., not significant
FIGURE 8
FIGURE 8
Dysfunction driven by PAI-1 overexpression is independent of TGF-β1 ligand synthesis or release. A, ELISA analysis for active TGF-β1 ligand concentrations in the conditioned media isolated from serum-starved CMV-Con and CMV-PAI-1 cultures. n = 3. B-D, Cytokine protein array analysis of CMV-Con and CMV-PAI-1 conditioned media for active TGF-β1 (B), TGF-β2 (C), and TGF-β3 (D). Graphs depict the relative levels of secreted ligands (mean ± SD), n = 3. E, Immunoblot comparison of fibrotic responses in the cellular lysates of TGF-β1 stimulated or unstimulated CMV-Con and untreated CMV-PAI-1 culture extracted in parallel. F, CMV-Con HK2 cells pretreated with 20 μg/mL of TGF-β1 neutralizing antibody or 20 μg/mL IgY control antisera are stimulated with 2 ng/mL TGF-β1. Cells are harvested after 24 hours and expression of p-SMAD3, fibronectin and E-cadherin are analyzed by western blot. n = 3. G, Equally seeded CMV-PAI-1 HK2s are treated with various concentrations of TGF-β1 neutralizing antibody (0, 20, 40, 60 μg/mL) or 60 μg/mL IgY control antisera for 24 hours prior to western blot analysis of extracts for p-SMAD3, fibronectin, collagen-1, vimentin, p53 and p21, with GAPDH is serving as a loading marker. n = 3, *P < .05, **P < .01, ***P < .001, n.s., not significant. H, Western blot analysis of cell lysate extracts from CMV-PAI-1+Con shRNA and CMV-PAI-1+TGF-β1 shRNA HK2 cells for the indicated fibrotic markers. Cytokine protein array analysis of whole cell lysates (I) and conditioned media (J) used to validate TGF-β1 knockdown
FIGURE 9
FIGURE 9
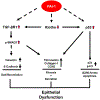
Model. PAI-1 upregulation leads to downregulation of klotho, upregulation of p53, and induction of TGF-β1 receptor signaling independent of the TGF-β1 ligand, resulting in expression and secretion of fibrotic markers, downregulation of E-cadherin and upregulation of vimentin, leading to dedifferentiation, and upregulation of p21, p-H3, causing G2/M cell cycle arrest and a propensity to cell death, collectively establishing a role for PAI-1 in tubular epithelial dysfunction. Klotho regulates both p53 and SMAD3 signaling, promoting PAI-1-mediated tubular maladaptive responses

Similar articles

Cited by

References

    1. Centers for disease control and prevention. https://www.cdc.gov/kidneydisease/basics.html
    1. Jha V, Garcia-Garcia G, Iseki K, et al. Chronic kidney disease: global dimension and perspectives. Lancet. 2013;382:260–272. - PubMed
    1. Couser WG, Remuzzi G, Mendis S, Tonelli M. The contribution of chronic kidney disease to the global burden of major noncommuni-cable diseases. Kidney Int. 2011;80:1258–1270. - PubMed
    1. Perico N, Remuzzi G. Chronic kidney disease: a research and public health priority. Nephrol Dial Transplant. 2012;27(Suppl 3):19–26. - PubMed
    1. Ferenbach DA, Bonventre JV. Mechanisms of maladaptive repair after AKI leading to accelerated kidney ageing and CKD. Nat Rev Nephrol. 2015;11:264–276. - PMC - PubMed

Publication types

MeSH terms