

Japan's voluntary lockdown
- PMID: 34111163
- PMCID: PMC8191912
- DOI: 10.1371/journal.pone.0252468
Japan's voluntary lockdown
Abstract
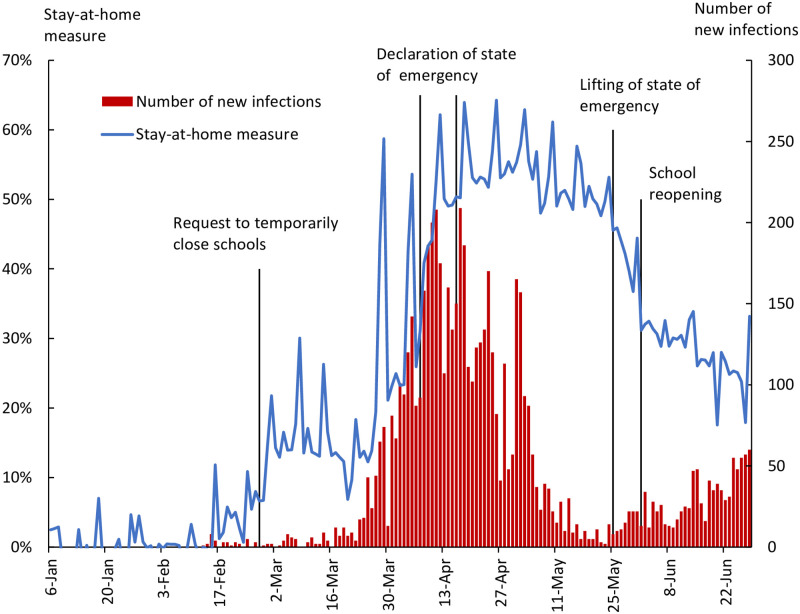
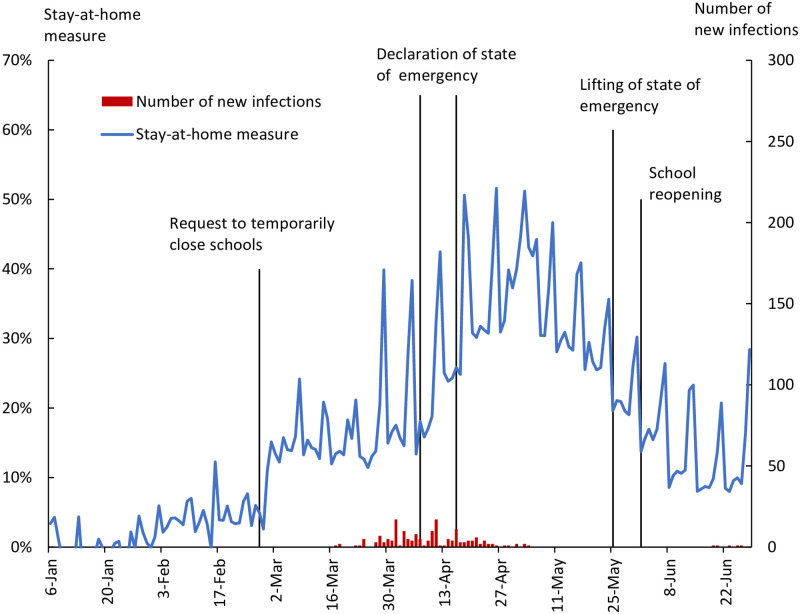
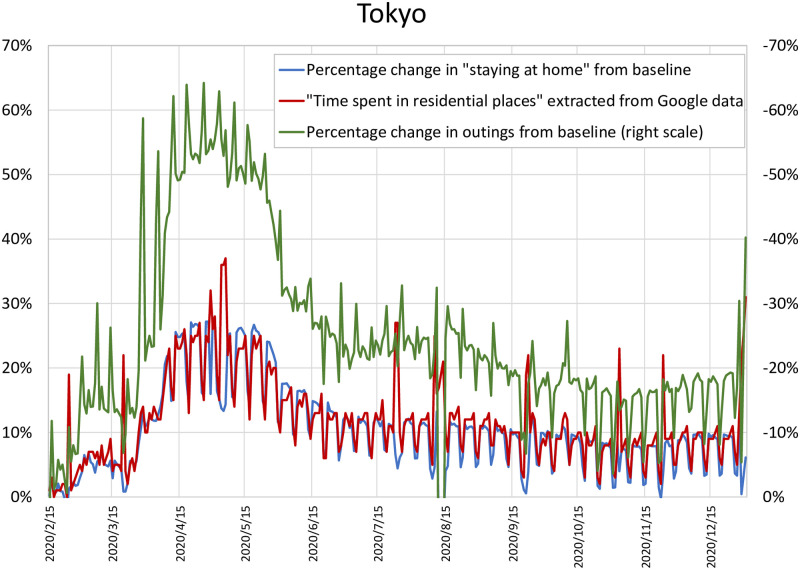
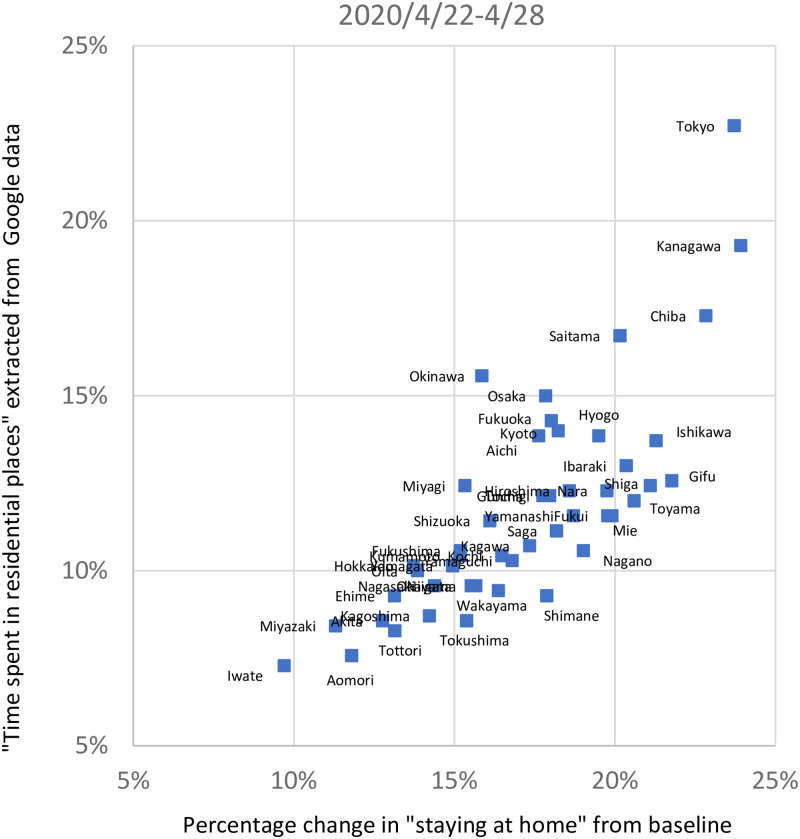
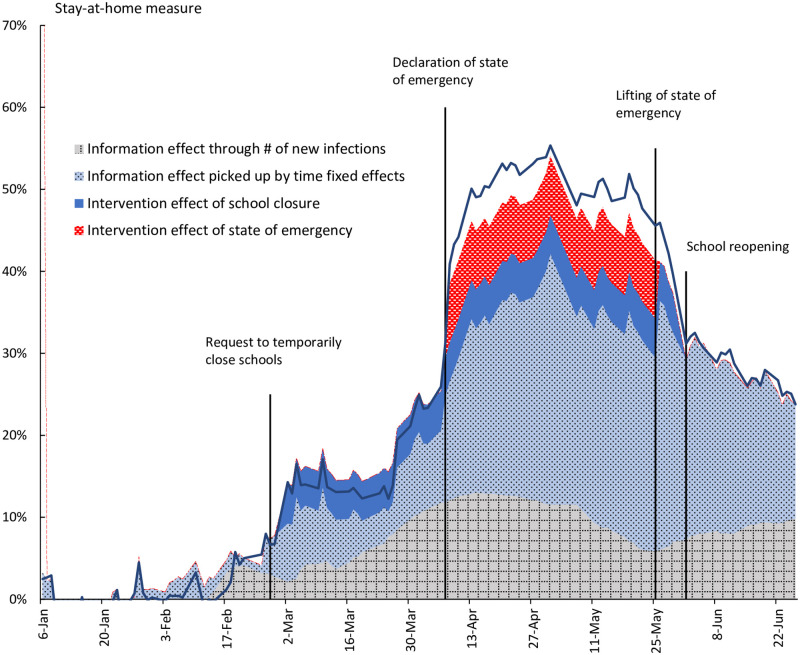
Japan's government has taken a number of measures, including declaring a state of emergency, to combat the spread COVID-19. We examine the mechanisms through which the government's policies have led to changes in people's behavior. Using smartphone location data, we construct a daily prefecture-level stay-at-home measure to identify the following two effects: (1) the effect that citizens refrained from going out in line with the government's request, and (2) the effect that government announcements reinforced awareness with regard to the seriousness of the pandemic and people voluntarily refrained from going out. Our main findings are as follows. First, the declaration of the state of emergency reduced the number of people leaving their homes by 8.5% through the first channel, which is of the same order of magnitude as the estimates obtained for lockdowns in the United States. Second, a 1% increase in new infections in a prefecture reduces people's outings in that prefecture by 0.027%. Third, the government's requests are responsible for about one quarter of the decrease in outings in Tokyo, while the remaining three quarters are the result of citizens obtaining new information through government announcements and the daily release of the number of infections. The findings suggest that what mattered for containing the spread of COVID-19 was not strong, legally binding measures but the provision of appropriate information that encouraged people to change their behavior.
Conflict of interest statement
No authors have competing interests.
Figures
References
-
- Alexander, Diane, and Ezra Karger. “Do stay-at-home orders cause people to stay at home? Effects of stay-at-home orders on consumer behavior.” FRB of Chicago Working Paper No. 2020-12, June 2020.
-
- Barrios, John M., and Yael Hochberg. “Risk perception through the lens of politics in the time of the COVID-19 pandemic.” No. 27008. National Bureau of Economic Research, 2020.
-
- Chiou, Lesley, and Catherine Tucker. “Social distancing, internet access and inequality.” No. 26982. National Bureau of Economic Research, 2020.
-
- Gupta, Sumedha, Thuy D. Nguyen, Felipe Lozano Rojas, Shyam Raman, Byungkyu Lee, Ana Bento, et al. “Tracking public and private responses to the COVID-19 epidemic: Evidence from state and local government actions.” No. 27027. National Bureau of Economic Research, 2020.
Publication types
MeSH terms
LinkOut - more resources
Full Text Sources
Medical
