Meta-Analysis
. 2021 Jun 10;16(6):e0253007.
doi: 10.1371/journal.pone.0253007. eCollection 2021.

Screening for SARS-CoV-2 by RT-PCR: Saliva or nasopharyngeal swab? Rapid review and meta-analysis

Affiliations
Meta-Analysis

Screening for SARS-CoV-2 by RT-PCR: Saliva or nasopharyngeal swab? Rapid review and meta-analysis

Nusaïbah Ibrahimi et al. PLoS One. .

Abstract

Background: Diagnosis of COVID-19 in symptomatic patients and screening of populations for SARS-CoV-2 infection require access to straightforward, low-cost and high-throughput testing. The recommended nasopharyngeal swab tests are limited by the need of trained professionals and specific consumables and this procedure is poorly accepted as a screening method In contrast, saliva sampling can be self-administered.

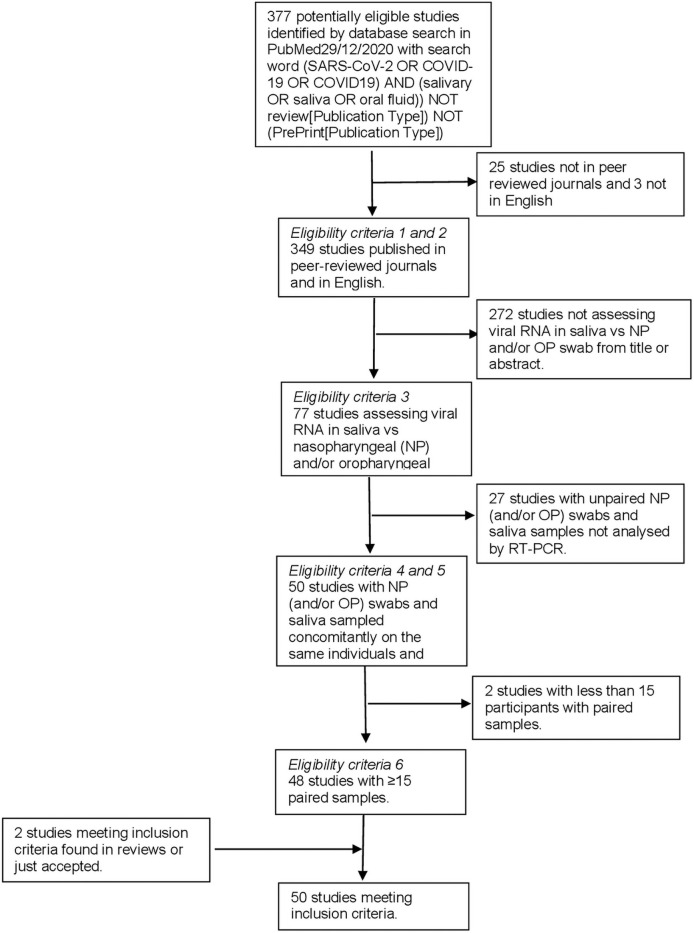
Methods: In order to compare saliva and nasopharyngeal/oropharyngeal samples for the detection of SARS-CoV-2, we designed a meta-analysis searching in PubMed up to December 29th, 2020 with the key words "(SARS-CoV-2 OR COVID-19 OR COVID19) AND (salivary OR saliva OR oral fluid)) NOT (review[Publication Type]) NOT (PrePrint[Publication Type])" applying the following criteria: records published in peer reviewed scientific journals, in English, with at least 15 nasopharyngeal/orapharyngeal swabs and saliva paired samples tested by RT-PCR, studies with available raw data including numbers of positive and negative tests with the two sampling methods. For all studies, concordance and sensitivity were calculated and then pooled in a random-effects model.

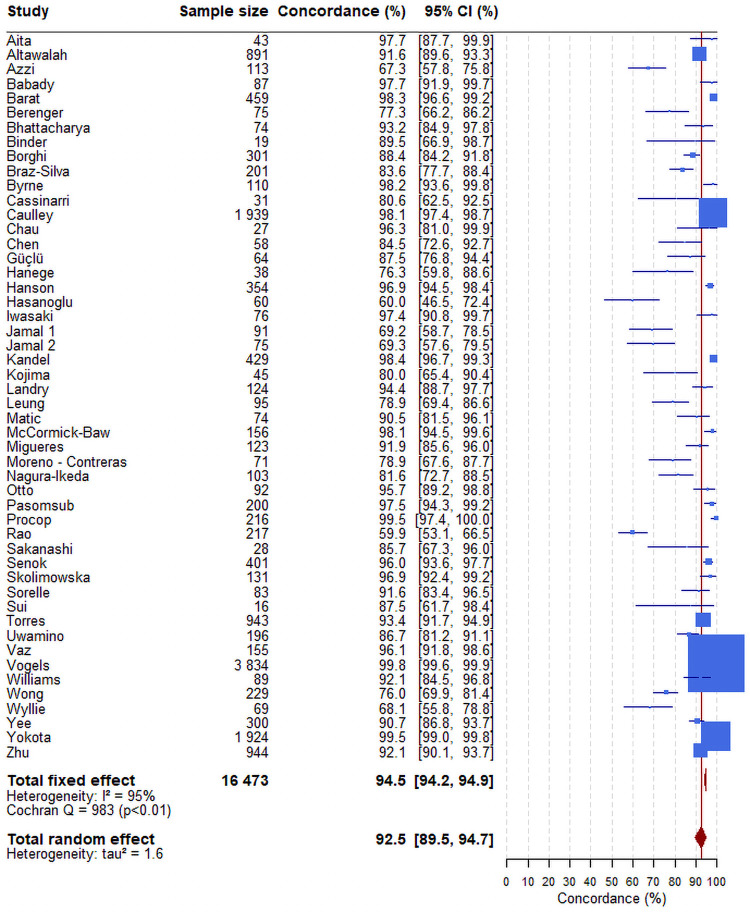
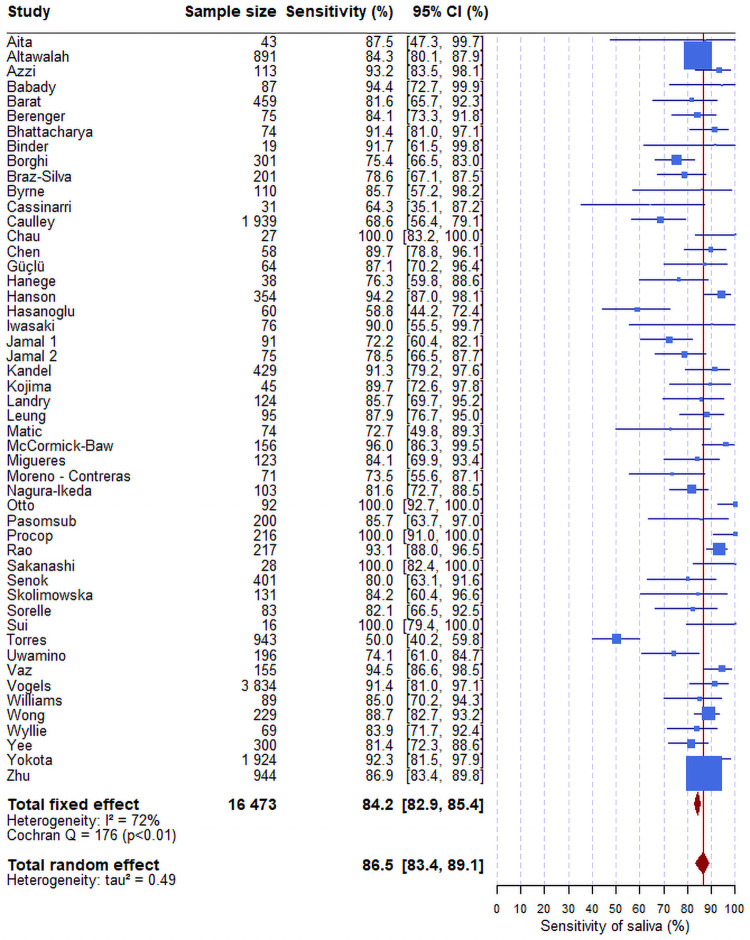
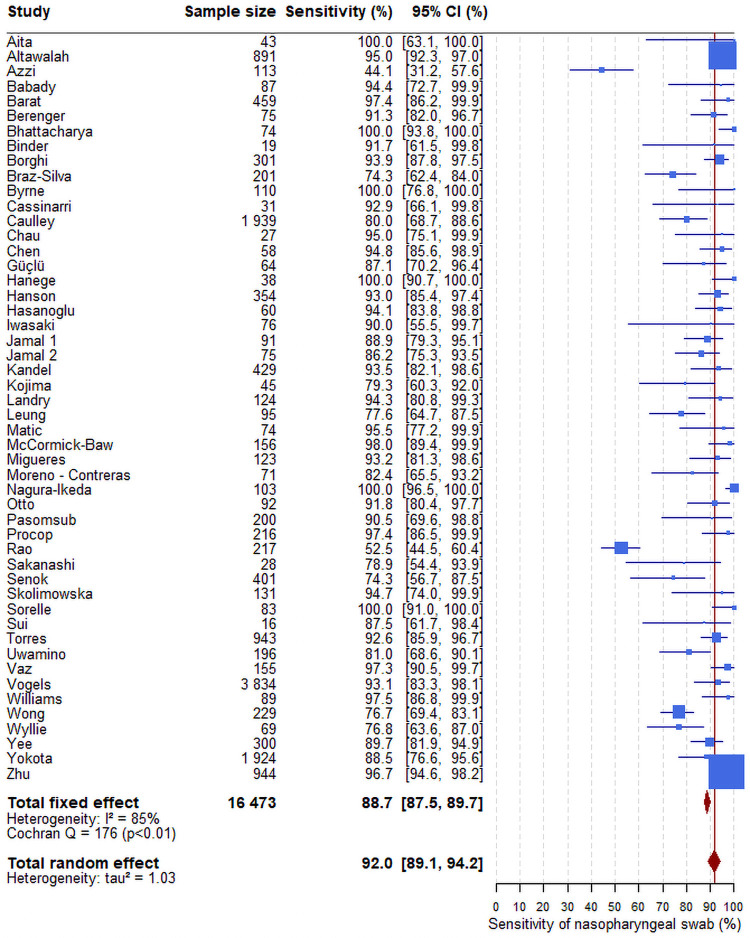
Findings: A total of 377 studies were retrieved, of which 50 were eligible, reporting on 16,473 pairs of nasopharyngeal/oropharyngeal and saliva samples. Meta-analysis showed high concordance, 92.5% (95%CI: 89.5-94.7), across studies and pooled sensitivities of 86.5% (95%CI: 83.4-89.1) and 92.0% (95%CI: 89.1-94.2) from saliva and nasopharyngeal/oropharyngeal swabs respectively. Heterogeneity across studies was 72.0% for saliva and 85.0% for nasopharyngeal/oropharyngeal swabs.

Interpretation: Our meta-analysis strongly suggests that saliva could be used for frequent testing of COVID-19 patients and "en masse" screening of populations.


Conflict of interest statement

The authors have declared that no competing interests exist.

Figures

Fig 1
Fig 1. Evidence search and selection.
Fig 2
Fig 2. Forest plot of the concordance between the results of RTqPCR tests on nasopharyngeal and saliva samples.
The confidence intervals for each study are computed using the Clopper-Pearson method. Those for the overall estimates (fixed-effect or random-effect) are based on normal approximation. The blue box size is proportional to the number of positive tests. The red line corresponds to the value of the overall concordance of the random-effect model. This vertical line enables to locate the studies having an estimate concordance higher than 92.5%.
Fig 3
Fig 3. Forest plot of the sensitivity of RTqPCR test on saliva.
The confidence intervals for each study are computed using the Clopper-Pearson method. Those for the overall estimates (fixed-effect or random-effect) are based on normal approximation. The blue box size is proportional to the number of positive tests. The difference between fixed-effect and random-effect overall sensitivity (respectively 84.2%, 86.5%) is low. The red line corresponds to the value of the overall sensitivity of the random-effect model. This vertical line enables to locate the studies having an estimate sensitivity higher than 86.5%. The heterogeneity estimator I2 is equal to 72%, which means a higher level of heterogeneity.
Fig 4
Fig 4. Forest plot of the sensitivity of RTqPCR test on nasopharyngeal sample.
The confidence intervals for each study are computed using the Clopper-Pearson method. Those for the overall estimates (fixed-effect or random-effect) are based on the normal approximation. The blue box size is proportional to the number of positive tests. The red line corresponds to the value of the overall sensitivity of the random-effect model. This vertical line enables to locate the studies having an estimate sensitivity higher than 92.0%. The heterogeneity estimator I2 is equal to 85%, which means a higher level of heterogeneity.

Similar articles

Cited by

References

    1. Ferretti L, Wymant C, Kendall M, Zhao L, Nurtay A, Abeler-Dorner L, et al.. Quantifying SARS-CoV-2 transmission suggests epidemic control with digital contact tracing. Science. 2020;368(6491). doi: 10.1126/science.abb6936 - DOI - PMC - PubMed
    1. Larremore DB, Wilder B, Lester E, Shehata S, Burke JM, Hay JA, et al.. Test sensitivity is secondary to frequency and turnaround time for COVID-19 screening. Sci Adv. 2020. - PMC - PubMed
    1. Lavezzo E, Franchin E, Ciavarella C, Cuomo-Dannenburg G, Barzon L, Del Vecchio C, et al.. Suppression of a SARS-CoV-2 outbreak in the Italian municipality of Vo’. Nature. 2020;584(7821):425–9. doi: 10.1038/s41586-020-2488-1 - DOI - PubMed
    1. Xing Y, Wong GWK, Ni W, Hu X, Xing Q. Rapid Response to an Outbreak in Qingdao, China. N Engl J Med. 2020;383(23):e129. doi: 10.1056/NEJMc2032361 - DOI - PMC - PubMed
    1. Laboratory testing for 2019 novel coronavirus (2019-nCoV) in suspected human cases. https://www.who.int/publications-detail/laboratory-testing-for-2019-nove... (accessed Jan. 3, 2021).