

Use of US Blood Donors for National Serosurveillance of Severe Acute Respiratory Syndrome Coronavirus 2 Antibodies: Basis for an Expanded National Donor Serosurveillance Program
- PMID: 34111244
- PMCID: PMC8406874
- DOI: 10.1093/cid/ciab537
Use of US Blood Donors for National Serosurveillance of Severe Acute Respiratory Syndrome Coronavirus 2 Antibodies: Basis for an Expanded National Donor Serosurveillance Program
Abstract
Background: The Recipient Epidemiology and Donor Evaluation Study-IV-Pediatric (REDS-IV-P) Epidemiology, Surveillance and Preparedness of the Novel SARS-CoV-2 Epidemic (RESPONSE) seroprevalence study conducted monthly cross-sectional testing for severe acute respiratory syndrome coronavirus 2 (SARS-CoV-2) antibodies in blood donors in 6 US metropolitan regions to estimate the extent of SARS-CoV-2 infections over time.
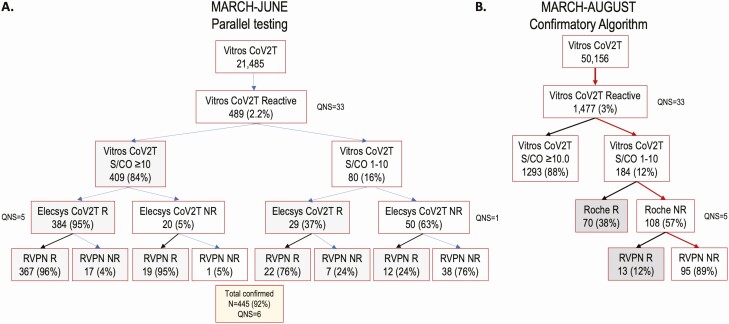
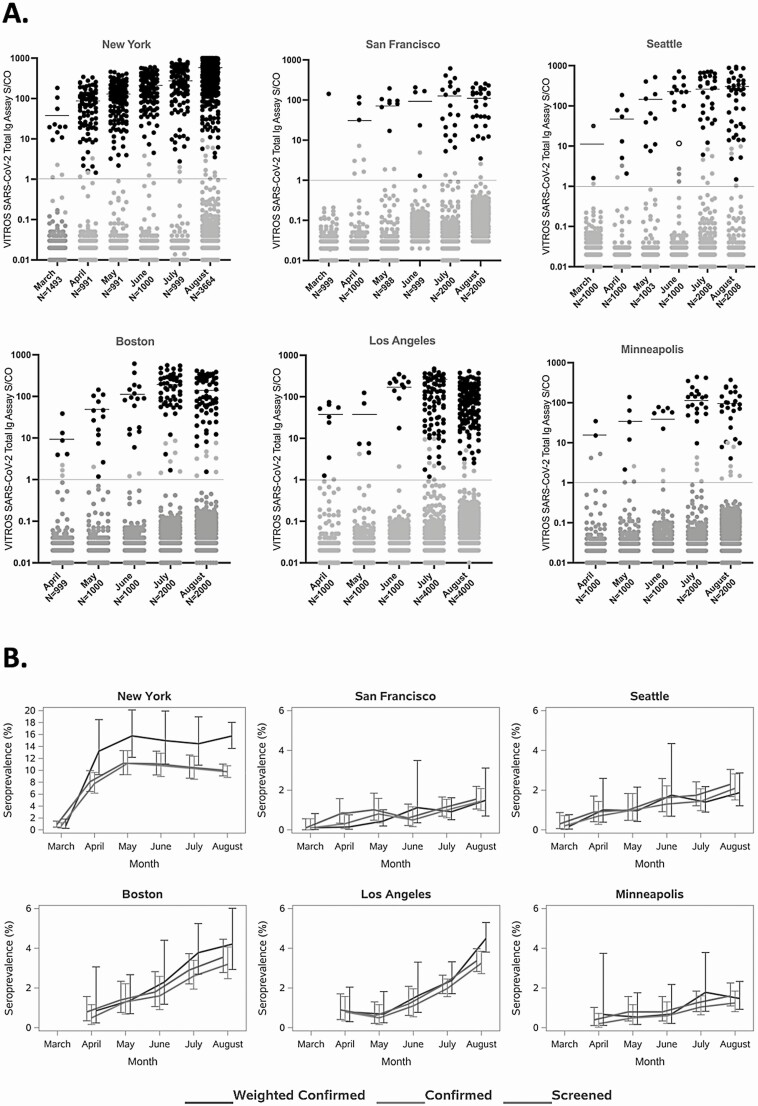
Methods: During March-August 2020, approximately ≥1000 serum specimens were collected monthly from each region and tested for SARS-CoV-2 antibodies using a well-validated algorithm. Regional seroprevalence estimates were weighted based on demographic differences compared with the general population. Seroprevalence was compared with reported coronavirus disease 2019 (COVID-19) case rates over time.
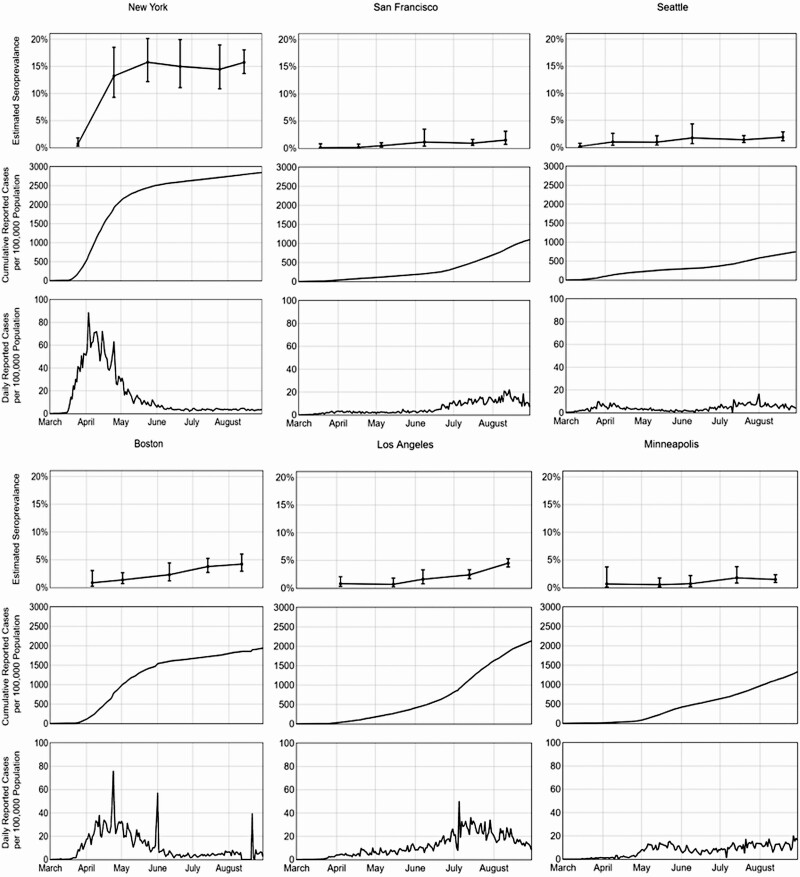
Results: For all regions, seroprevalence was <1.0% in March 2020. New York, New York, experienced the biggest increase (peak seroprevalence, 15.8% in May). All other regions experienced modest increases in seroprevalence (1%-2% in May-June to 2%-4% in July-August). Seroprevalence was higher in younger, non-Hispanic black, and Hispanic donors. Temporal increases in donor seroprevalence correlated with reported case rates in each region. In August, 1.3-5.6 estimated cumulative infections (based on seroprevalence data) per COVID-19 case were reported to the Centers for Disease Control and Prevention.
Conclusions: Increases in seroprevalence were found in all regions, with the largest increase in New York. Seroprevalence was higher in non-Hispanic black and Hispanic than in non-Hispanic white blood donors. SARS-CoV-2 antibody testing of blood donor samples can be used to estimate the seroprevalence in the general population by region and demographic group. The methods derived from the RESPONSE seroprevalence study served as the basis for expanding SARS-CoV-2 seroprevalence surveillance to all 50 states and Puerto Rico.
Keywords: COVID-19; COVID-19 srological testing; SARS-CoV-2; seroprevalence.
© The Author(s) 2021. Published by Oxford University Press for the Infectious Diseases Society of America. All rights reserved. For permissions, e-mail: journals.permissions@oup.com.
Figures
References
-
- European Centre for Disease Prevention and Control. COVID-19 situation update worldwide, as of 12 May 2021. Available at: https://www.ecdc.europa.eu/en/geographical-distribution-2019-ncov-cases. Accessed 12 May 2021.
-
- Long QX, Tang XJ, Shi QL, et al. Clinical and immunological assessment of asymptomatic SARS-CoV-2 infections. Nat Med 2020; 26:1200–4. - PubMed
-
- Busch MP. Unprecedented nationwide blood studies seek to track U.S. coronavirus spread. In: Cohen J. Science, 2020. Available at: https://www.sciencemag.org/news/2020/04.
-
- Williamson PC, Linnen JM, Kessler DA, et al. First cases of Zika virus-infected US blood donors outside states with areas of active transmission. Transfusion 2017; 57:770–8. - PubMed
