. 2021 Sep 27;106(10):2979-2990.
doi: 10.1210/clinem/dgab415.

Relationship Between Insulin Sensitivity and Menstrual Cycle Is Modified by BMI, Fitness, and Physical Activity in NHANES

Affiliations

Relationship Between Insulin Sensitivity and Menstrual Cycle Is Modified by BMI, Fitness, and Physical Activity in NHANES

Kirstin A MacGregor et al. J Clin Endocrinol Metab. .

Abstract

Context: There is evidence demonstrating variation in insulin sensitivity across the menstrual cycle. However, to date, research has yielded inconsistent results.

Objective: This study investigated variation in insulin sensitivity across the menstrual cycle and associations with body mass index (BMI), physical activity, and cardiorespiratory fitness (CRF).

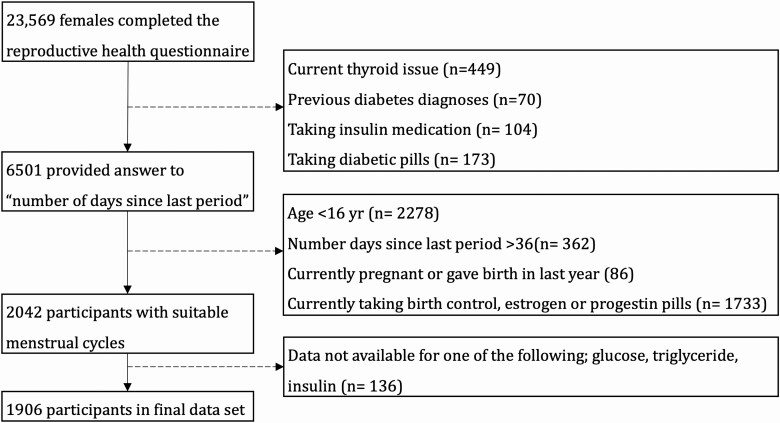
Methods: Data from 1906 premenopausal women in NHANES cycles 1999 to 2006 were analyzed. Menstrual cycle day was assessed using questionnaire responses recording days since last period. Rhythmic variation of plasma glucose, triglycerides, and insulin, homeostatic model of insulin resistance (HOMA-IR), and adipose tissue insulin resistance index (ADIPO-IR) across the menstrual cycle were analyzed using cosinor rhythmometry. Participants were assigned low or high categories of BMI, physical activity, and CRF, and category membership included in cosinor models as covariates.

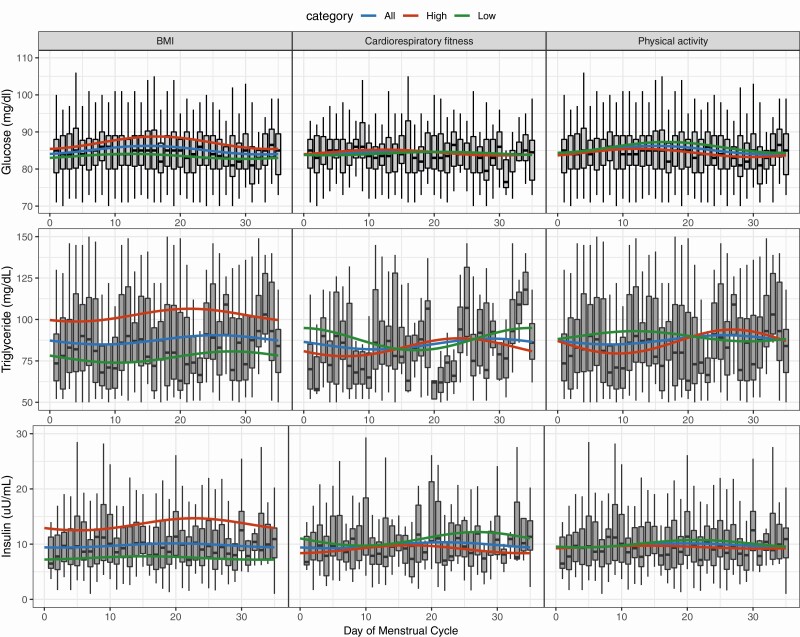
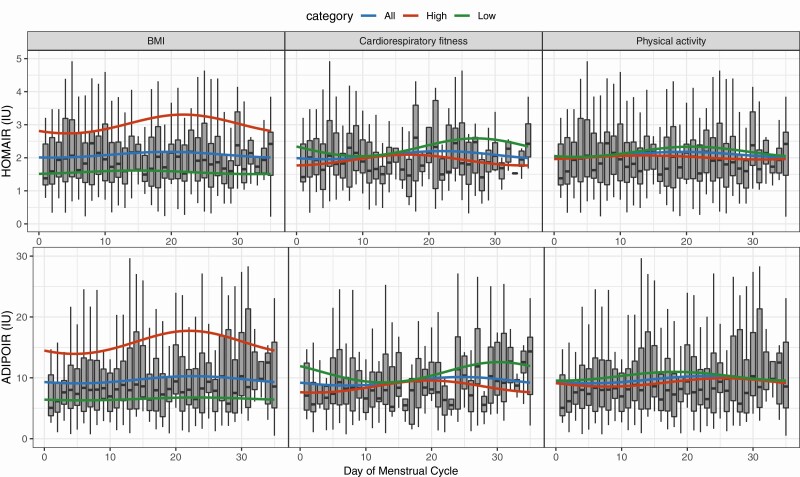
Results: Rhythmicity was demonstrated by a significant cosine fit for glucose (P = .014) but not triglycerides (P = .369), insulin (P = .470), HOMA-IR (P = .461), and ADIPO-IR (P = .335). When covariates were included, rhythmicity was observed when adjusting for: 1) BMI: glucose (P < .001), triglycerides (P < .001), insulin (P < .001), HOMA-IR (P < .001), and ADIPO-IR (P < .001); 2) physical activity: glucose (P < .001), triglycerides (P = .006), and ADIPO-IR (P = .038); and 3) CRF: triglycerides (P = .041), insulin (P = .002), HOMA-IR (P = .004), and ADIPO-IR (P = .004). Triglyceride amplitude, but not acrophase, was greater in the high physical activity category compared to low (P = .018).

Conclusion: Rhythmicity in insulin sensitivity and associated metabolites across the menstrual cycle are modified by BMI, physical activity, and CRF.

Keywords: NHANES; glucose; insulin; insulin sensitivity; menstrual cycle; triglyceride.


Figures

Figure 1.
Figure 1.
Flowchart depicting participant selection in the study. The dotted lines represent participant exclusion.
Figure 2.
Figure 2.
Box plot with cosine wave showing pituitary hormone concentration across the menstrual cycle. A, Follicle-stimulating hormone (FSH). B, Luteinizing hormone (LH).
Figure 3.
Figure 3.
Changes in glucose, triglycerides, and insulin across the menstrual cycle with low and high categories of left, body mass index (BMI); middle, cardiorespiratory fitness; and right, physical activity. Box plot represents all participants data for each respective variable. Cosinor model fits are shown for (blue) all participants, (green) low covariate category, and (red) high covariate category. Low BMI, 24.9 or less; high BMI, greater than 25; low cardiorespiratory fitness, 50th or lower age-specific percentile; high cardiorespiratory fitness, greater than 50th age-specific percentile; low physical activity, less than or equal to 500 metabolic equivalent (MET) min/wk; high physical activity, greater than 500 MET min/wk.
Figure 4.
Figure 4.
Changes in homeostatic model of insulin resistance (HOMA-IR) and adipose tissue insulin resistance index (ADIPO-IR) across the menstrual cycle with low and high categories of left, body mass index (BMI); middle, cardiorespiratory fitness; and right, physical activity. Box plot represents all participant data for each respective variable. Cosinor model fits are shown for (blue) all participants, (green) low covariate category, and (red) high covariate category. Low BMI, 24.9 or less; high BMI, greater than 25; low cardiorespiratory fitness, 50th or lower age-specific percentile; high cardiorespiratory fitness, greater than 50th age-specific percentile; low physical activity, less than or equal to 500 metabolic equivalent (MET) min/wk; high physical activity, greater than 500 MET min/wk.

References

    1. Lin X, Xu Y, Pan X, et al. . Global, regional, and national burden and trend of diabetes in 195 countries and territories: an analysis from 1990 to 2025. Sci Rep. 2020;10(1):14790. - PMC - PubMed
    1. Clarke SL, Reaven GM, Leonard D, et al. . Cardiorespiratory fitness, body mass index, and markers of insulin resistance in apparently healthy women and men. Am J Med. 2020;133(7):825-830.e2. - PMC - PubMed
    1. Sicree RA, Zimmet PZ, Dunstan DW, Cameron AJ, Welborn TA, Shaw JE. Differences in height explain gender differences in the response to the oral glucose tolerance test—the AusDiab Study. Diabet Med. 2008;25(3):296-302. - PubMed
    1. Honka MJ, Latva-Rasku A, Bucci M, et al. . Insulin-stimulated glucose uptake in skeletal muscle, adipose tissue and liver: a positron emission tomography study. Eur J Endocrinol. 2018;178(5):523-531. - PMC - PubMed
    1. Logue J, Walker JJ, Colhoun HM, et al. ; Scottish Diabetes Research Network Epidemiology Group . Do men develop type 2 diabetes at lower body mass indices than women? Diabetologia. 2011;54(12):3003-3006. - PMC - PubMed