. 2021 Aug 9;31(15):3382-3390.e7.
doi: 10.1016/j.cub.2021.05.025. Epub 2021 Jun 9.

An ammonium transporter is a non-canonical olfactory receptor for ammonia

Affiliations

An ammonium transporter is a non-canonical olfactory receptor for ammonia

Alina Vulpe et al. Curr Biol. .

Abstract

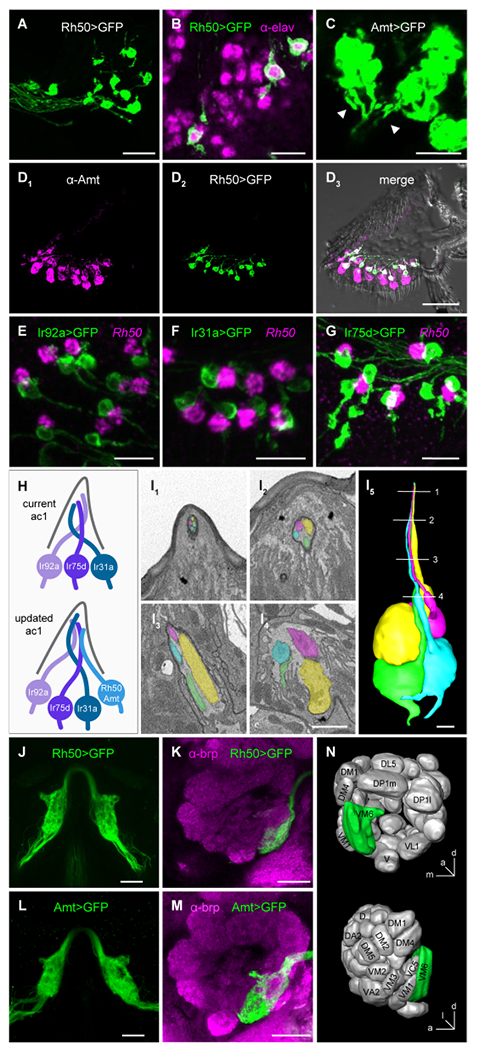
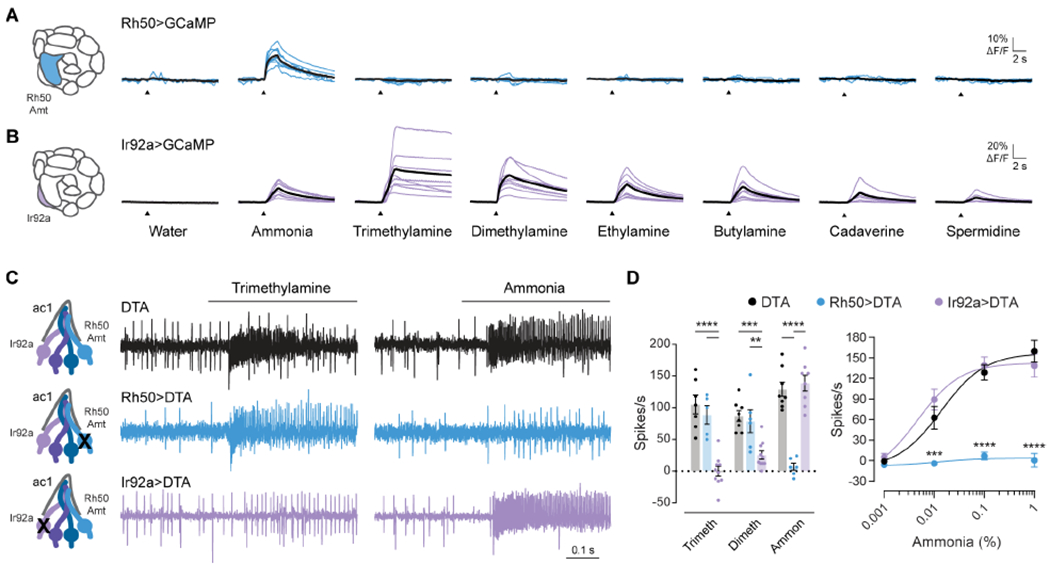
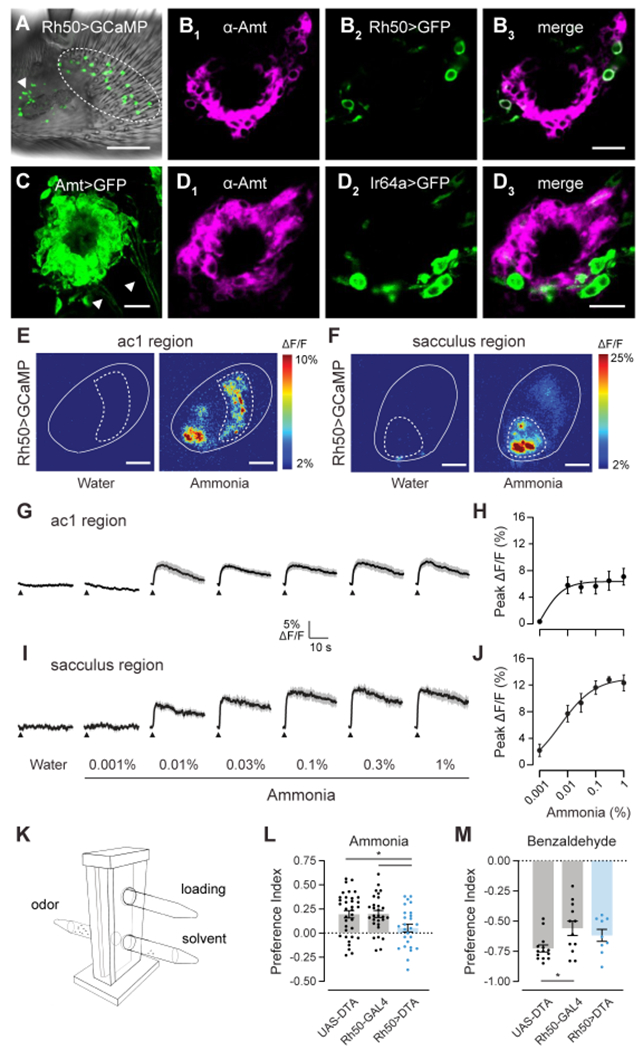
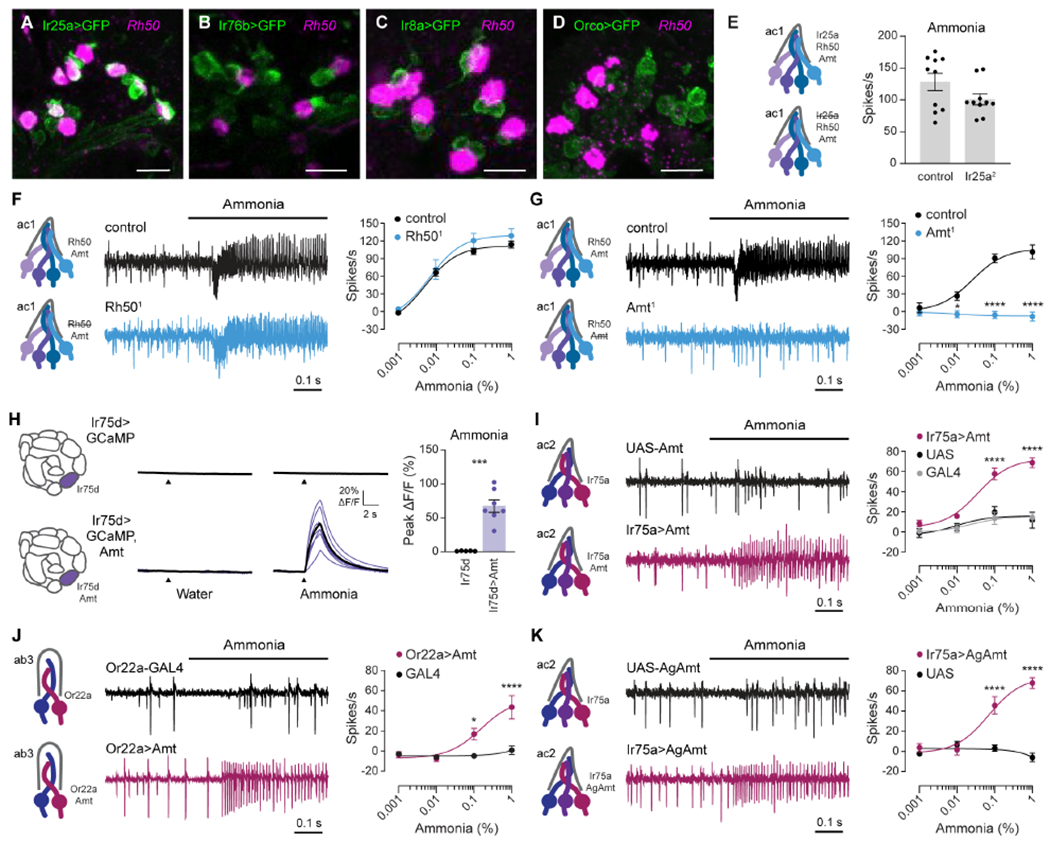
Numerous hematophagous insects are attracted to ammonia, a volatile released in human sweat and breath.1-3 Low levels of ammonia also attract non-biting insects such as the genetic model organism Drosophila melanogaster and several species of agricultural pests.4,5 Two families of ligand-gated ion channels function as olfactory receptors in insects,6-10 and studies have linked ammonia sensitivity to a particular olfactory receptor in Drosophila.5,11,12 Given the widespread importance of ammonia to insect behavior, it is surprising that the genomes of most insects lack an ortholog of this gene.6 Here, we show that canonical olfactory receptors are not necessary for responses to ammonia in Drosophila. Instead, we demonstrate that a member of the ancient electrogenic ammonium transporter family, Amt, is likely a new type of olfactory receptor. We report two hitherto unidentified olfactory neuron populations that mediate neuronal and behavioral responses to ammonia in Drosophila. Their endogenous ammonia responses are lost in Amt mutant flies, and ectopic expression of either Drosophila or Anopheles Amt confers ammonia sensitivity. These results suggest that Amt is the first transporter known to function as an olfactory receptor in animals and that its function may be conserved across insect species.

Keywords: Amt; Drosophila; ammonia; mosquito; olfactory behavior; olfactory receptor; olfactory receptor neurons; sacculus; transporter.


Conflict of interest statement

Declaration of interests The authors declare no competing interests.

Figures

Figure 1.
Figure 1.. Ammonium transporters label a previously unidentified ac1 ORN
(A) Antennal section from an Rh50>GFP fly stained with anti-GFP. Scale bar, 15 μm. (B) Rh50>GFP fly antennal section stained with anti-GFP (green) and anti-elav (magenta), a neuronal marker. Scale bar, 10 μm. (C) High gain confocal image of an Amt>GFP antennal section stained with anti-GFP. Labeled axons (arrowheads) emerge from clusters of GFP+ cells. Scale bar, 10 μm. (D) Immunostaining with anti-Amt (magenta, D1) and anti-GFP (green, D2) on an antennal section from an Rh50>GFP fly. D3, merged image. Scale bar, 40 μm. (E-G) Antennal sections from Ir92a>GFP (E), Ir31a>GFP (F), and Ir75d>GFP (G) flies labeled with an in situ hybridization probe for Rh50 (magenta) and anti-GFP (green). Scale bars, 10 μm. (H) Models of neurons and receptors in ac1 sensilla. (I) SBEM images of a coeloconic sensillum with four ORNs. 3D reconstructions of the ORNs is shown in (I5). Numbered lines indicate the locations of individual sections shown in (I1-4). Scale bars, 1 μm. (J) Two photon in vivo image of the bilateral antennal lobe glomeruli innervated by Rh50+ axons in an Rh50>GFP fly. Scale bar, 20 μm. (K) Confocal image of an antennal lobe from an Rh50>GFP fly brain immunolabeled with antibodies targeting GFP (green) and brp (nc82, magenta), a neuropil marker used to delineate glomeruli. Scale bar, 20 μm. In both J and K, glial GFP expression driven by Rh50-GAL4 was suppressed with repo-GAL80 [40] to improve visualization of the ORN projections. (L and M) Similar to J and K, but with Amt>GFP. (N) Diagram of the location of the glomerulus innervated by Amt/Rh50+ ORNs, corresponding to VM6. See also Figure S1.
Figure 2.
Figure 2.. Amt/Rh50+ ORNs selectively respond to ammonia
(A and B) Antennal lobe calcium responses to water, ammonia, and several amines in axonal projections labeled in Rh50>GCaMP7s (A) and Ir92a>GCaMP7s (B) flies. Blue lines (A) and purple lines (B) are responses in individual flies. Black lines are mean responses. (C) Representative traces of extracellular recordings of action potentials elicited by 1% trimethylamine and 0.1% ammonia in ac1 sensilla in which diphtheria toxin (DTA) was used to ablate Rh50+ ORNs (blue) or Ir92+ ORNs (purple). UAS-DTA flies were used as a control (black). (D) Left, quantification of odor responses in UAS-DTA (black), Rh50>DTA (blue), and Ir92a>DTA (purple) flies (n=5-10 sensilla). Right, dose-response curves of responses to increasing concentrations of ammonia (n=6-8 sensilla per genotype). The dose-response data for 0.1% ammonia are replotted in the bar graph to show individual data points. See also Figure S2.
Figure 3.
Figure 3.. Two populations of Amt/Rh50+ ORNs mediate ammonia sensing
(A) Whole mount image of an antenna from an Rh50>GCaMP7s fly. Rh50+ neurons (green) are found on the ac1 region of the antennal surface (dotted circles) and surrounding the sacculus (arrowhead). Scale bar, 30 μm. (B) Close-up view of sacculus chamber III in an antennal section from an Rh50>GFP fly stained with anti-Amt (magenta, B1) and anti-GFP (green, B2). B3, merged image. Scale bar, 10 μm. (C) High gain confocal image of sacculus chamber III in an antennal section from an Amt>GFP fly stained with anti-GFP. Labeled axons (arrowheads) emerge from clusters of GFP+ cells. Scale bar, 10 μm. (D) Immunostaining for Amt (magenta, D1) and GFP (green, D2) on antennal sections from Ir64a>GFP flies. D3, merged image. Scale bar, 10 μm. (E) Pseudocolored heat maps of calcium responses in the ac1 region (dotted circle) of the antenna (solid outline) of Rh50>GCaMP7s flies to either water or 0.1% ammonia. Scale bars, 30 μm. (F) Similar to (E) but acquired at a different depth and location to focus on the sacculus region (dotted circle). Scale bars, 30 μm. (G) Traces of the mean calcium responses (black) ± SEM (gray) in the ac1 region. Arrowheads indicate time when the 250 ms odor stimulus was applied (n=6-7 flies). (H) Dose-response curve of the peak ac1 calcium responses. (I and J) Similar to G and H, except for the sacculus region. (K) T-maze assay schematic showing the elevator in the lower position with flies moving between the odor and solvent arms. The loading tube is above and is accessible with the elevator in the upper position. (L and M) Preference indices of Rh50>DTA, UAS-DTA and Rh50-GAL4 flies when given the choice between ammonia and water (L) or between benzaldehyde and paraffin oil (M). Each dot represents one assay (n=26-35 ammonia, n=9-12 benzaldehyde). See also Figure S2.
Figure 4.
Figure 4.. Amt transporter serves as an olfactory receptor for ammonia
(A-D) Confocal images of antennal sections labeled with an antisense probe for Rh50 (magenta) and an antibody against GFP (green) driven by Ir25a-GAL4 (A), Ir76b-GAL4 (B), Ir8a-GAL4 (C), or Orco-GAL4 (D). Scale bars, 10 μm. (E) Action potential responses to 0.1% ammonia in ac1 sensilla in control flies and Ir25a2 mutants (n=10 sensilla). (F and G) Action potential responses to ammonia in ac1 sensilla in Rh501 (F) and Amt1 (G) mutants (blue) and control flies (black). Left, representative traces of response to 0.1% ammonia. Right, dose-response curves (n=8-10 sensilla). (H) Left, antennal lobe calcium responses to water and 0.01% ammonia in axon termini of Ir75d>GCaMP6s flies, with (purple) and without (black) ectopic expression of Amt. Purple lines are responses in individual flies, and black lines are mean responses. Right, quantification of peak responses (n=5 and 7 flies). (I) Action potentials elicited by ammonia in ac2 sensilla in Ir75a>Amt (crimson), Ir75a-GAL4 (grey) and UAS-Amt (black) flies. Left, sample traces of 1% ammonia responses. Right, dose-response curves (n=7-9 sensilla). (J) Action potentials elicited by ammonia in ab3 sensilla in Or22a>Amt (crimson) and Or22a-GAL4 (black) flies. Left, sample traces of 1% ammonia responses. Right, dose-response curves (n=9-11 sensilla). (K) Similar to (I), except Ir75a>AgAmt (crimson) and UAS-AgAmt (black) flies (n=7-8 sensilla). See also Figure S3.

References

    1. Mumcuoglu Y, Galun R, and Ikan R (1986). The aggregation response of human body louse (Pediculus humanus)(Insecta: Anoplura) to its excretory products. Int. J.Trop. Insect Sci. 7, 629–632.
    1. Takken W, and Knols BGJ (2010). Olfaction in Vector-Host Interactions, Volume 2, (Wageningen, The Netherlands: Wageningen Academic Publishers; ).
    1. Andrade AJ, Andrade MR, Dias ES, Pinto MC, and Eiras AE (2008). Are light traps baited with kairomones effective in the capture of Lutzomyia longipalpis and Lutzomyia intermedia? An evaluation of synthetic human odor as an attractant for phlebotomine sand flies (Diptera: Psychodidae: Phlebotominae). Mem. Inst. Oswaldo Cruz 103, 337–343. - PubMed
    1. Epsky ND, Kendra PE, and Schnell EQ (2014). History and Development of Food-Based Attractants. In Trapping and the Detection, Control, and Regulation of Tephritid Fruit Flies, Shelly T, Epsky N, Jang EB, Reyes-Flores J and Vargas R, eds. (Dordrecht, Netherlands: Springer; ), pp. 75–118.
    1. Min S, Ai M, Shin SA, and Suh GS (2013). Dedicated olfactory neurons mediating attraction behavior to ammonia and amines in Drosophila. Proc. Natl. Acad. Sci. USA 110, E1321–1329. - PMC - PubMed

Publication types

LinkOut - more resources