

Polygenic prediction of atopic dermatitis improves with atopic training and filaggrin factors
- PMID: 34111454
- PMCID: PMC8973457
- DOI: 10.1016/j.jaci.2021.05.034
Polygenic prediction of atopic dermatitis improves with atopic training and filaggrin factors
Abstract
Background: While numerous genetic loci associated with atopic dermatitis (AD) have been discovered, to date, work leveraging the combined burden of AD risk variants across the genome to predict disease risk has been limited.
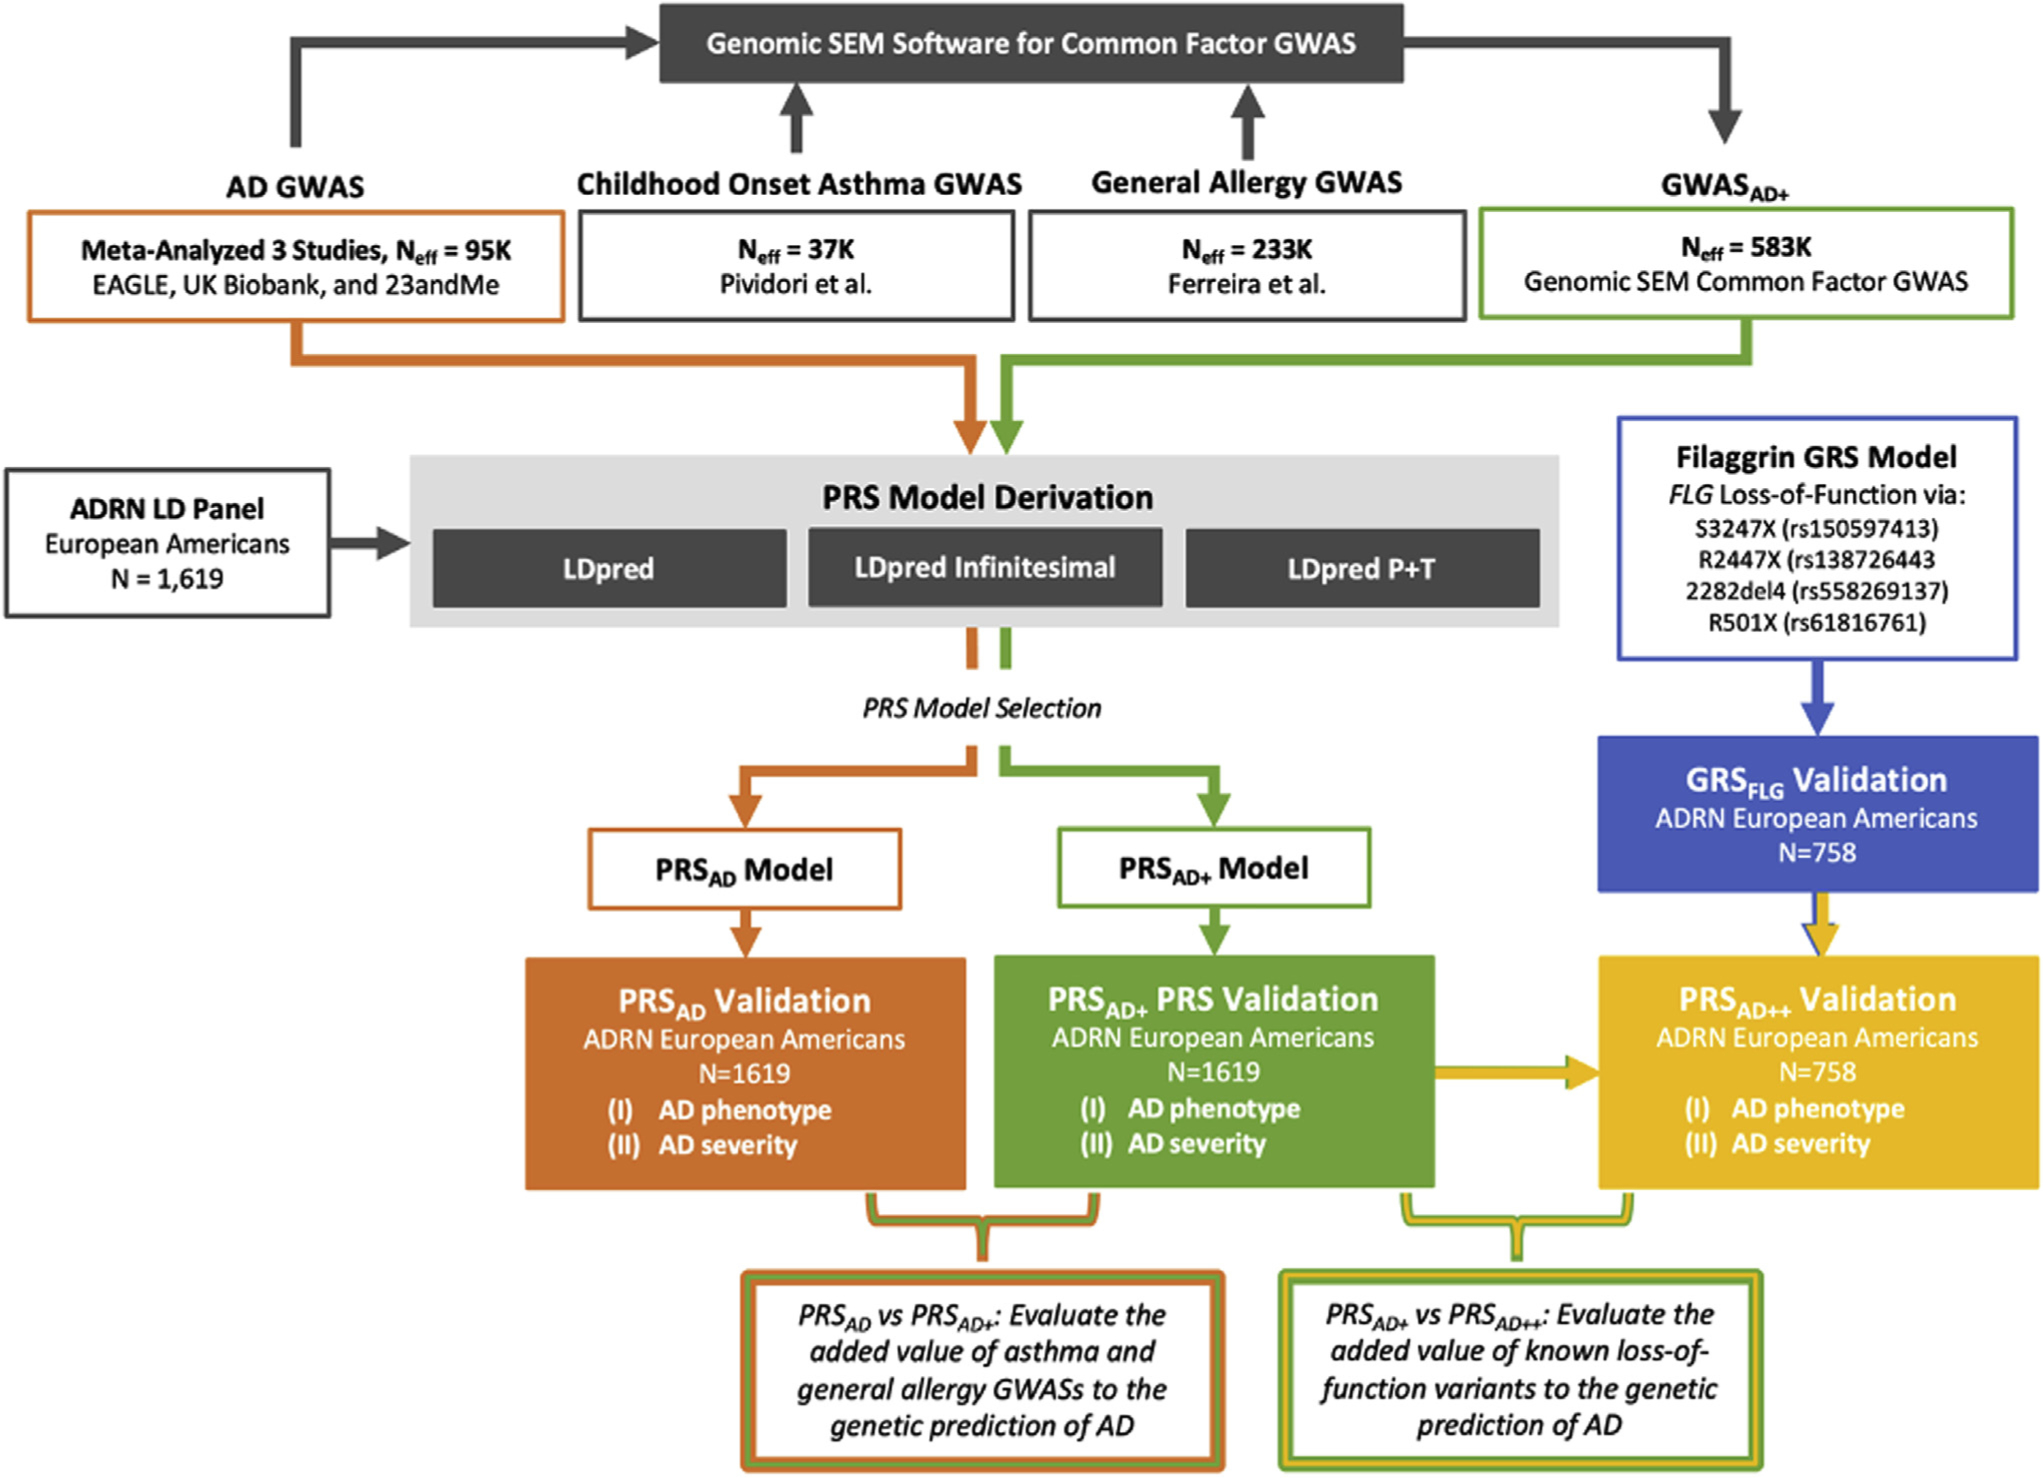
Objectives: This study aims to determine whether polygenic risk scores (PRSs) relying on genetic determinants for AD provide useful predictions for disease occurrence and severity. It also explicitly tests the value of including genome-wide association studies of related allergic phenotypes and known FLG loss-of-function (LOF) variants.
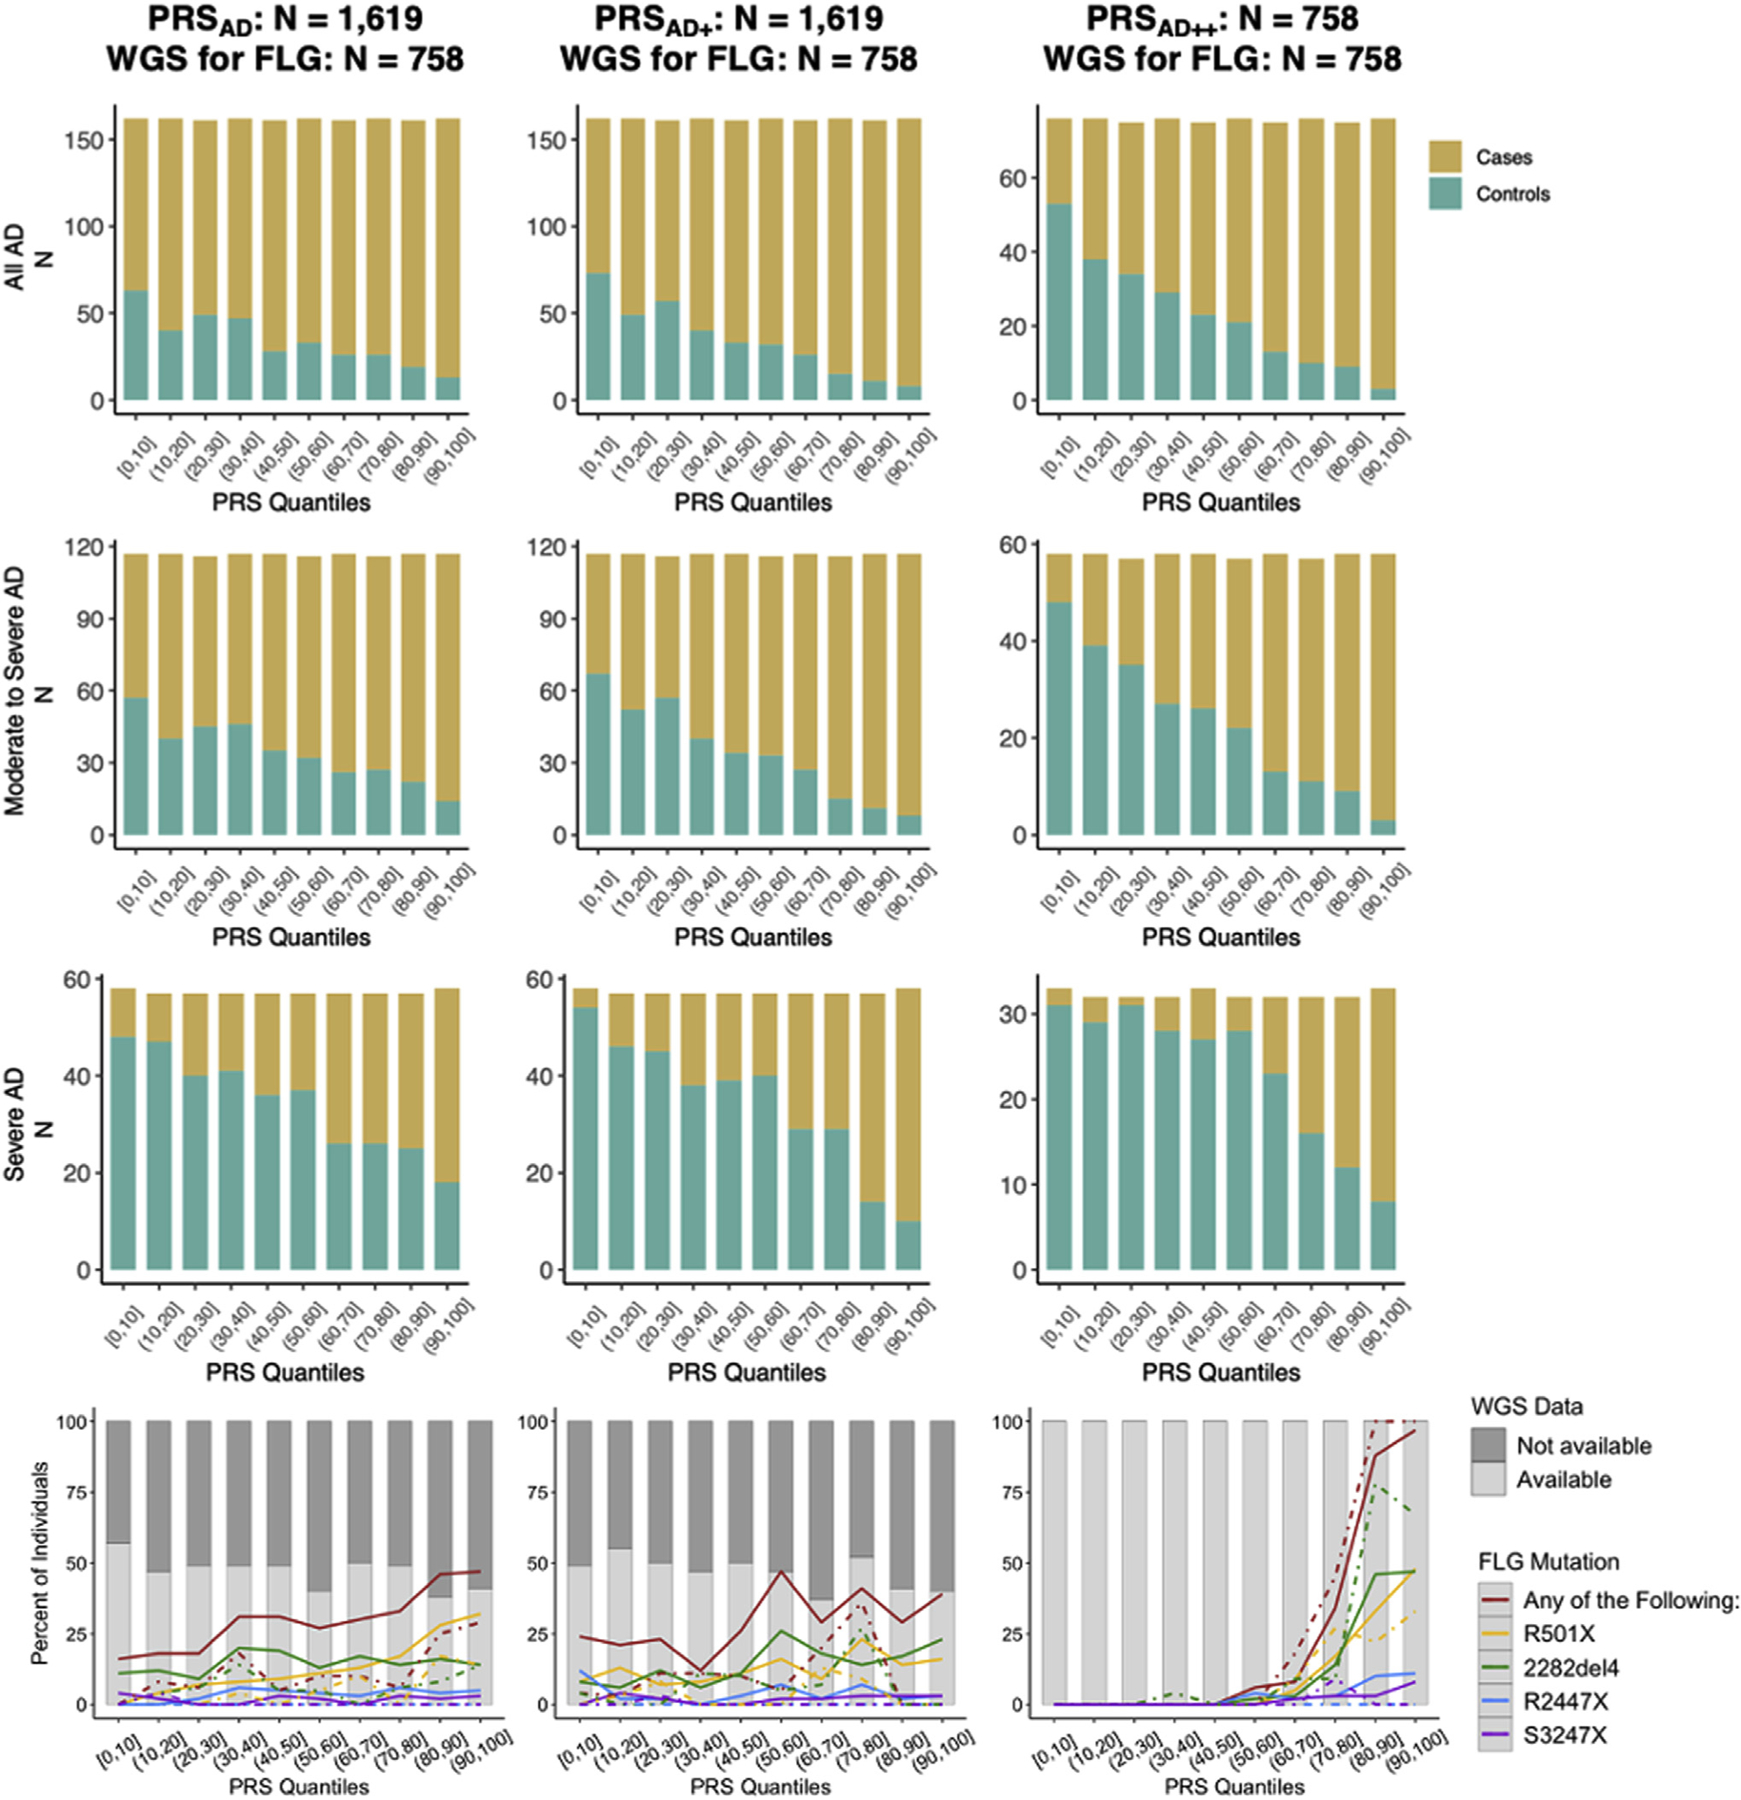
Methods: AD PRSs were constructed for 1619 European American individuals from the Atopic Dermatitis Research Network using an AD training dataset and an atopic training dataset including AD, childhood onset asthma, and general allergy. Additionally, whole genome sequencing data were used to explore genetic scoring specific to FLG LOF mutations.
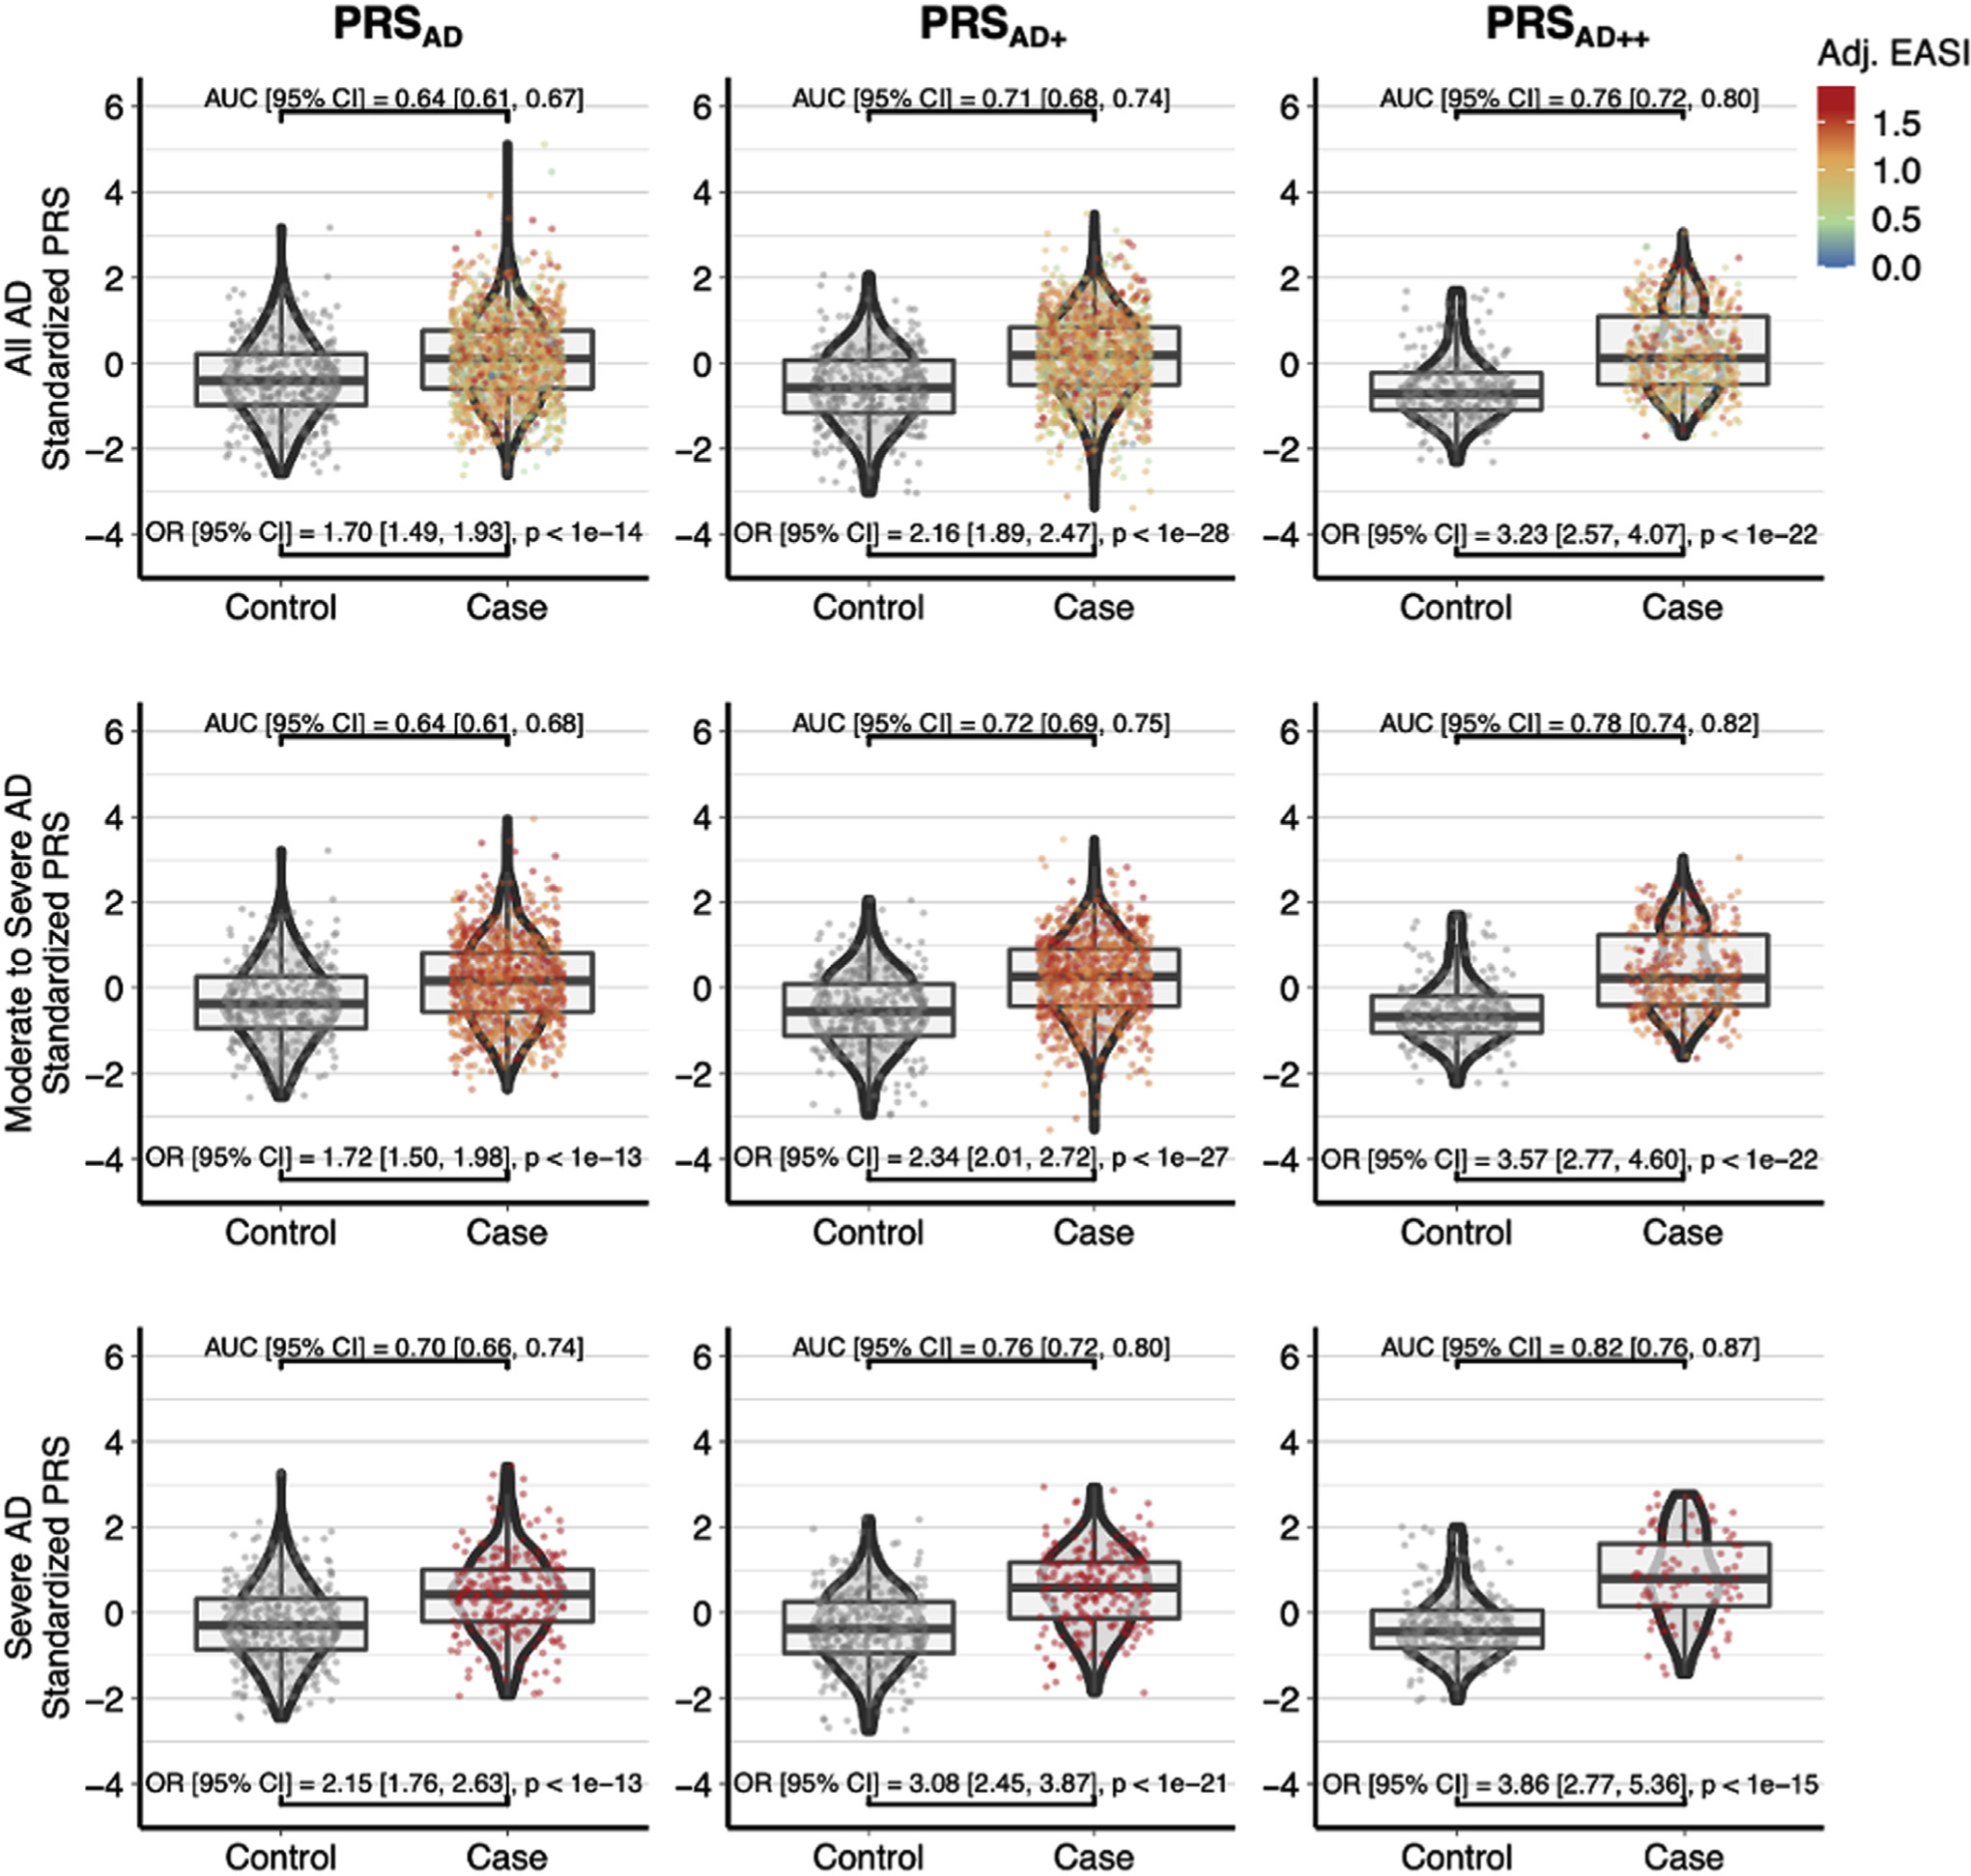
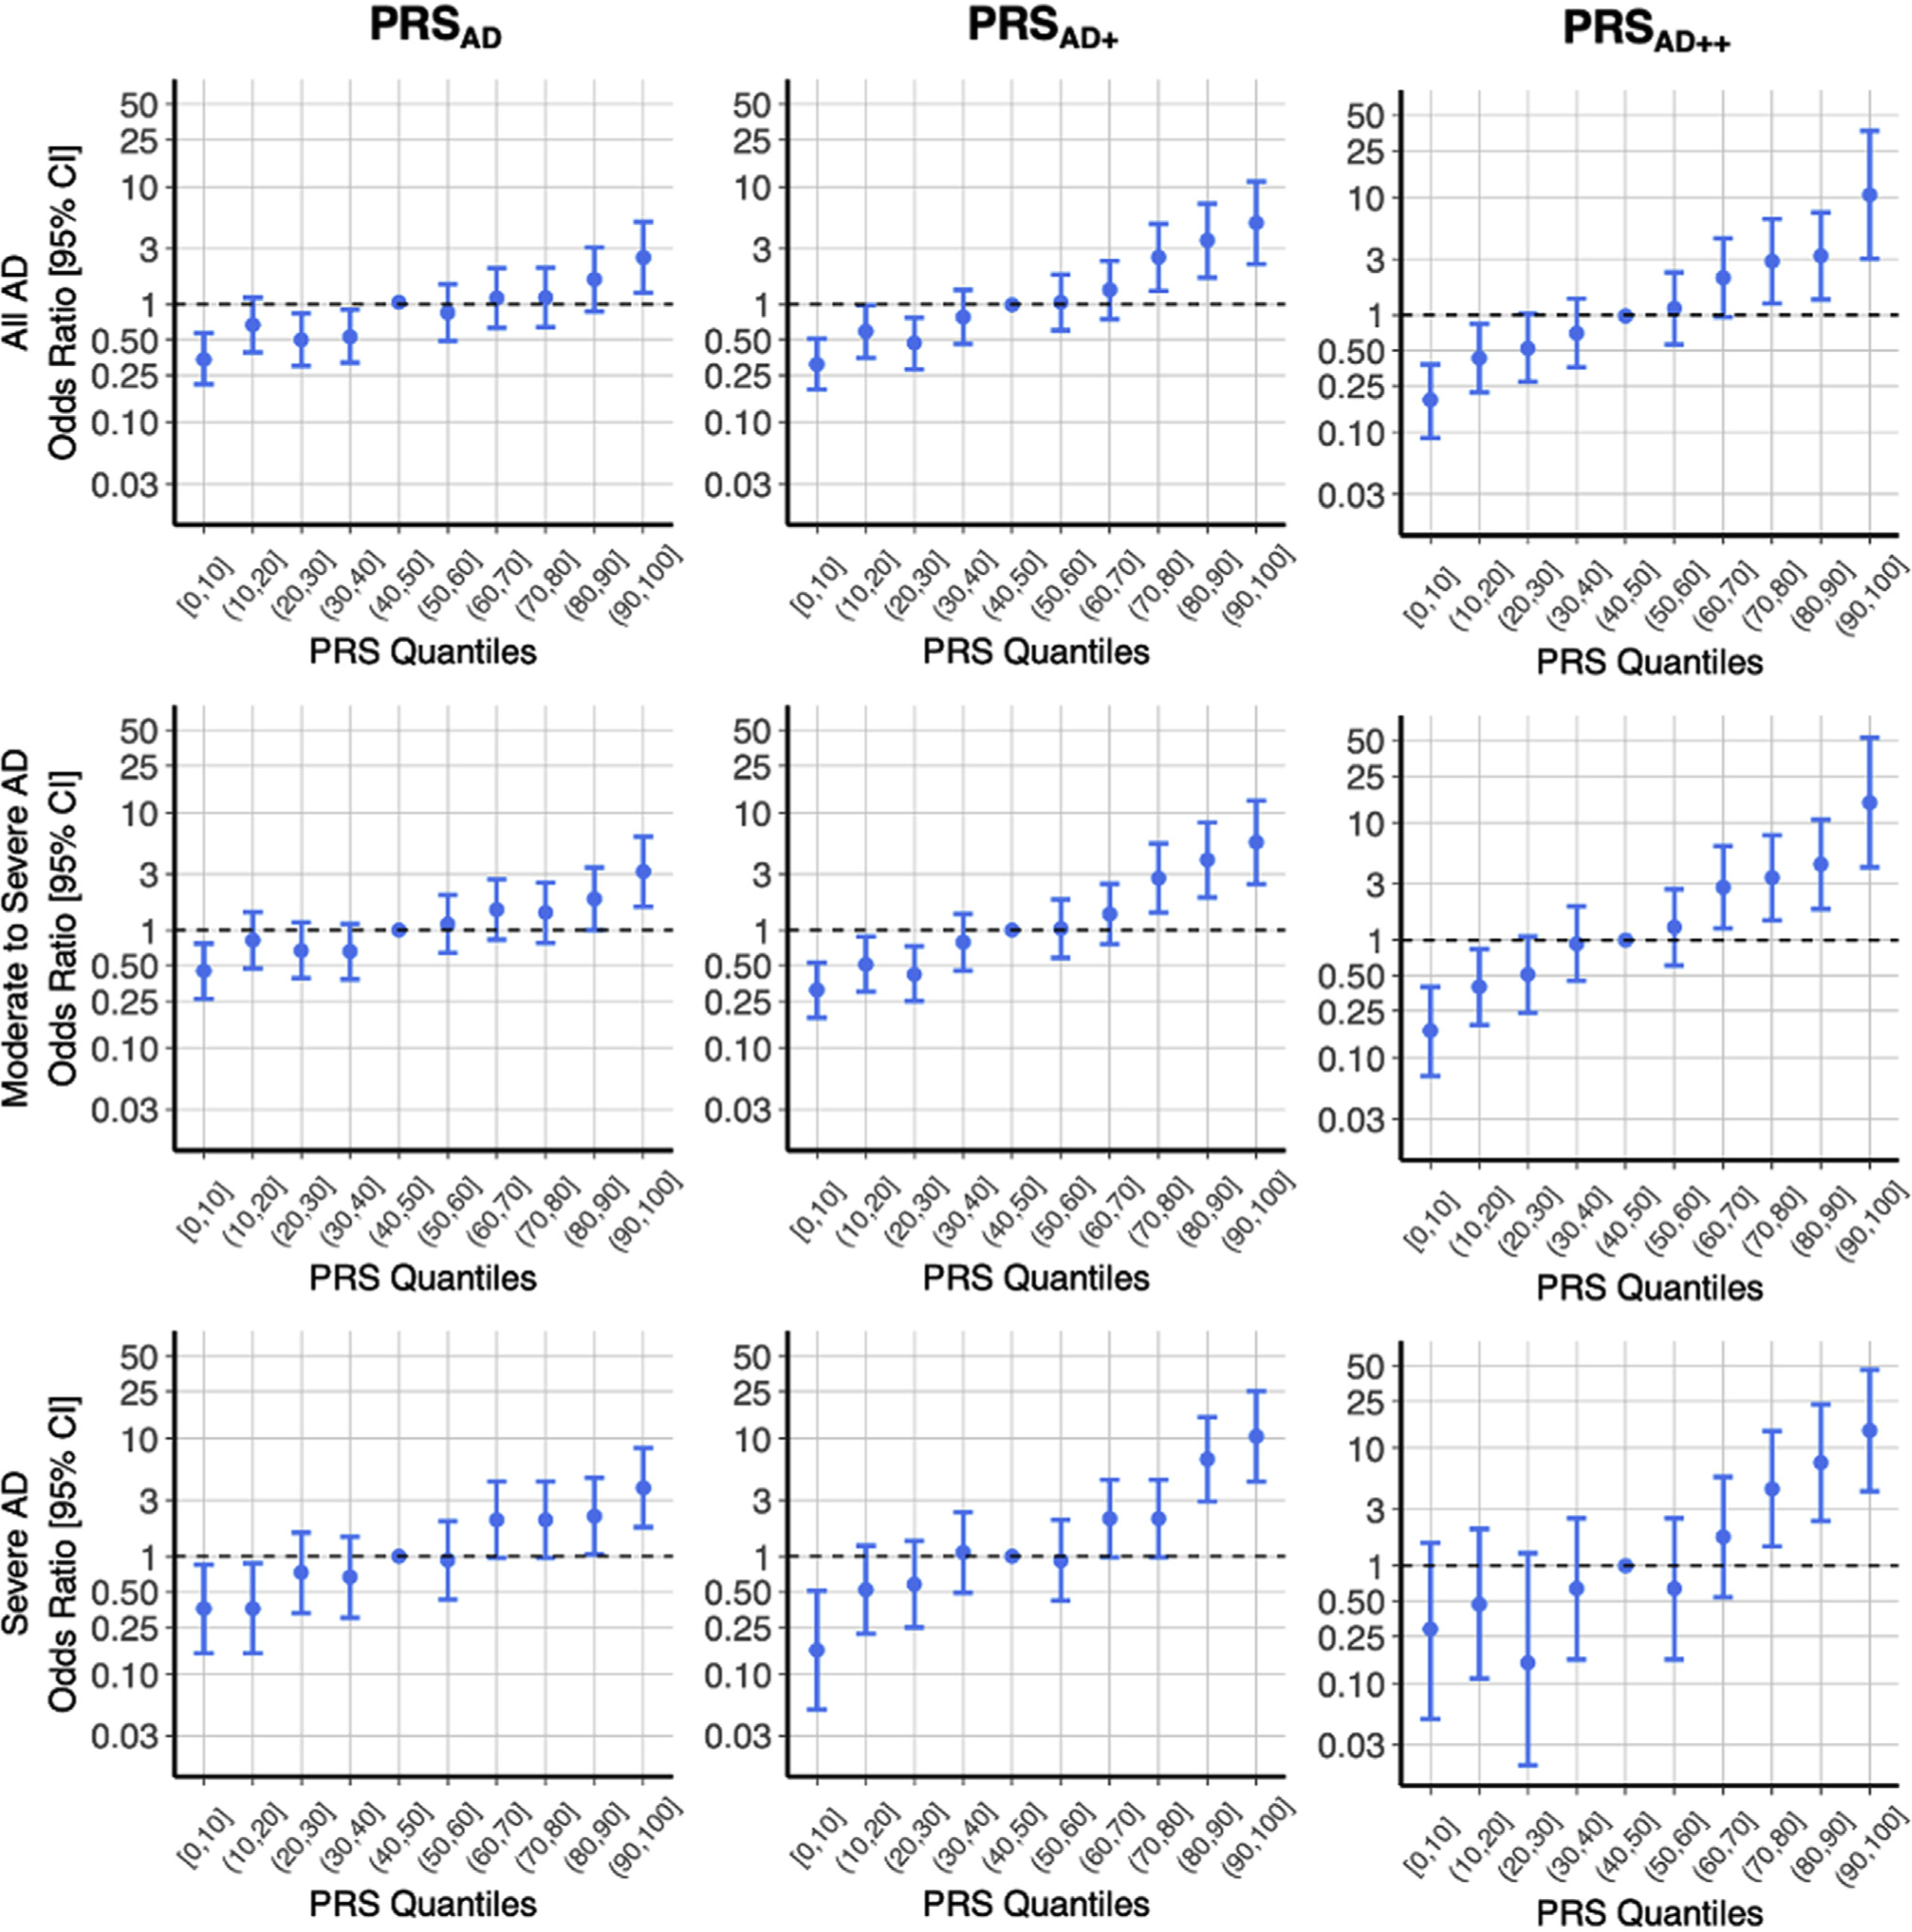
Results: Genetic scores derived from the AD-only genome-wide association studies were predictive of AD cases (PRSAD: odds ratio [OR], 1.70; 95% CI, 1.49-1.93). Accuracy was first improved when PRSs were built off the larger atopy genome-wide association studies (PRSAD+: OR, 2.16; 95% CI, 1.89-2.47) and further improved when including FLG LOF mutations (PRSAD++: OR, 3.23; 95% CI, 2.57-4.07). Importantly, while all 3 PRSs correlated with AD severity, the best prediction was from PRSAD++, which distinguished individuals with severe AD from control subjects with OR of 3.86 (95% CI, 2.77-5.36).
Conclusions: This study demonstrates how PRSs for AD that include genetic determinants across atopic phenotypes and FLG LOF variants may be a promising tool for identifying individuals at high risk for developing disease and specifically severe disease.
Keywords: Atopic dermatitis; allergic disease; atopic march; disease prediction; filaggrin; genetic architecture; genetic predisposition; polygenic risk score.
Copyright © 2021. Published by Elsevier Inc.
Figures
Similar articles
-
Filaggrin loss-of-function variants are associated with atopic dermatitis phenotypes in a diverse, early-life prospective cohort.JCI Insight. 2024 Apr 2;9(9):e178258. doi: 10.1172/jci.insight.178258. JCI Insight. 2024. PMID: 38564302 Free PMC article.
-
Tiled array-based sequencing identifies enrichment of loss-of-function variants in the highly homologous filaggrin gene in African-American children with severe atopic dermatitis.Exp Dermatol. 2018 Sep;27(9):989-992. doi: 10.1111/exd.13691. Epub 2018 Jun 28. Exp Dermatol. 2018. PMID: 29791750 Free PMC article.
-
Uncommon Filaggrin Variants Are Associated with Persistent Atopic Dermatitis in African Americans.J Invest Dermatol. 2018 Jul;138(7):1501-1506. doi: 10.1016/j.jid.2018.01.029. Epub 2018 Feb 8. J Invest Dermatol. 2018. PMID: 29428354 Free PMC article.
-
What is the evidence for interactions between filaggrin null mutations and environmental exposures in the aetiology of atopic dermatitis? A systematic review.Br J Dermatol. 2020 Sep;183(3):443-451. doi: 10.1111/bjd.18778. Epub 2020 Feb 11. Br J Dermatol. 2020. PMID: 31794059 Free PMC article.
-
Genetics in Atopic Dermatitis: Historical Perspective and Future Prospects.Acta Derm Venereol. 2020 Jun 9;100(12):adv00163. doi: 10.2340/00015555-3513. Acta Derm Venereol. 2020. PMID: 32412647 Free PMC article. Review.
Cited by
-
Recent progress in the genetic and epigenetic underpinnings of atopy.J Allergy Clin Immunol. 2023 Jan;151(1):60-69. doi: 10.1016/j.jaci.2022.10.027. J Allergy Clin Immunol. 2023. PMID: 36608983 Free PMC article. Review.
-
Intrinsic Effects of Exposome in Atopic Dermatitis: Genomics, Epigenomics and Regulatory Layers.J Clin Med. 2023 Jun 12;12(12):4000. doi: 10.3390/jcm12124000. J Clin Med. 2023. PMID: 37373692 Free PMC article. Review.
-
Novel insights into atopic dermatitis.J Allergy Clin Immunol. 2023 May;151(5):1145-1154. doi: 10.1016/j.jaci.2022.10.023. Epub 2022 Nov 22. J Allergy Clin Immunol. 2023. PMID: 36428114 Free PMC article. Review.
-
Several Proinflammatory Genes' Variability and Phenotypes of Atopic Dermatitis in Czech Adult AD Patients.Genes (Basel). 2025 Jun 12;16(6):703. doi: 10.3390/genes16060703. Genes (Basel). 2025. PMID: 40565595 Free PMC article.
-
Possible Crosstalk and Alterations in Gut Bacteriome and Virome in HIV-1 Infection and the Associated Comorbidities Related to Metabolic Disorder.Viruses. 2025 Jul 16;17(7):990. doi: 10.3390/v17070990. Viruses. 2025. PMID: 40733607 Free PMC article. Review.
References
-
- Hanifin JM, Reed ML, Prevalence E, Group IW. A population-based survey of eczema prevalence in the United States. Dermatitis 2007;18:82–91. - PubMed
-
- Drucker AM, Wang AR, Li W-Q, Sevetson E, Block JK, Qureshi AA. The burden of atopic dermatitis: summary of a report for the National Eczema Association. J Invest Dermatol 2017;137:26–30. - PubMed
-
- Bickers DR, Lim HW, Margolis D, Weinstock MA, Goodman C, Faulkner E, et al. The burden of skin diseases: 2004: a joint project of the American Academy of Dermatology Association and the Society for Investigative Dermatology. J Am Acad Dermatol 2006;55:490–500. - PubMed
