. 2021 Oct 1:517:66-77.
doi: 10.1016/j.canlet.2021.05.031. Epub 2021 Jun 8.

KRAS-dependent cancer cells promote survival by producing exosomes enriched in Survivin

Affiliations

KRAS-dependent cancer cells promote survival by producing exosomes enriched in Survivin

Wen-Hsuan Chang et al. Cancer Lett. .

Abstract

Mutations in KRAS frequently occur in human cancer and are especially prevalent in pancreatic ductal adenocarcinoma (PDAC), where they have been shown to promote aggressive phenotypes. However, targeting this onco-protein has proven to be challenging, highlighting the need to further identify the various mechanisms used by KRAS to drive cancer progression. Here, we considered the role played by exosomes, a specific class of extracellular vesicles (EVs) derived from the endocytic cellular trafficking machinery, in mediating the ability of KRAS to promote cell survival. We found that exosomes isolated from the serum of PDAC patients, as well as from KRAS-transformed fibroblasts and pancreatic cancer cells, were all highly enriched in the cell survival protein Survivin. Exosomes containing Survivin, upon engaging serum-starved cells, strongly enhanced their survival. Moreover, they significantly compromised the effectiveness of the conventional chemotherapy drug paclitaxel, as well as a novel therapy that combines an ERK inhibitor with chloroquine, which is currently in clinical trials for PDAC. The survival benefits provided by oncogenic KRAS-derived exosomes were markedly reduced when depleted of Survivin using siRNA or upon treatment with the Survivin inhibitor YM155. Taken together, these findings demonstrate how KRAS mutations give rise to exosomes that provide a unique form of intercellular communication to promote cancer cell survival and therapy resistance, as well as raise interesting possibilities regarding their potential for serving as therapeutic targets and diagnostic markers for KRAS-dependent cancers.

Keywords: Exosome; Extracellular vesicle; KRAS; Pancreatic cancer; Survivin.


Conflict of interest statement

Declaration of competing interest

C.J.D. is a consultant/advisory board member for Anchiano Therapeutics, Deciphera Pharmaceuticals and Mirati Therapeutics. C.J.D. has received research funding support from SpringWorks Therapeutics, Mirati Therapeutics and Deciphera Pharmaceuticals, and has consulted for Eli Lilly, Jazz Therapeutics, Revolution Medicines, Ribometrix, Sanofi, and Turning Point Therapeutics.

Figures

Figure 1.
Figure 1.. Serum exosomes isolated from PDAC patients contain Survivin.
(A) The procedure used to isolate exosomes from serum samples. (B) Western blots of exosomes isolated from serum samples taken from 5 non-PDAC patients and 13 PDAC patients. The blots were probed for Survivin (top panels) and Flotillin-2 (bottom panels). (C) Quantification of Survivin expression levels detected in the samples shown in (B). The level of Survivin in each sample was normalized to Flotillin-2 expression. The data shown in (C) represents the mean ± standard error. Statistical significance was determined using a Student’s t-test; * p < 0.05.
Figure 2.
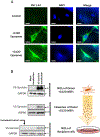
Figure 2.. MEFs expressing HA-KRASG12D have transformed characteristics.
(A) Western blot analysis using an HA antibody was performed on MEFs expressing an inducible form of HA-KRASG12D (whole cell lysates; WCL) that is under the control of doxycycline (Dox). Actin was used as the loading control. (B) Immunofluorescence using an HA antibody was performed on the cells described in (A). The control MEFs (−G12D), and MEFs expressing KRASG12D (+G12D), were also stained with DAPI to label nuclei. The scale bars are 25 μm. (C) Images of the soft agar assays performed on control MEFs (−G12D), and MEFs expressing HA-KRASG12D (+G12D). The scale bars are 50 μm. (D) Quantification of the soft agar assays shown in (C). (E) Cell survival assays using trypan blue were performed on serum starved control MEFs (−G12D), and MEFs expressing HA-KRASG12D (+G12D). The data shown in (D) and (E) represent the mean ± standard error. All experiments were performed a minimum of three independent times, and statistical significance was determined using Student’s t-tests; *** p < 0.001 and **** p < 0.0001.
Figure 3.
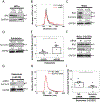
Figure 3.. MEFs expressing activated KRAS generate exosomes enriched in Survivin.
(A) NTA was performed on the conditioned medium collected from an equivalent number of control MEFs (−G12D, red line), and MEFs expressing HA-KRASG12D (+G12D, black line), to determine the number and sizes of EVs in each sample. The solid lines represent means, and the shaded areas denote standard errors. (B) Electron microscopy (EM) images of the conditioned medium samples described in (A). The scale bars are 50 nm. (C) The procedure used to isolate exosomes from conditioned medium. (D) Western blot analysis using antibodies that recognize the general EV markers Flotillin-2 and HSP90, the exosome marker CD81, and the cell-specific marker IκBα, was performed on the KRASG12D expressing MEFs (WCL) and the exosomes (EXO) and MVs these cells produce. (E) Western blot analysis using HA and Survivin antibodies was performed on control MEFs (−G12D), and MEFs expressing HA-KRASG12D (+G12D). GAPDH was used as the loading control. The relative expression levels of Survivin were quantified and included below the blot. (F) Western blot analysis using a Survivin antibody was performed on the exosomes isolated from the cells described in (E). HSP90 was used as the loading control. The relative expression levels of Survivin were quantified and included below the blot. (G) Western blot analysis using V5 and HA antibodies were performed on control MEFs (−G12D), and MEFs expressing KRASG12D (+G12D), that had been transfected with V5-Survivin. GAPDH was used as the loading control. (H) Western blot analysis using a V5 antibody was performed on the exosomes isolated from the cells described in (G). HSP90 was used as the loading control.
Figure 4.
Figure 4.. The exosomes from MEFs expressing activated KRAS can be transferred to other cells.
(A) Fluorescence images of pMEFs that had been left untreated (Control), or were treated with FM 1-43FX labeled exosomes isolated from control MEFs (−G12D Exosomes), and MEFs expressing HA-KRASG12D (+G12D Exosomes). The cells were also stained with DAPI to label nuclei. The scale bars are 25 μm. (B) Western blot analysis using a V5 antibody was performed on MEFs expressing KRASG12D that had been mock transfected or transfected with V5-Survivin (top panels labelled WCLs of Donor +G12D MEFs). Two batches of exosomes were collected from these cells. Western blot analysis using a V5 antibody was performed on one batch of exosomes that had been lysed (middle panels labelled Exosomes of Donor +G12D MEFs), while the second batch was resuspended in PBS and then used to treat pMEFs for two hours, at which point the cells were lysed and blotted with a V5 antibody. Untreated pMEFs were used as a control (bottom panels labelled WCLs of recipient cells). GAPDH and HSP90 were used as loading controls. The experimental procedure is depicted to the right.
Figure 5.
Figure 5.. The exosomes produced by MEFs expressing HA-KRASG12D promote cell survival.
(A) Western blot analysis using a caspase 3 antibody was performed on pMEFs that had been maintained in serum-free medium supplemented with nothing, exosomes isolated from either control MEFs (−G12D) or MEFs expressing KRASG12D (+G12D), or 5% fetal bovine serum (FBS) for 24 hours. Vinculin was used as the loading control. The relative expression levels of cleaved caspase 3 were quantified and included below the blot. (B) Cell survival assays using trypan blue were performed on pMEFs that had been maintained for 36 hours in medium containing 5% FBS, or lacking serum (Serum starved). (C) Cell survival assays using trypan blue were performed on serum starved pMEFs that had been treated with exosomes isolated from control MEFs (−G12D), or MEFs expressing KRASG12D (+G12D). The findings shown represent the increases in cell survival determined for each condition, compared to untreated serum starved pMEFs. (D) Western blot analysis using a Survivin antibody was performed on MEFs expressing KRASG12D that had been treated with negative control siRNA (NC) or Survivin siRNA. GAPDH was used as the loading control. The relative expression levels of Survivin were quantified and included below the blot. (E) NTA analysis was performed on the conditioned medium collected from an equivalent number of the cells described in (D). The solid lines represent means, and the shaded areas denote standard errors. (F) Western blot analysis using a Survivin antibody was performed on the exosomes derived from the cells described in (D). HSP90 was used as the loading control. The relative expression levels of Survivin were quantified and included below the blot. (G) Cell survival assays using trypan blue were performed on serum starved pMEFs that had been treated with the exosomes isolated from HA-KRASG12D expressing MEFs transfected with negative control siRNA (NC siRNA) or Survivin siRNA. The findings shown represent the increases in cell survival determined for each condition, compared to untreated serum starved pMEFs. The data shown in (B), (C), (E), and (G) represent the mean ± standard error. All experiments were performed a minimum of three independent times, and statistical significance was determined using Student’s t-tests; * p < 0.05, ** p < 0.01, and **** p < 0.0001.
Figure 6.
Figure 6.. KRAS-dependent PDAC cells also produce exosomes enriched in Survivin.
(A) Western blot analysis using a RAS antibody was performed on AK192 cells engineered to express an inducible form of KRASG12D that is under the control of doxycycline (Dox). GAPDH was used as the loading control. (B) NTA was performed on the conditioned medium collected from an equivalent number of AK192 cells not expressing (−G12D, red line), or expressing (+G12D, black line), KRASG12D. The solid lines represent means, and the shaded areas denote standard errors. (C) Western blot analysis using RAS and Survivin antibodies was performed on AK192 cells (WCL) not expressing (−G12D), or expressing (+G12D), KRASG12D. GAPDH was used as the loading control. The relative expression levels of Survivin were quantified and included below the blot. (D) Western blot analysis using a Survivin antibody was performed on the exosomes isolated from the cells described in (C). HSP90 was used as the loading control. The relative expression levels of Survivin were quantified and included below the blot. (E) Cell survival assays using trypan blue were performed on serum starved pMEFs that had been treated with exosomes isolated from AK192 cells not expressing (−G12D), or expressing (+G12D), KRASG12D. The findings shown represent the increases in cell survival determined for each condition, compared to untreated serum starved pMEFs. (F) Western blot analysis using RAS and Survivin antibodies were performed on AK192 cells expressing KRASG12D that had been treated with negative control siRNA (NC) or Survivin siRNA. GAPDH was used as the loading control. The relative expression levels of Survivin were quantified and included below the blot. (G) Western blot analysis using a Survivin antibody was performed on the exosomes isolated from the cells described in (F). HSP90 was used as the loading control. The relative expression levels of Survivin were quantified and included below the blot. (H) NTA was performed on the conditioned medium collected from an equivalent number of AK192 cells expressing KRASG12D that had been treated with negative control siRNA (NC siRNA) or Survivin siRNA. The solid lines represent means, and the shaded areas denote standard errors. (I) Cell survival assays using trypan blue were performed on serum starved pMEFs treated with the exosomes derived from KRASG12D expressing AK192 cells that had been treated with negative control siRNA (NC siRNA) or Survivin siRNA. The findings shown represent the increases in cell survival determined for each condition, compared to untreated serum starved pMEFs. The data shown in (B), (E), (H), and (I) represent the mean ± standard error. All experiments were performed a minimum of three independent times, and statistical significance was determined using Student’s t-tests; * p < 0.05.
Figure 7
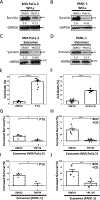
Figure 7. Exosomal Survivin induces drug resistance in human PDAC cells.
(A and B) Western blot analysis using a Survivin antibody was performed on (A) MIA PaCa-2 and (B) PANC-1 cells that had been treated with DMSO, or 0.25 μM YM155. GAPDH was used as the loading control. The relative expression levels of Survivin were quantified and included below this blot. (C and D) Western blot analysis using a Survivin antibody was performed on the exosomes isolated from the cells described in (A and B). HSP90 was used as the loading control. The relative expression levels of Survivin were quantified and included below this blot. (E and F) Cell survival assays using trypan blue were performed on BxPC-3 cells that had been treated for 36 hours with (E) DMSO and 0.30 μM paclitaxel (PTX), or (F) DMSO and the combination therapy of 1.0 μM SCH772984 and 6.3 μM chloroquine (SCH+CQ). (G and H) Cell survival assays using trypan blue were performed on BxPC-3 cells that had been treated for 36 hours with (G) DMSO and 0.30 μM paclitaxel, or (H) DMSO and the combination therapy of 1.0 μM SCH772984 and 6.3 μM chloroquine (SCH+CQ), and exosomes isolated from MIA PaCa-2. The plots represent the increases in cell survival determined for each condition, compared to BxPC-3 treated with only 0.30 μM paclitaxel, or the combination therapy. (I and J) Cell survival assays using trypan blue were performed on BxPC-3 cells that had been treated for 36 hours with (I) DMSO and 0.30 μM paclitaxel, or (J) DMSO and the combination therapy of 1.0 μM SCH772984 and 6.3 μM chloroquine (SCH+CQ), and exosomes isolated from PANC-1. The plots represent the increases in cell survival determined for each condition, compared to BxPC-3 treated with only 0.30 μM paclitaxel, or the combination therapy. The data shown in (E)-(J) represent the mean ± standard error. All experiments were performed a minimum of three independent times, and statistical significance was determined using Student’s t-tests; * p<0.05, *** p < 0.001 and **** p < 0.0001.
Figure 8
Figure 8. Diagram showing how KRAS-dependent PDAC cells produce exosomes that promote survival.
The expression of mutant forms of KRAS (KRASmt) in PDAC cells strongly increases the production of exosomes enriched in Survivin. These exosomes, and the Survivin they contain, can be detected in the serum isolated from PDAC patients (left), transferred to fibroblasts (middle) that reside within the tumor microenvironment, as well as other PDAC cells (right) and promote their survival and drug resistance.

References

    1. Waters AM & Der CJ KRAS: The critical driver and therapeutic target for pancreatic cancer. Cold Spring Harb. Perspect. Med 8, 1–18 (2018). - PMC - PubMed
    1. Simanshu DK, Nissley DV &Mccormick F RAS Proteins and Their Regulators in Human Disease. Cell 170, 17–33 (2017). - PMC - PubMed
    1. Moore AR, Rosenberg SC, McCormick F & Malek S RAS-targeted therapies: is the undruggable drugged? Nat. Rev. Drug Discov 19, 533–552 (2020). - PMC - PubMed
    1. Prior IA, Hood FE & Hartley JL The Frequency of Ras Mutations in Cancer. Cancer Res. 80, 2969–2974 (2020). - PMC - PubMed
    1. Stephen AG, Esposito D, Bagni RG &McCormick F Dragging ras back in the ring. Cancer Cell 25, 272–281 (2014). - PubMed

Publication types

MeSH terms