. 2021;12(4):1311-1327.
doi: 10.1016/j.jcmgh.2021.06.001. Epub 2021 Jun 7.

Lactobacillus rhamnosus GG Orchestrates an Antitumor Immune Response

Affiliations

Lactobacillus rhamnosus GG Orchestrates an Antitumor Immune Response

Joshua A Owens et al. Cell Mol Gastroenterol Hepatol. 2021.

Abstract

Background & aims: In colorectal cancer, approximately 95% of patients are refractory to immunotherapy because of low antitumor immune responses. Therefore, there is an exigent need to develop treatments that increase antitumor immune responses and decrease tumor burden to enhance immunotherapy.

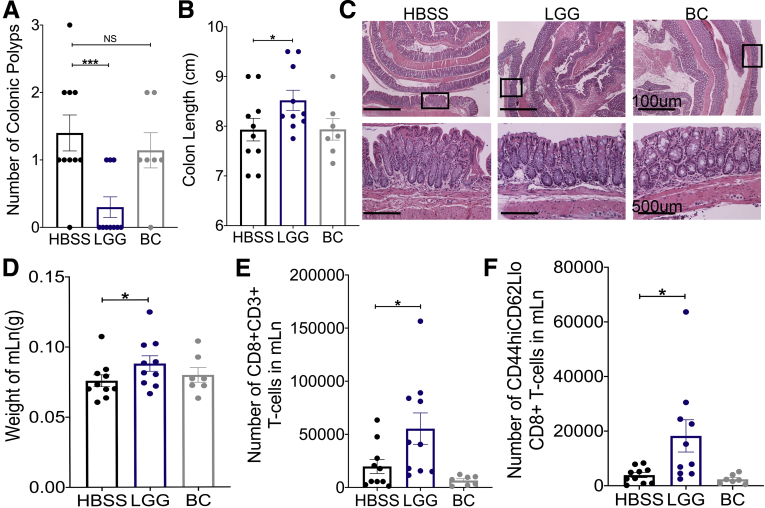
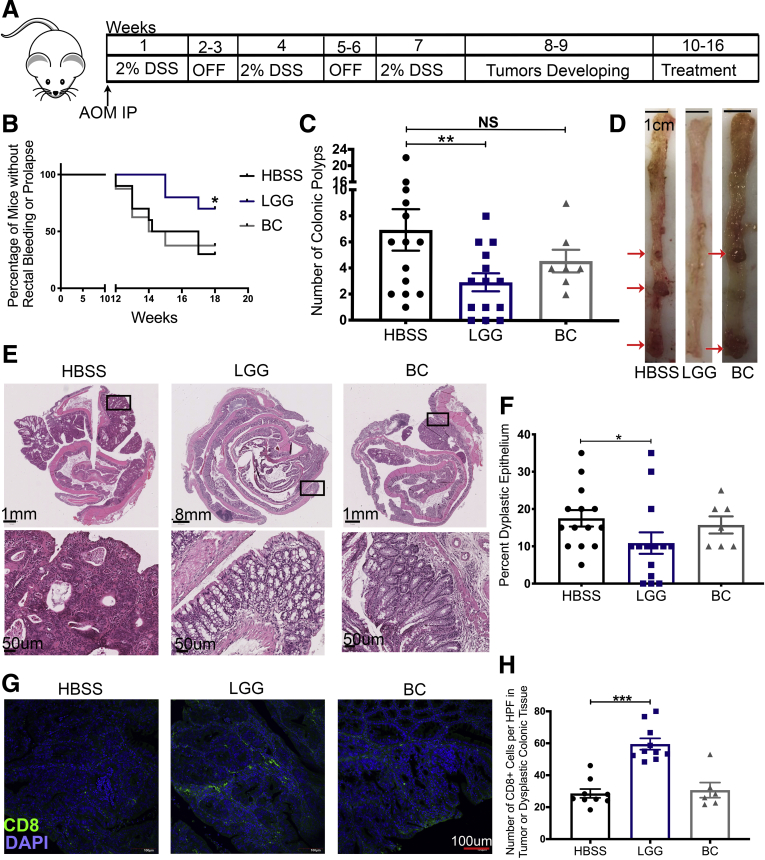
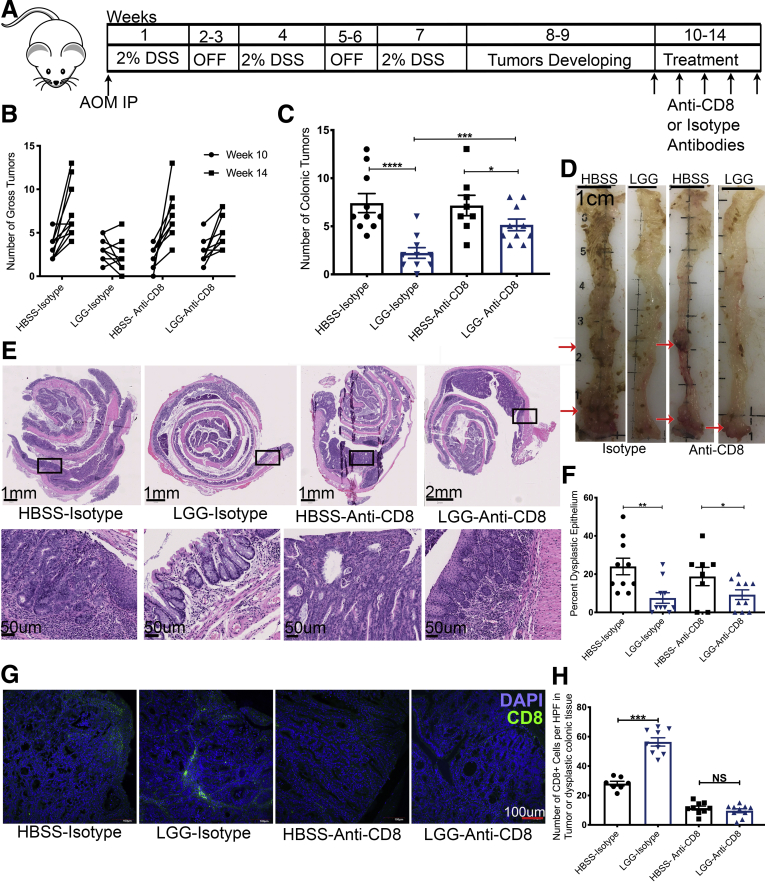
Methods: The gut microbiome has been described as a master modulator of immune responses. We administered the human commensal, Lactobacillus rhamnosus GG (LGG), to mice and characterized the changes in the gut immune landscape. Because the presence of lactobacilli in the gut microbiome has been linked with decreased tumor burden and antitumor immune responses, we also supplemented a genetic and a chemical model of murine intestinal cancer with LGG. For clinical relevance, we therapeutically administered LGG after tumors had formed. We also tested for the requirement of CD8 T cells in LGG-mediated modulation of gut tumor burden.

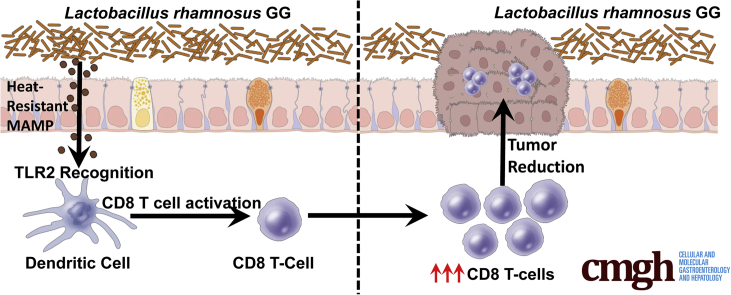
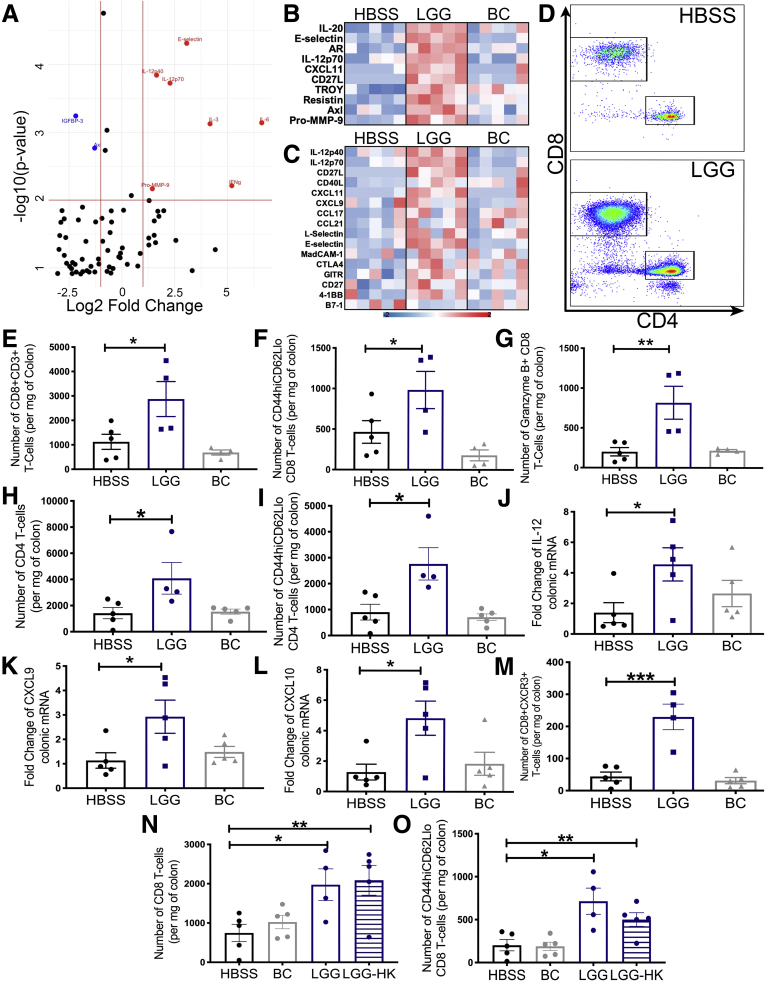
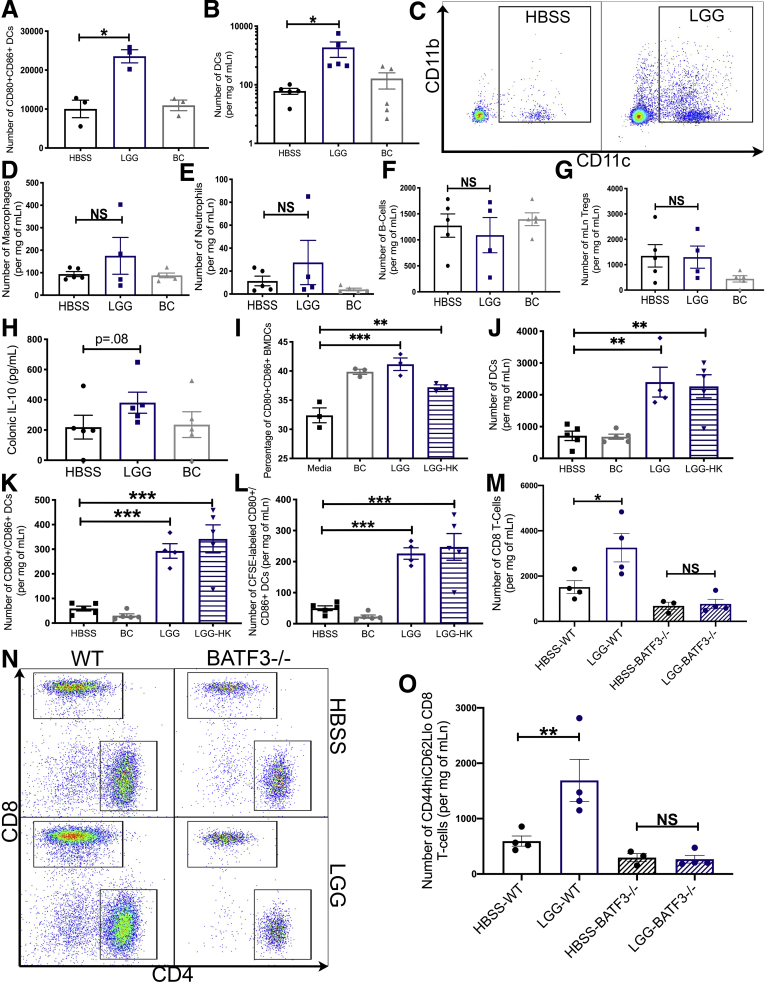
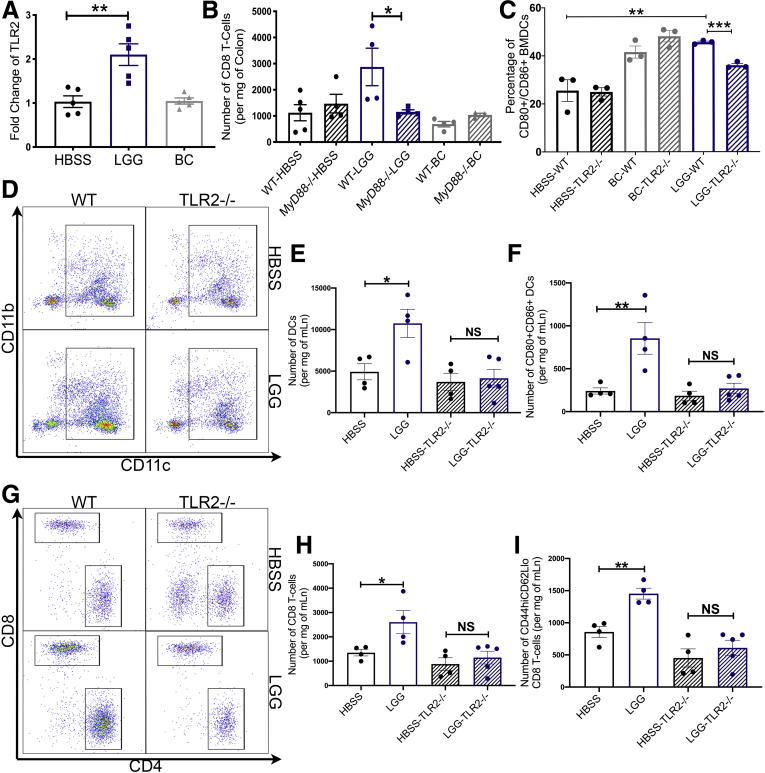
Results: We detected increased colonic CD8 T-cell responses specifically in LGG-supplemented mice. The CD8 T-cell induction was dependent on dendritic cell activation mediated via Toll-like receptor-2, thereby describing a novel mechanism in which a member of the human microbiome induces an intestinal CD8 T-cell response. We also show that LGG decreased tumor burden in the murine gut cancer models by a CD8 T-cell-dependent manner.

Conclusions: These data support the potential use of LGG to augment antitumor immune responses in colorectal cancer patients and ultimately for increasing the breadth and efficacy of immunotherapy.

Keywords: CD8 T Cells; CRC; Cancer; Dendritic Cells; LGG; Microbiome; Probiotics.


Figures

None
Graphical abstract
Figure 1
Figure 1
Lactobacillus rhamnosus GG orchestrates a colonic CD8 T-cell response. (A) Specific pathogen-free C57BL/6J mice were supplemented with HBSS, BC, or LGG, or by oral gavage daily for 2 weeks before colons were harvested and analyzed for protein abundance using the Quantibody Mouse Cytokine Array 4000 (RayBiotech, Inc). A volcano plot representation is shown of cytokines that were significantly more abundant in colonic tissues of LGG-supplemented mice compared with colons of mice supplemented with BC. Axes represent log2 fold change (x-axis) against -log10 (P value) (y-axis). (B) Heatmap representation of the top 10 differentially abundant proteins in LGG mice compared with HBSS-supplemented mice detected in the colonic tissue of mice described in panel A. (C) Heatmap representation of the top 16 differentially expressed immune-mediated proteins detected in the colonic tissue of the 3 groups. (D) Flow cytometry analysis for the detection of immune cells in the colonic epithelium of C57BL/6J mice administered either HBSS, LGG, or BC for 1 week. Representative FCM plots shown of T cells. (E) Quantification of CD8 T cells in panel D. (F) Quantification of effector CD8 T cells in panel D. (G) Quantification of granzyme-B–expressing CD8 T cells in panel D. (H) Quantification of CD4 T cells in panel D. (I) Quantification of effector CD4 T cells. (J) Reverse-transcription PCR analysis for the detection of il-12 transcripts in the colonic tissue of mice in panel D. (K) Detection of cxcl9 transcripts in the colonic tissue of mice in panel D. (L) Detection of cxcl10 transcripts in the colonic tissue of mice in panel D. (M) Quantification of CXCR3+ CD8 T cells for analysis described in panel D. (N) Flow cytometry analysis for the detection of immune cells in the colonic epithelium of C57BL/6J mice administered either HBSS, BC, LGG, or heat-killed (HK) LGG for 1 week. The chart represents quantification of the number of CD8 T cells in the colonic tissues of these mice. (O) Quantification of effector CD8 T cells in mice described in panel L. Statistical significance was tested by 1-way analysis of variance for all experiments. ∗P < .05, ∗∗P < .01, and ∗∗∗P < .001. n = 4/5 for all experiments. mRNA, messenger RNA.
Figure 2
Figure 2
Lactobacillus rhamnosus GG primes and requires DCs for enhanced CD8 T-cell responses. (A) Detection by flow cytometry of the number of CD80+/CD86+ DCs in C57BL/6 mouse BMDCs after incubation with either HBSS, BC, or LGG for 24 hours. (B) Quantification of CD11B+ and CD11C+ DCs in the mLn of C57BL/6J mice supplemented for 1 week with either HBSS, LGG, or BC. (C) Representative flow cytometry analysis chart for experiment described in panel B. (D) Quantification of macrophages in mLn from mice in panel B. (E) Quantification of neutrophils in mLn from mice in panel B. (F) Quantification of B cells in mLn from mice in panel B. (G) Quantification of regulatory T cells in mLn from mice in panel B. (H) Colonic IL10 expression as determined by antibody array from Figure 1A–C. (I) Frequency of CD80+/CD86+ DCs in C57BL/6 mouse BMDCs after incubation with either HBSS, BC, LGG, or heat killed (HK) LGG for 24 hours. (J) Quantification of CD11b and CD11c+ DCs in the mLn of C57BL/6J mice supplemented for 1 week with CFSE-labeled HBSS, BC, LGG, or LGG-HK. (K) Number of CD80+CD86+ DCs in mLn of mice described in panel E. (L) Number of CFSE+CD80+CD86+ DCs in mLn of mice described in panel E. (M) Flow cytometry analysis for the detection of CD8 T cells in the mLn of B6.129S(C)-Batf3tm1Kmm/J (BATF3-/-) or C57BL/6 (WT) mice administered either HBSS or LGG by oral gavage for 1 week. (N) Representative flow cytometry analysis of mice described in panel H. (O) Quantification of effector CD8 T cells of mice described in panel H. Statistical significance was tested by 1-way analysis of variance (ANOVA) for all experiments. ∗P < .05, ∗∗P < .01, and ∗∗∗P < .001. n = 3 for all BMDC experiments. (B) n = 5, (D–L) n = 4/5, and (M–O) n = 3/4. mRNA, messenger RNA.
Figure 3
Figure 3
Lactobacillus rhamnosus GG requires TLR2 signaling for DC priming and activation of CD8 T cells. (A) Reverse-transcription PCR analysis for the detection of tlr-2 transcripts in the colonic tissue of C57BL/6 mice supplemented with HBSS, BC, or LGG, or by oral gavage daily for 2 weeks. (B) Flow cytometry for the detection of CD8 T cells in the colons from C57Bl/6 (WT) or B6.129P2(SJL)-Myd88tm1.1Defr/J (Myd88-/-) mice administered either HBSS, LGG, or BC by oral gavage for 1 week. (C) Detection of CD80+/CD86+ BMDCs derived from either WT (C57BL/6) mice, or from TLR2-/- (B6.129-Tlr2tm1Kir/J) mice after incubation with either HBSS, BC, or LGG for 24 hours. (D) Representative flow cytometry plots from the analysis of mLns from WT (C57BL/6) mice, or from TLR2-/- (B6.129-Tlr2tm1Kir/J) mice supplemented with HBSS or LGG for 1 week. (E) Quantification of DCs in the mLn of mice described in panel C. (F) Number of CD80+CD86+ DCs in mLns of mice described in panel C. (G) Quantification of T cells in mice described in panel C. (H) Quantification of CD8 T cells in mice described in panel C. (I) Quantification of effector CD8 T cells in mice described in panel C. One-way analysis of variance was used for statistical analysis and represented as ∗P < .05, ∗∗P < .01, and ∗∗∗P < .001. (A) n = 5, (C) n = 3; for MyD88-/- and TLR2-/- experiments, n = 4–5.
Figure 4
Figure 4
LGG supplementation decreases colonic tumor burden in a genetic cancer model. (A) Intestinal-specific MSH2 knockout mice were generated by crossing Villin-Cre mice with MSH2loxP until homozygosity. Intestinal-specific MSH2 knockout mice were raised to 7 months of age, whereupon they were supplemented with HBSS, LGG, or BC by oral gavage for 6 weeks. After 6 weeks of supplementation, quantification of tumor burden was determined after removal and opening the colon longitudinally. (B) Colon lengths of mice described in panel A measured from rectum to cecum before removing colonic contents or any other manipulation. (C) H&E sections of Swiss-rolled colonic tissue with representative images of low-powered (upper panels) and high-powered (lower panels) views. Areas within lower panels indicated by rectangle within the upper panels. (D) Weights of mLn in mice described in panel A. (E) Flow cytometry analysis for the detection total CD8 T-cell numbers in mLn of mice described in panel A. (F) Quantification of total effector CD8 T cells from samples described in panel E. One-way analysis of variance was used for statistical significance with ∗P < .05 and ∗∗∗P < .001; n = 10, 10, and 7 for HBSS, LGG, and BC, respectively. Groups were made up of approximately half male and female mice with 5, 5, and 3 male mice for HBSS, LGG, and BC, respectively.
Figure 5
Figure 5
Therapeutic administration of LGG attenuates colonic tumor burden. (A) Graphic representation of the experimental outline for the induction of colonic tumors in C57BL/6 mice. Seven- to 8-week-old male mice were injected with AOM before being subjected to 3 rounds of 1-week exposure to 2% DSS and a 2-week recovery period. After 3 cycles of DSS, and between weeks 8 and 10 of the experiment, tumors begin to form within the colonic epithelium of treated mice. At week 10, groups of mice were supplemented with HBSS, BC, or LGG, or by oral gavage daily for a total of 6 weeks. Mice were killed at week 16. (B) Incidence of rectal bleeding or rectal prolapse between weeks 10 and 16 (the treatment period) of mice described in panel A. (C) Quantification of tumor burden at death at week 16 after removal of colon and opening the colon longitudinally with visual examination of the colon of groups of mice described in panel A. (D) Representative images of colons bearing colonic tumor with red arrows denoting areas with tumors as evaluated by a pathologist. (E) H&E sections of Swiss-rolled colonic tissue at 16 weeks of mice described in panel A, with representative images of entire colon (upper panels) and high-powered view (lower panels) of the area shown in the rectangle of upper panels. (F) Quantification of dysplastic epithelium at 16 weeks of mice described in panel A. (G) Immunofluorescence analysis for the detection of CD8 T cell (green) DNA (blue) within colonic polyps at 16 weeks of mice described in panel A. (H) Quantification of CD8 T cells (green) within colonic polyps at 16 weeks of mice described in panel F. One-way analysis of variance and Martel–Cox used for statistics and represented as follows: ∗P < .05, ∗∗P < .01, ∗∗∗P < .001. n = 14, 7, and 14 for HBSS, BC, and LGG, respectively. DAPI, 4′,6-diamidino-2-phenylindole, HPF, high-power field; IP, intraperitoneally.
Figure 6
Figure 6
LGG requires CD8 T cells to elicit a strong reduction of colonic tumors. (A) Graphic representation of the experimental outline for the induction of colonic tumors in C57BL/6 mice. Seven- to 8-week-old mice were injected with AOM before being subjected to 3 rounds of 1-week exposure to 2% DSS and a 2-week recovery period. After 3 cycles of DSS, and between weeks 8 and 10 of the experiment, tumors begin to form within the colonic epithelium of treated mice. Tumors were quantified by miniature colonoscope at week 10, before the start of treatment period at week 10, in which groups of mice were supplemented with HBSS, BC, or LGG, or by oral gavage daily for a total of 4 weeks period. Tumors were quantified further by miniature colonoscope at week 14, at the end of the 4-week treatment period. In addition, during the 4-week treatment period, groups of mice were administered either an anti-CD8 or an isotype control weekly for 4 weeks. Mice were killed at week 14. (B) Numeration of tumor burden as detected by mature colonoscopy at weeks 10 and 14 of mice described in panel A. (C) Quantification of tumor burden at death at week 14 after removal of colon and opening the colon longitudinally with visual examination of the colons of groups of mice described in panel A. (D) Representative images of colons bearing colonic tumor with red arrows denoting areas with tumors as evaluated by a pathologist. (E) H&E sections of Swiss-rolled colonic tissue at 14 weeks of mice described in panel A, with representative images of entire colon (upper panels) and high-powered view (lower panels) of the area shown in the rectangle of upper panels. (F) Quantification of dysplastic epithelium at 14 weeks of mice described in panel A. (G) Immunofluorescence analysis for the detection of CD8 T cell (green) DNA (blue) within colonic polyps at 14 weeks of mice described in panel A. (H) Quantification of CD8 T cells (green) within colonic polyps at 14 weeks of mice described in panel F. One-way analysis of variance used for statistics and represented as follows: ∗P < .05, ∗∗P < .01, and ∗∗∗P < .001. n = 9, 9, 8, and 10 for HBSS-isotype, LGG-isotype, HBSS-anti-CD8, and LGG-anti-CD8, respectively. DAPI, 4′,6-diamidino-2-phenylindole.

References

    1. Siegel R.L., Miller K.D., Jemal A. Cancer statistics, 2019. CA Cancer J Clin. 2019;69:7–34. - PubMed
    1. Torre L.A., Bray F., Siegel R.L., Ferlay J., Lortet-Tieulent J., Jemal A. Global cancer statistics, 2012: global cancer statistics, 2012. CA Cancer J Clin. 2015;65:87–108. - PubMed
    1. Arnold M., Sierra M.S., Laversanne M., Soerjomataram I., Jemal A., Bray F. Global patterns and trends in colorectal cancer incidence and mortality. Gut. 2017;66:683–691. - PubMed
    1. Overman M.J., Lonardi S., Wong K.Y.M., Lenz H.-J., Gelsomino F., Aglietta M., Morse M.A., Van Cutsem E., McDermott R., Hill A., Sawyer M.B., Hendlisz A., Neyns B., Svrcek M., Moss R.A., Ledeine J.-M., Cao Z.A., Kamble S., Kopetz S., André T. Durable clinical benefit with nivolumab plus ipilimumab in DNA mismatch repair-deficient/microsatellite instability-high metastatic colorectal cancer. J Clin Oncol. 2018;36:773–779. - PubMed
    1. Overman M.J., Ernstoff M.S., Morse M.A. Where we stand with immunotherapy in colorectal cancer: deficient mismatch repair, proficient mismatch repair, and toxicity management. Am Soc Clin Oncol. 2018;38:239–247. - PubMed

Publication types

MeSH terms

Substances