

doi: 10.1161/CIRCRESAHA.121.319094.
Epub 2021 Jun 11.
Impaired Binding to Junctophilin-2 and Nanostructural Alteration in CPVT Mutation
Affiliations
- PMID: 34111951
- PMCID: PMC8320243
- DOI: 10.1161/CIRCRESAHA.121.319094
Item in Clipboard
Impaired Binding to Junctophilin-2 and Nanostructural Alteration in CPVT Mutation
Circ Res.
.
Abstract
[Figure: see text].
Keywords: action potential; calcium; junctophilin; mutation; ryanodine receptor; ventricular tachycardia.
Conflict of interest statement
DISCLOSURES
No conflict of interest
Figures
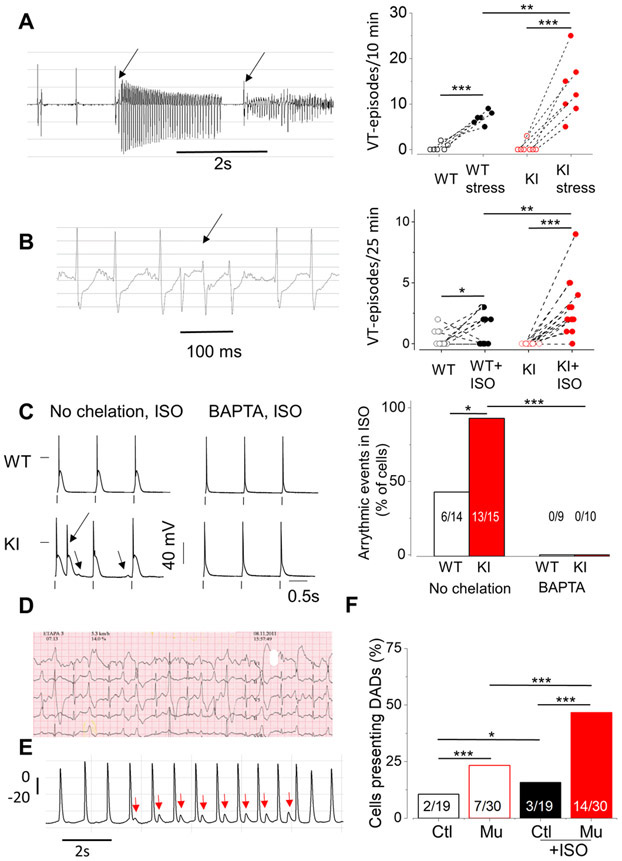
A. Left. Example of an ECG recording of KI mice showing ventricular tachycardia (VT) (arrows) after emotional stress (hairdryer blowing protocol). Right. VT episodes during 10 minutes recording in mice before and under emotional stress in 6 WT and 7 KI mice. B. Left. VT occurrence in KI mouse after 1 mg/Kg ISO injection. Right. Incidence of VT after ISO injection in 14 WT and 15 KI mice. C. Left. Representative AP recordings from WT and KI myocytes with no Ca2+ chelator (left) or with 5 mM BAPTA (right) in the intracellular solution during 100 nM ISO perfusion. The extra AP, consistent with triggered activity (TA) is marked by an arrow. The other arrow points to a DAD. Right. The occurrence of DADs / Triggered Activity (TA) measured in WT and KI myocytes, either without Ca2+ chelator in the intracellular solution (left panels) or in the presence of 5 mM BAPTA (right) expressed as % of cells displaying at least one event during 1 Hz stimulation. Numbers on the bars indicates n of positive cells/total. D. Exercise-induced ventricular arrhythmias during a Bruce protocol exercise testing (third and fourth stage) in a patient carrying the mutation RyR2R420Q (speed recording at 25mm/s) showing ventricular ectopic beats, bidirectional couplets and non-sustained ventricular tachycardia. E. AP recorded in an hiPSC-CM from the same patient (in D) showing DADs (marked by red arrows) during ISO perfusion (1 μM). F. DADs incidence in human hiPSC-CMs in basal conditions and during ISO perfusion in 19 control cells (Ctl) and 30 RyR2R420Q carrier cells (Mu). *p<0.05; **p<0.05; ***p<0.005. Statistical tests and exact p values are provided in Online Table III.
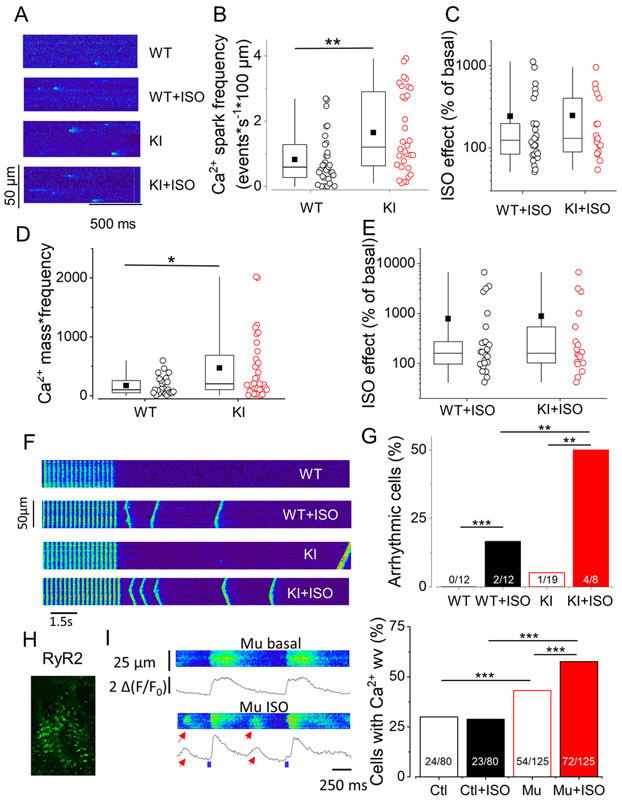
A. Line scan confocal images showing Ca2+ sparks in ventricular cardiomyocytes isolated from a WT and a KI mouse in basal conditions and during 100 nM ISO perfusion. B. Ca2+ sparks frequency measured as number of events recorded per second in a 100 μm line of scan in 31 WT and 31 KI cells. C. Ca2+ spark frequency increase by 100nM ISO in 9 WT and 18 KI cells. D. Estimation of total Ca2+ release as Ca2+ sparks, calculated by multiplying the Ca2+ spark mass by the Ca2+ spark frequency in 27 WT and 28 KI cells. E. Percentage of increase in Ca2+ release through Ca2+ sparks by ISO in 8 WT and 18 KI cells. F. Line scan images of mouse ventricular cardiomyocytes from WT and KI cells without and with ISO. G. Percentage of arrhythmic cells during protocol such as in F. H. Example of RyR2 immunolabelling of an h-iPS-CM. I. Left. Line scan images of a h-iPS-CM from the CPVT patient electrically stimulated at 1 HZ in absence and presence of 1 μM ISO. Spontaneous diastolic Ca2+ release as Ca2+ waves are marked by the red arrows. Right. Percentage of arrhythmic cells in the presence of ISO in hiPS-CM control (Ctl) and mutant carrier (Mu). *p<0.05; **p<0.05; ***p<0.005. Statistical tests and exact p values are provided in Online Table III..
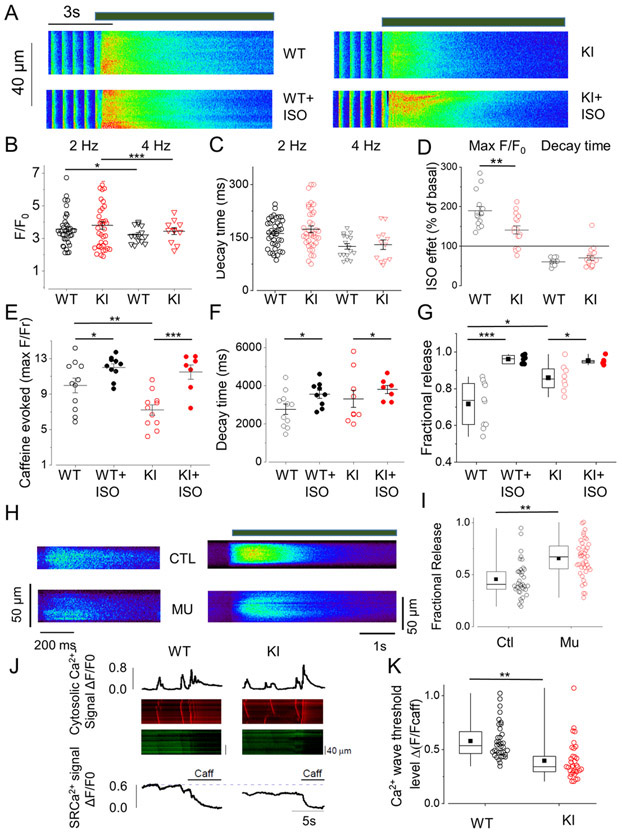
A Line scan images of a cardiomyocyte isolated from a WT and a KI mouse before and during 100nM ISO perfusion. The thick line over the images represent 10 mM caffeine perfusion. B. [Ca2+]i transient amplitude represented as the maximum value of F/F0, where F is the fluorescence signal and F0 the diastolic fluorescence during field stimulation at 2 Hz in 39 cells WT (black open circles) and 40 KI cells (red open circles); and at 4 Hz (triangles) in 16 WT and 12 KI cells. C. Decay time constant of the [Ca2+]i transients from the same cell groups than in B obtained by fitting the descending portion of the fluorescence trace to a single exponential function. D. ISO effect on [Ca2+]i transient amplitude (left bars) and on decay time (right bars) obtained by normalizing in each cell the values in the presence of ISO to the values before ISO application in 16 WT and 18 KI cells during stimulation at 2 Hz. Independently, each group showed a significant ISO effect . E. Ca2+ transient evoked by rapid caffeine application (10 mM) provided as peak fluorescence evoked by caffeine (F) during electrical stimulation at 2 Hz, normalized to the resting fluorescence (F0) in cardiomyocytes from both groups in absence and presence of ISO (20 WT cells, 16 WT cells after ISO, 19 KI cells, red hatched bar, 14 KI cells in the presence of ISO). F. Decay time constant obtained as in C but during caffeine application in the same cells than in E. G. “Fractional release”, calculated as the peak F/F0 evoked by electrical stimulations at 4 Hz, normalized by the caffeine-evoked peak F/F0 in absence (open circles) or presence (filled circles) of 100nM ISO. H. Left, line scan of h-iPS-CM from a control (CTL) and mutant carrier (Mu) during filed stimulation at 1 Hz. Right, line scan images from h-iPS-CM during caffeine application (time of caffeine presence is noted by the thick line). I. “Fractional release” (obtained as in G) for 37 control (black) and 40 RyR2R420Q carriers (red) hiPS-CMs. J. Representative line-scans and traces of cytosolic (upper traces) and luminal (SR) Ca2+ signal (bottom traces) in permeabilized cardiomyocytes from WT and KI mice. 10 mM caffeine was used to determine the minimal fluorescence signal when the SR is empty. K. Quantitative analysis of SR Ca2+ wave threshold in permeabilized cardiomyocytes with a [Ca2+]cyt of 100 nM in 36 WT and 34 KI cells. *p<0.05; **p<0.05; ***p<0.005 Statistical tests and exact p values are provided in Online Table III.

A Representative examples of ICa traces and their evoked intracellular [Ca2+]i transients simultaneously recorded in WT and KI myocytes. B Average Ca2+ transient amplitude (Top panel) and ICa density (lower panel) voltage dependence relationships in 8 WT and 16 KI myocytes. Peak fluorescence signal at each depolarizing step (F) was normalized by basal fluorescence measured at −80 mV (F−80). C Average Ca2+ induced Ca2+ release gain, measured in each cell as peak of F/F−80 normalized to the ICa integral during depolarization at −20 mV. D Fast constant time of inactivation, obtained by fitting the inactivation of the ICa trace to a double exponential. E. Average ICaL activation/inactivation curves. Activation in 8 WT and 16 KI cells. Inactivation in 7 WT and 11 KI cells. F. ICa density at −20 mV before (open circles) and during (closed circles) 100 nM ISO perfusion in 5 cells from each group. G. [Ca2+]i transient amplitude (F/F−80) elicited by the ICa from the same cell groups than in F. Color code: WT myocytes= black; KI myocytes= red. * p<0.05; **p<0.05; ***p<0.005. Statistical tests and exact p values are provided in Online Table III.
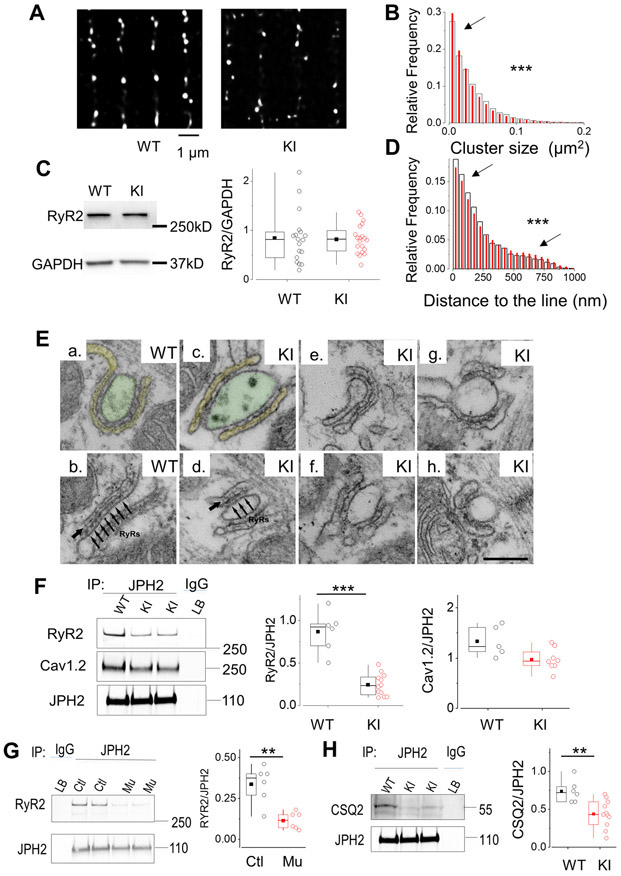
A. Deconvoluted super-resolution image of RyR2 in a cardiomyocyte from a WT mouse and a KI mouse. B. Cluster size relative frequency distribution in WT (open bars) and KI cells (red bars) (9516 clusters in 49 cells from 3 WT, 14165 clusters in 147 cells from 5 KI). C. Representative examples of Western Blot of RyR2 and GAPDH in WT and KI mice, as indicated. Right panel shows the quantification of the RyR2 bands, normalized to GAPDH in the two experimental groups (18 WT hearts, and 20 KI mice hearts). D. Relative frequency distribution of the distance of each cluster to the line connecting most, measured in WT cells (white wider bars), and KI cells (red narrower bars) from the same cell groups than in B. E. CRUs, specialized intracellular junctions between the jSR (labeled in yellow in a) and T-tubules (labelled in green in a). The cytoplasmic domains of RyR2, i.e. the feet, are visible as evenly spaced densities (pointed by a series of arrows in panel b) spanning the gap between jSR and T-tubule. The jSR is wrapped around the T-tubule to form a CRU (panel a), or associated to form a CRU with multiple (two or more) couplons (panel b). In WT, couplons are usually quite extended (panels a & b), while in KI cardiomyocytes we may find couplons, which appear fairly normal in length (panels c & e), and other ones in which the jSR is either shorter or apparently fragmented (panels d, f, g & h). The jSR contains a classic chain-like electron dense polymer (single arrows in panels b and d), representing CSQ2. In KI myocytes, the chain-like polymer of condensed CSQ2 may be sometimes missing in some portions of the jSR. F. Left: Western blot of immunoprecipitated proteins with JPH2 antibody from WT and KI hearts and then exposed successively (after stripping) to RyR2, Cav1.2 and JPH2 antibodies. Middle: Quantitative analysis of RyR2 co-IP with JPH2 in hearts from 5 WT mice and 12 KI mice. Right: Quantitative analysis of LTCC (Cav1.2) co-IP with the RyR2 in 5 WT and 8 KI hearts. G. Western blot of immunoprecipitated proteins with JPH2 antibody from control and RyR2R420Q (Mu) h-iPS-CM and then exposed successively (after stripping) to RyR2, and JPH2 antibodies. On the right, quantitative analyses from 6 different differentiations each. H. Western Blot of JPH2 immunoprecipitated CSQ2 in 6 WT and 11 KI hearts. **p<0.05 and ***p<0.0005 Statistical tests and exact p values are provided in Online Table III.
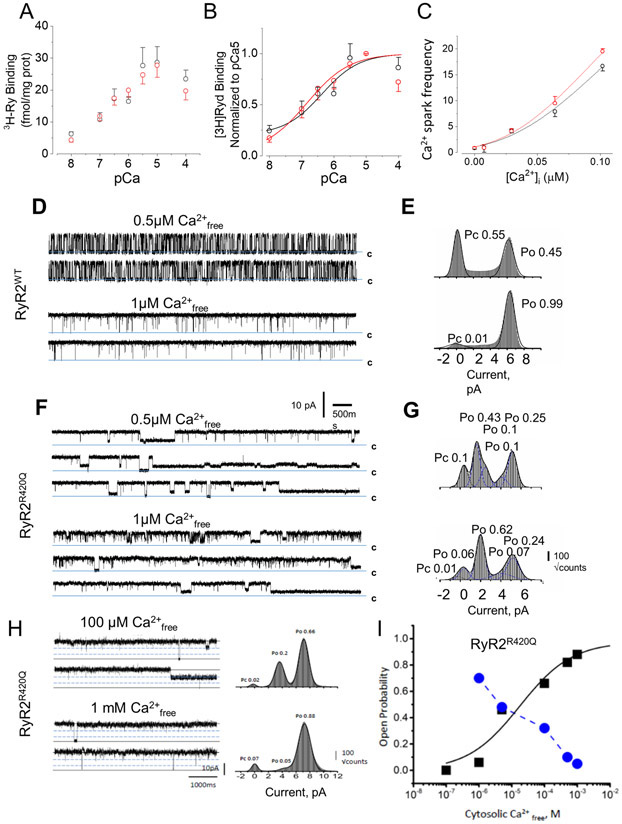
A and B [3H]Ryanodine binding to SR microsomes from 4 WT (black open circles) and from 4 KI hearts (red open circles) normalized to the protein content in A and the binding of each sample at pCa5 in B. C. Ca2+ spark frequency (measured as in Fig. 2B) recorded in permeabilized cells (46 WT and 41 KI cells from 4 animals in each group) plotted as a function of the [Ca2+]i . Symbols as in A. D. WT RyR2 single-channel conducting Ca2+. Traces obtained at 0 mV of membrane potential, in the cytosolic presence of 500 nM free Ca2+ (top) and 1 μM free Ca2+ (bottom). E Amplitude histograms obtained from 3-min single-channel recordings and fitted with multi-Gaussian functions (ordinate shown as square root of the bin counts). F Single-channel recordings of RyR2R420Q conducting Ca2+, as in D. In all traces c denotes the closed state. Filtering, 800 Hz. G. As in E but for RyR2R420Q. H. Single-channel recordings of RyR2R420Q recorded at +30 mV of membrane potential, in symmetrical 250 mM Cs-methanesulfonate, 20 mM HEPES, 1 mM BAPTA, and at the indicated cytosolic free [Ca2+], Channel openings shown as positive deflections with dashed lines indicating the sub-conductance states, and the solid lines the current levels for the closed and open states. I. Open probability of the full conductance (black squares) and added sub-conductance (blue circles) states plotted as a function of the cytosolic free [Ca2+]. Full conductance open probability fitted with a sigmoidal function. Statistical tests outcome are provided in Online Table III.
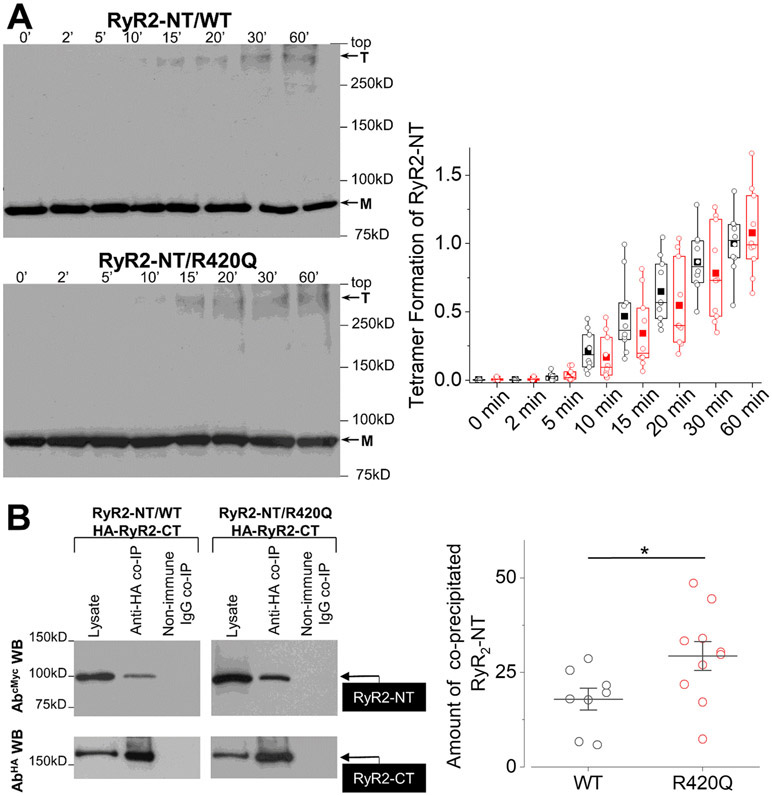
Chemical cross-linking assays of HEK293 cell homogenates expressing cMyc-tagged NTWT (RyR2 residues 1-906) or NTR420Q. Cell homogenates were incubated with glutaraldehyde for the indicated time points under reducing (10 mM DTT) conditions and analyzed by immunoblotting using AbcMyc; monomer (M) and tetramer (T) are indicated with the arrows. Densitometry analysis (n = 10 in each group) performed on the bands corresponding to tetramer and monomer moieties was used to calculate tetramer formation. Data are normalized for WT and given as mean value ± SEM; B. Co-immunoprecipitation assays from HEK293 cells co-expressing NTWT (n=8) or NTR420Q (n=10) together with HA-tagged RyR2-CT (residues 3529-4967). HA-RyR2-CT was immunoprecipitated with AbHA from CHAPS-solubilized cell lysates and the presence of co-precipitated NTWT/NTR420Q was analyzed by immunoblotting using AbcMyc (top). To detect immuno-isolated HA-RyR2-CT, 1/10th of IP samples was analyzed by immunoblotting using AbHA (bottom). Non-immune rabbit IgG served as negative control. An aliquot of HEK293 cell lysate corresponding to 1% of the amount processed in the co-IP assay was included in the gels to assess protein expression. Data summary (n ≥ 8) for NT specific binding (non-immune IgG IP signal subtracted from anti-HA IP signal) following densitometry analysis and normalization to each construct’s respective lysate (taken as 100%). * p<0.05 Statistical tests and exact p values are provided in Online Table III.
Comment in
-
RyR2 Gain-of-Function and Not So Sudden Cardiac Death.Circ Res. 2021 Jul 23;129(3):417-419. doi: 10.1161/CIRCRESAHA.121.319651. Epub 2021 Jul 22. Circ Res. 2021. PMID: 34292783 Free PMC article. No abstract available.
References
-
- Mehra R Global public health problem of sudden cardiac death. Journal of electrocardiology. 2007;40:S118–122 - PubMed
-
- Leenhardt A, Lucet V, Denjoy I, Grau F, Ngoc DD, Coumel P. Catecholaminergic polymorphic ventricular tachycardia in children. A 7-year follow-up of 21 patients. Circulation. 1995;91:1512–1519 - PubMed
-
- Peng W, Shen H, Wu J, Guo W, Pan X, Wang R, Chen SR, Yan N. Structural basis for the gating mechanism of the type 2 ryanodine receptor ryr2. Science. 2016;354 - PubMed
-
- George CH JH, Thomas NL, Fry DL, Lai FA. Ryanodine receptors and ventricular arrhythmias: Emerging trends in mutations, mechanisms and therapies. J Mol and Cell Cardiol. 2007;42:34–50 - PubMed
-
- Yano M, Yamamoto T, Ikeda Y, Matsuzaki M. Mechanisms of disease: Ryanodine receptor defects in heart failure and fatal arrhythmia. Nat Clin Pract Cardiovasc Med. 2006;3:43–52 - PubMed
Publication types
MeSH terms
Substances
Grants and funding
LinkOut - more resources
Full Text Sources
Molecular Biology Databases
