Review
. 2021 Jun 15;77(23):2939-2959.
doi: 10.1016/j.jacc.2021.04.035.

The ARIC (Atherosclerosis Risk In Communities) Study: JACC Focus Seminar 3/8

Affiliations
Review

The ARIC (Atherosclerosis Risk In Communities) Study: JACC Focus Seminar 3/8

Jacqueline D Wright et al. J Am Coll Cardiol. .

Abstract

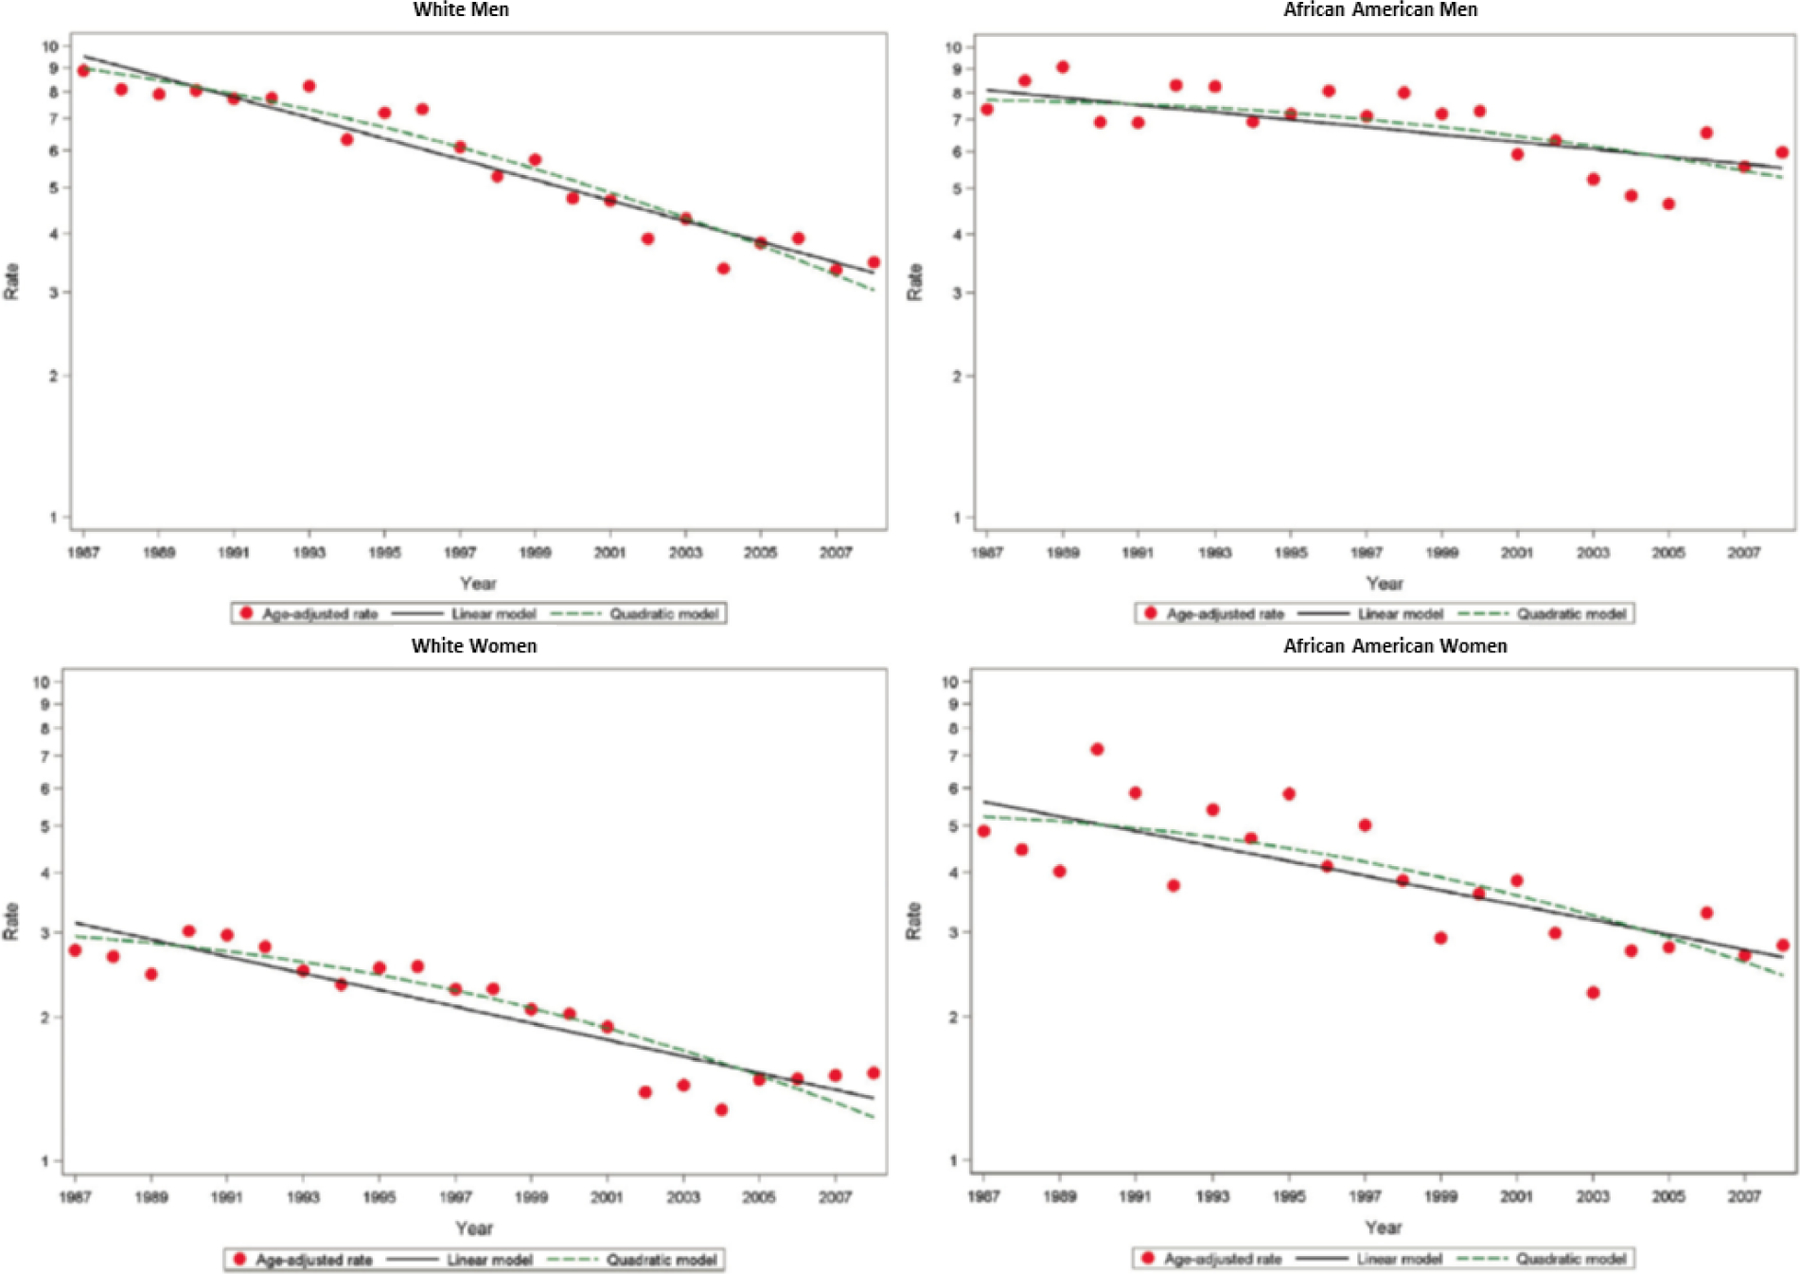
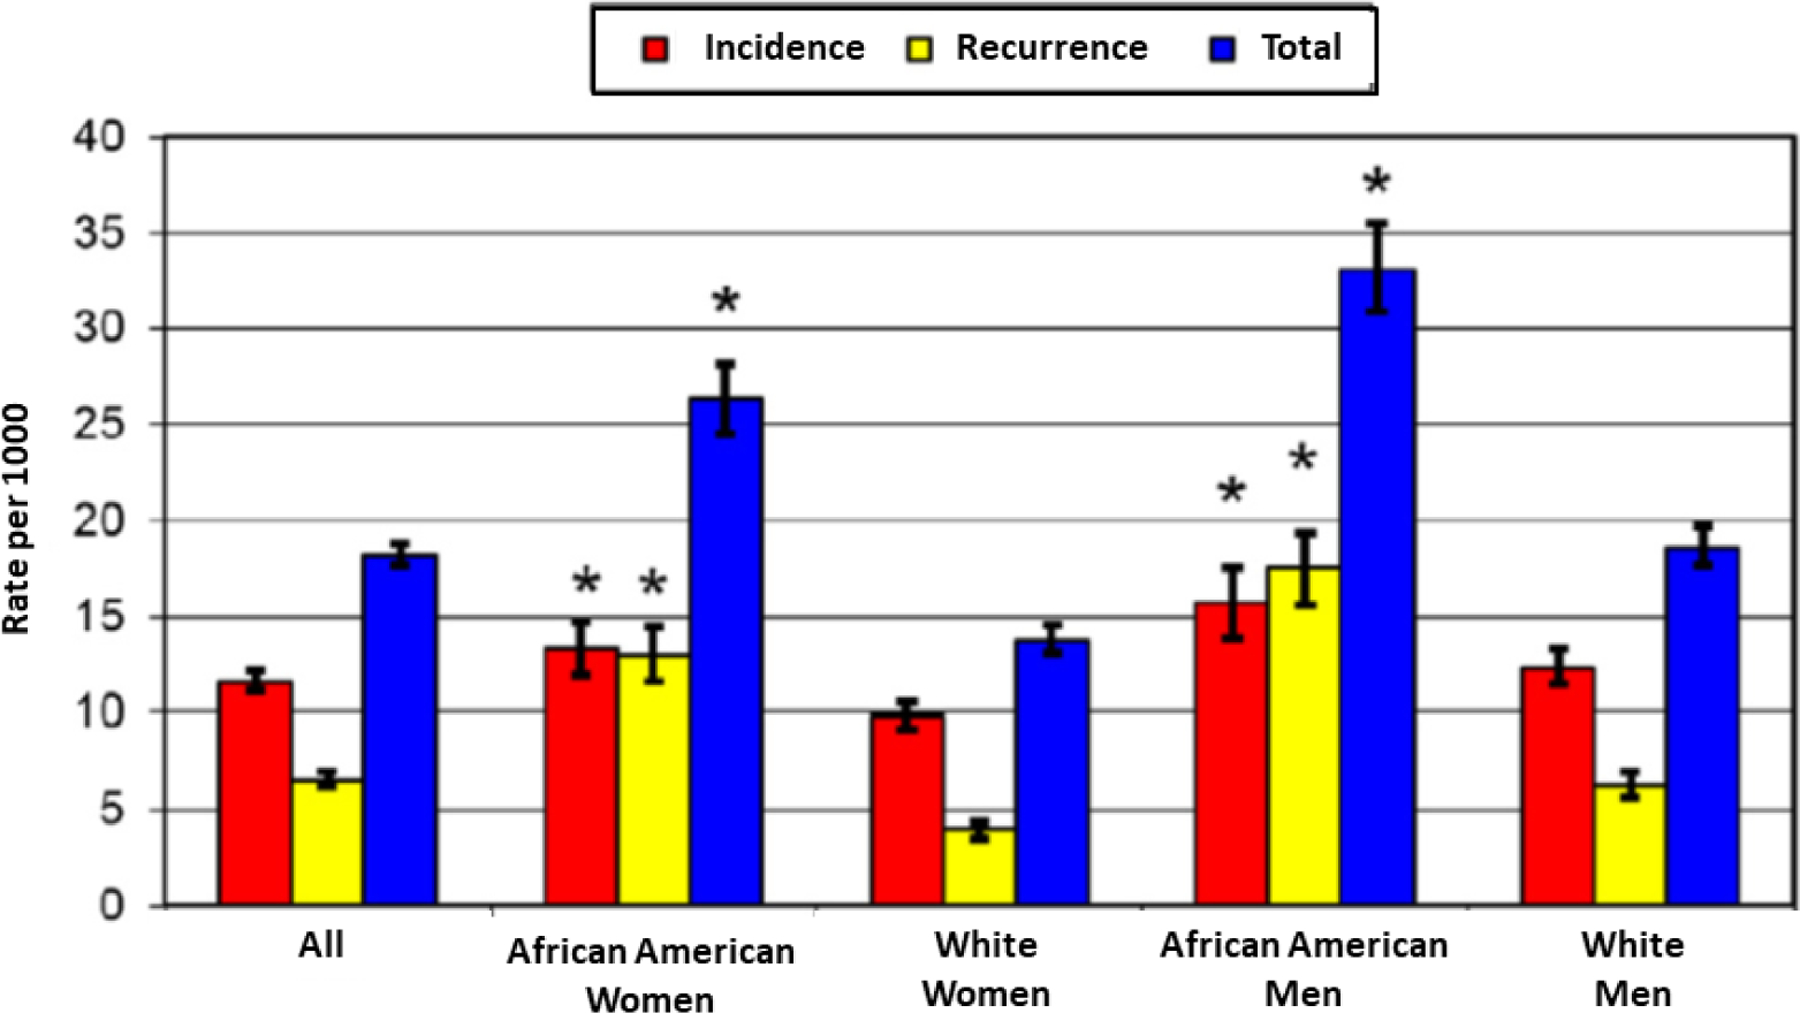
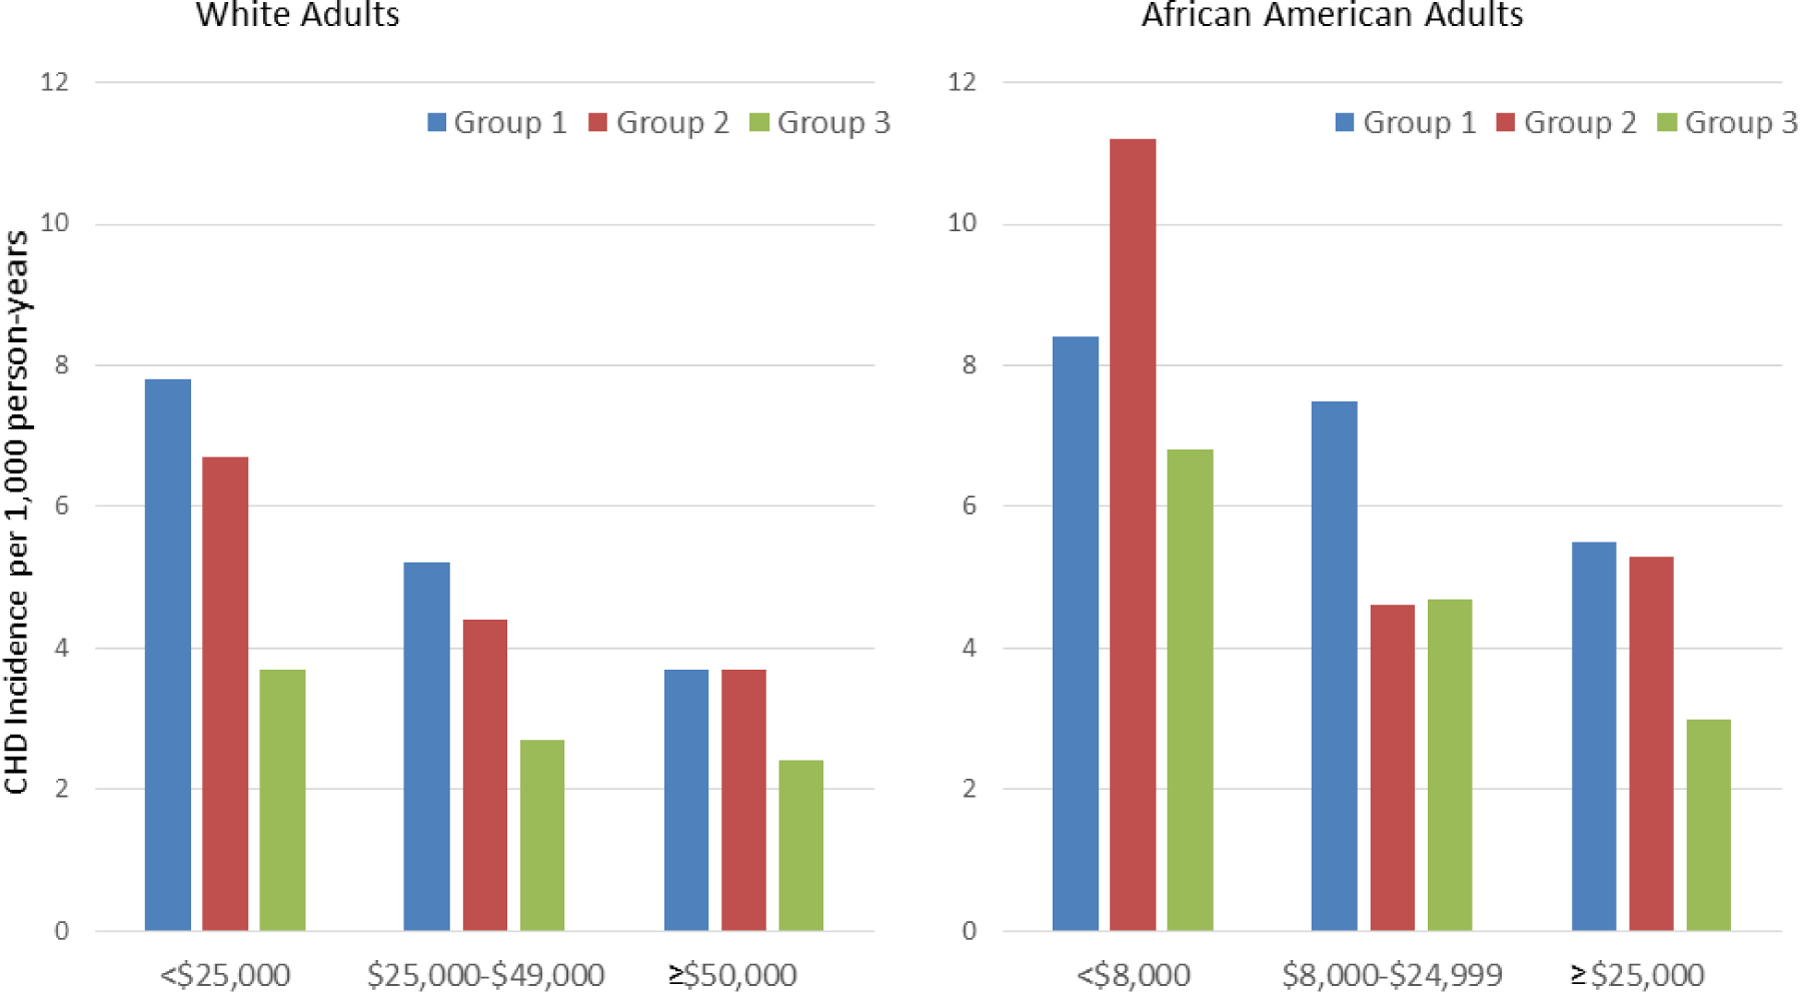
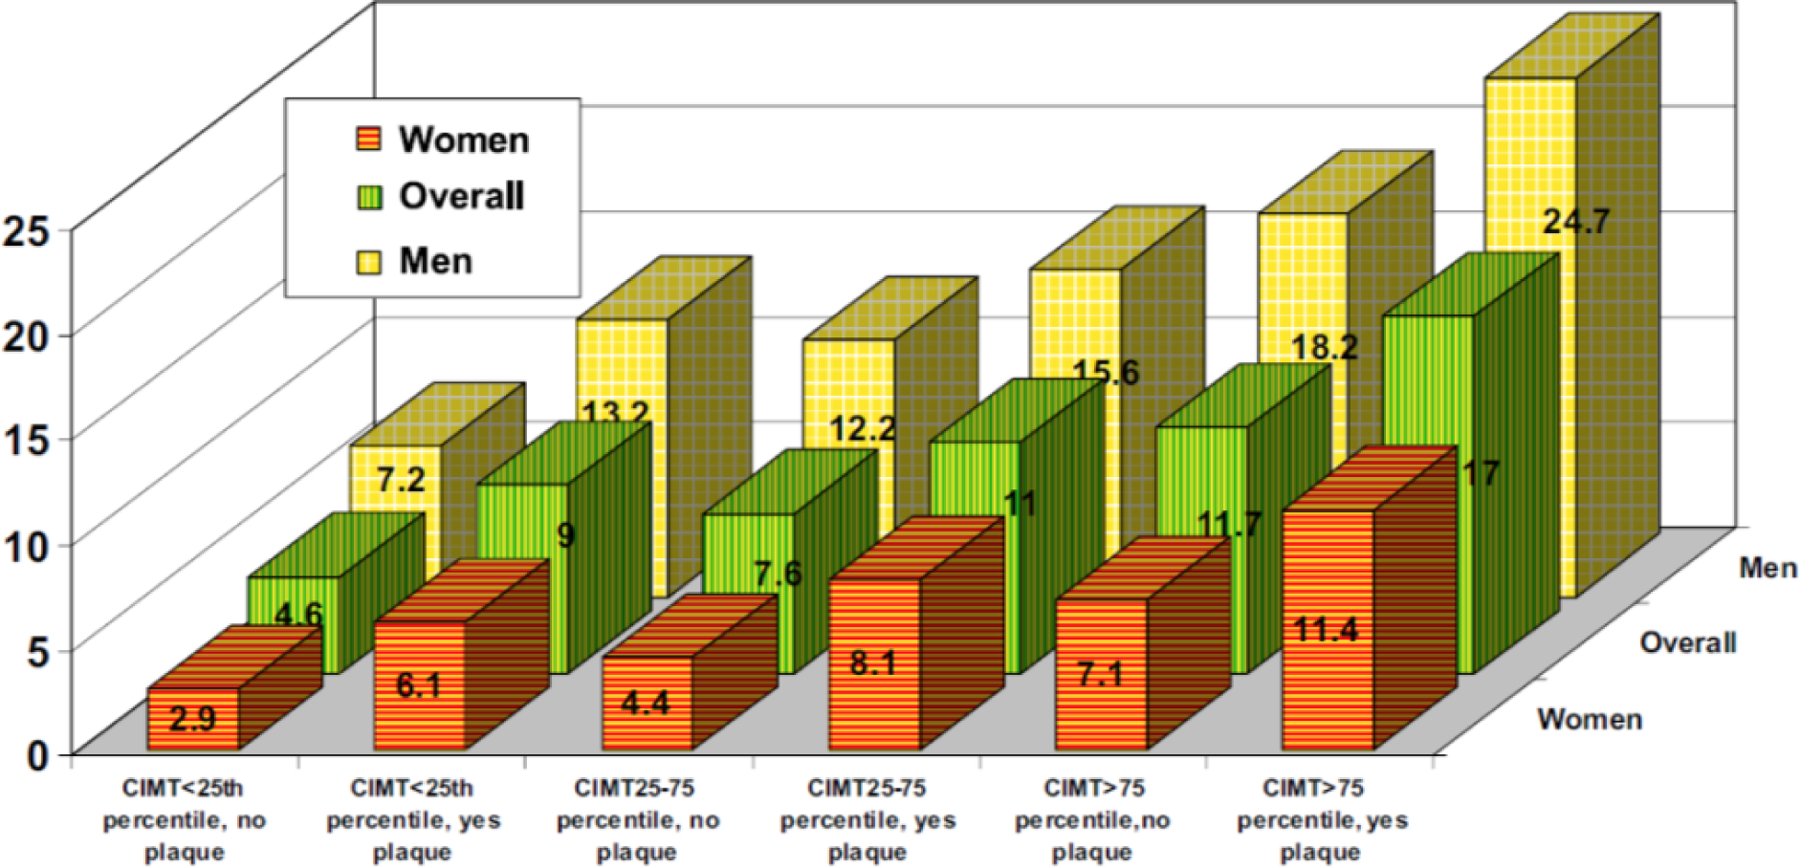
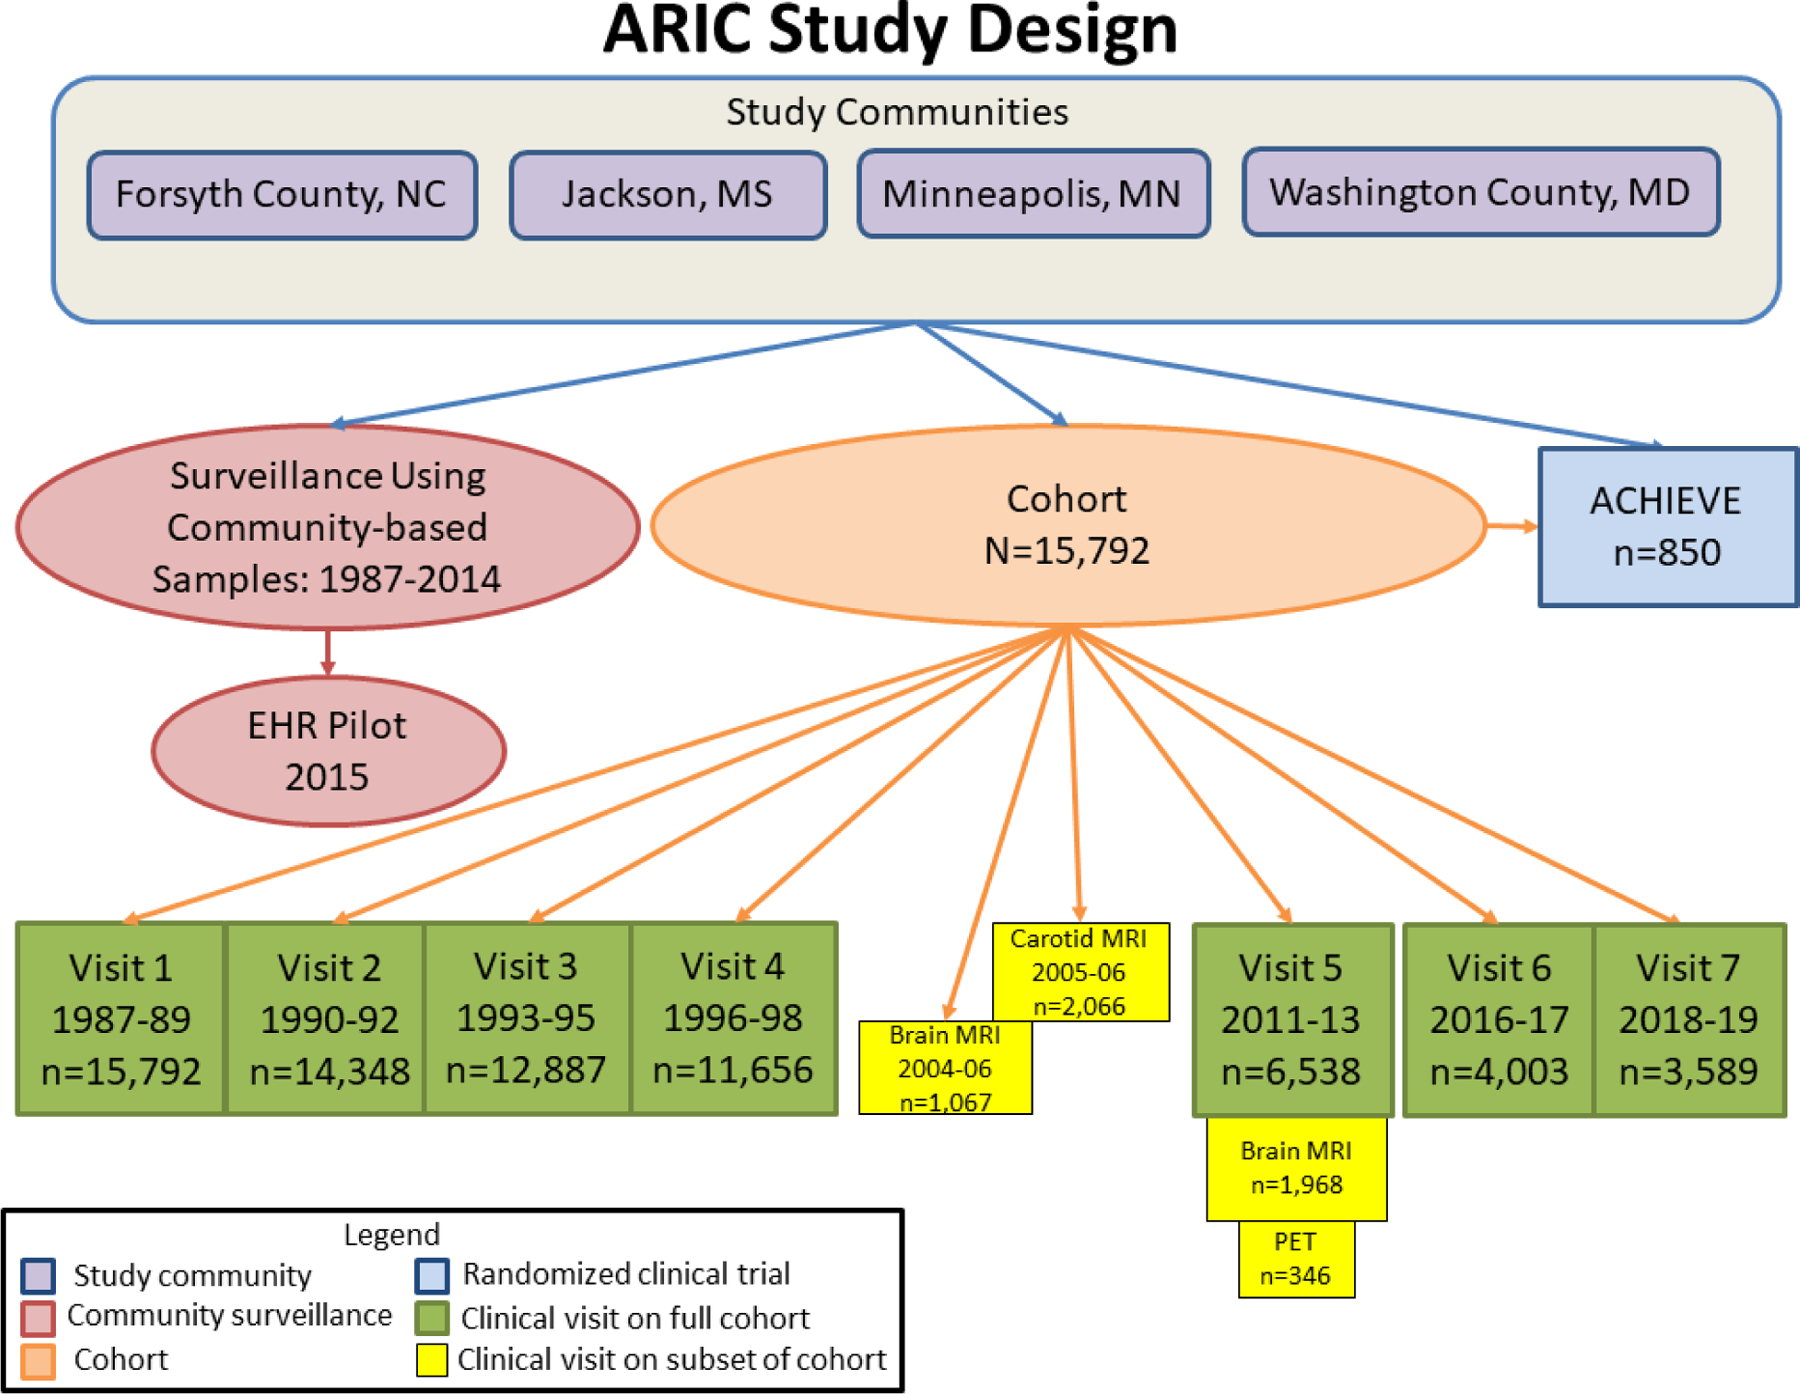
ARIC (Atherosclerosis Risk In Communities) initiated community-based surveillance in 1987 for myocardial infarction and coronary heart disease (CHD) incidence and mortality and created a prospective cohort of 15,792 Black and White adults ages 45 to 64 years. The primary aims were to improve understanding of the decline in CHD mortality and identify determinants of subclinical atherosclerosis and CHD in Black and White middle-age adults. ARIC has examined areas including health disparities, genomics, heart failure, and prevention, producing more than 2,300 publications. Results have had strong clinical impact and demonstrate the importance of population-based research in the spectrum of biomedical research to improve health.

Keywords: adult; cohort study; epidemiology; health disparity; risk factors; surveillance.


Conflict of interest statement

Funding Support and Author Disclosures The ARIC study has been funded in whole or in part with federal funds from the National Heart, Lung, and Blood Institute, National Institutes of Health, Department of Health and Human Services, under contract nos. HHSN268201700001I, HHSN268201700002I, HHSN268201700003I, HHSN268201700004I, and HHSN268201700005I. Neurocognitive data are collected by U01 2U01HL096812, 2U01HL096814, 2U01HL096899, 2U01HL096902, and 2U01HL096917 from the National Institutes of Health (National Heart, Lung, and Blood Institute; National Institute of Neurological Disorders and Stroke; National Institute on Aging; and National Institute on Deafness and Other Communication Disorders) and with previous brain magnetic resonance imaging examinations funded by R01-HL70825 and biomarkers by R01-HL134320 from the National Heart, Lung, and Blood Institute. Dr. Coresh has received investigator-initiated grant support from the National Institutes of Health and National Kidney Foundation (the National Kidney Foundation received research support from industry) and has served as a scientific advisor to Healthy.io and Alike. Dr. Ballantyne has received significant (>$10,000) grant/research support (all paid to institution, not individual) from Abbott Diagnostic, Akcea, Amgen, Esperion, Novartis, Regeneron, Roche Diagnostic, the National Institutes of Health, the American Heart Association, and American Diabetes Association; and has served as a consultant for Abbott Diagnostics, Akcea, Althera, Amarin (significant), Amgen, Arrowhead, AstraZeneca, Corvidia, Denka Seiken (significant), Esperion, Gilead, Janssen, Matinas BioPharma Inc., New Amsterdam (significant), Novartis, Novo Nordisk, Pfizer, Regeneron, Roche Diagnostic, and Sanofi-Synthelabo (significant). All other authors have reported that they have no relationships relevant to the contents of this paper to disclose.

Figures

Figure 1.
Figure 1.. Age- and biomarker-adjusted rate in hospitalized MI or CHD death.
Age- and biomarker-adjusted rate in first hospitalized MI or CHD death without prior MI, estimated per 1000 persons and age-adjusted trends estimated by linear and quadratic Poisson regression, for men and women aged 35 to 74 years, ARIC 1987–2008. Republished with permission from Wayne D. Rosamond, Lloyd E. Chambless, Gerardo Heiss, et al. Twenty-Two–Year Trends in Incidence of Myocardial Infarction, Coronary Heart Disease Mortality, and Case Fatality in 4 US Communities, 1987–2008. Circulation. 2012;125: 1848–1857.
Figure 2.
Figure 2.. Age-adjusted rates of hospitalized ADHF events: 2005 to 2009.
Rates of first, recurrent, and all ADHF hospitalizations are adjusted for age by the direct method, according to the US 2000 population distribution. * p value < 0.05 for the gender-specific comparison between African American and white groups. Republished with permission from Chang PP, Chambless LE, Shahar E, et al. Incidence and survival of hospitalized acute decompensated heart failure in four US communities (from the Atherosclerosis Risk in Communities Study). Am J Cardiol. 2014 Feb 1;113(3):504–10.
Figure 3.
Figure 3.. CHD Incidence Rates for Race and Neighborhood Groups.
CHD incidence rates were adjusted for age, study site, and sex and are shown according to neighborhood group and personal income level. In whites and African Americans, neighborhood groups were defined according to summary socioeconomic scores. Group 1 (scores in the lowest third) corresponds to the most disadvantaged neighborhoods, and group 3 (scores in the highest third) corresponds to the most advantaged neighborhoods. Neighborhood scores were created using six neighborhood characteristics of wealth and income: 1) median household income, 2) median value of housing units, 3) percent of households receiving interest, dividend, or rental income, 4) percent of households with adults 25 years and older who completed high school, 5) percent of adults 25 years and older who completed college, and 6) percent of employed persons 16 years and older who were occupied in executive, managerial, or professional occupations. Republished with permission from Diez Roux AV, Merkin SS, Arnett D, e tal. Neighborhood of residence and incidence of coronary heart disease. N Engl J Med. 2001 Jul 12;345(2):99–106.
Figure 4.
Figure 4.. CHD Incidence Rate per 1,000 Person-Years by CIMT and Plaque.
Adjusted CHD incidence rate for women, men, and overall, by categories of carotid intima-media thickness (CIMT) and presence or absence of plaque. For every CIMT category (i.e., <25th percentile, 25th to 75th percentile, and >75th percentile), for the overall group (green bars), men (yellow bars), or women (orange bars), having carotid artery plaque is associated with a higher incidence of coronary heart disease. Source: Nambi et al. J Am Coll Cardiol 2010(44)
Figure 5.
Figure 5.. Odds Ratios for Elevated SUVR by Vascular Risk Factors and Visit.
Adjusted Odds Ratios for Global Cortex Florbetapir SUVRs > 1.2 by Number of Vascular Risk Factors, Midlife Through Late Life Adjusted odds ratios (with 95% confidence intervals as error bars) are shown for number of vascular risk factors for visits 1 (at midlife) through 5 (at late life) for standardized uptake value ratios (SUVRs) > 1.2. Models are adjusted for age (at Visit 5, 2011–13), sex, race, education level, and apolipoprotein E ε4 genotype. Vascular risk factors include body mass index ≥30 kg/m2, current smoking, hypertension, diabetes, and total serum cholesterol ≥200 mg/dL. Republished with permission from Gottesman RF, Schneider AL, Zhou Y, et al. Association Between Midlife Vascular Risk Factors and Estimated Brain Amyloid Deposition. JAMA. 2017 Apr 11;317(14):1443–1450.
Figure 6.
Figure 6.. Time free from AF by sex, race, and risk factors.
Survival curves adjusted for age, study center, education, and height showing time free from AF according to risk factor group (optimal, borderline, or elevated) in white women (A), white men (B), African American women (C), and African American men (D). The numbers of subjects at risk throughout the duration of study follow-up are shown on the x axis. An optimal risk factor profile was defined as no history of cardiac disease (HF or CHD); systolic BP <120 mm Hg, diastolic BP <80 mm Hg, and no use of antihypertensive medication; body mass index (BMI) <25 kg/m2; fasting serum glucose <100 mg/dL, no use of antidiabetic medication, and no history of physician-diagnosed diabetes mellitus; and never a smoker. A borderline risk factor profile was defined as having any of the following criteria and no elevated risk factor profile characteristics: systolic BP of 120 to 139 mm Hg and/or diastolic BP of 80 to 89 mm Hg and no use of antihypertensive medication; BMI of 25 to <30 kg/m2; fasting serum glucose 100 to 125 mg/dL, no use of antidiabetic medication, and no history of physician-diagnosed diabetes mellitus; and a former smoker. An elevated risk factor profile was defined as having any of the following criteria: history of cardiac disease (HF or CHD); systolic BP ≥140 mm Hg, diastolic BP ≥90 mm Hg, or use of antihypertensive medication; BMI ≥30 kg/m2; fasting serum glucose ≥126 mg/dL, use of antidiabetic medication, or history of physician diagnosed diabetes mellitus; or a current smoker. Republished with permission from Huxley RR, Lopez FL, Folsom AR, et al. Absolute and attributable risks of atrial fibrillation in relation to optimal and borderline risk factors: the Atherosclerosis Risk in Communities (ARIC) study. Circulation. 2011 Apr 12;123(14):1501–8.
Figure 7.
Figure 7.. CVD Incidence Rate According to Ideal Health Behaviors and Factors.
Age-, sex-, and race-adjusted incidence rate of CVD according to the number of ideal cardiovascular health behaviors (nonsmoking, body mass index, physical activity, healthy diet score) and health factors (total cholesterol, blood pressure, and glucose), ARIC (Atherosclerosis Risk in Communities), 1987 to 2007. Source: Folsom et al. J Am Coll Cardiol 2011(40)
Figure 8.
Figure 8.. Risk of Coronary Events, According to Genetic and Lifestyle Risk.
Shown are adjusted hazard ratios for coronary events in each of the three prospective cohorts, according to genetic risk and lifestyle risk: the Atherosclerosis Risk in Communities (ARIC) cohort, the Women’s Genome Health Study (WGHS) cohort, and the Malmö Diet and Cancer Study (MDCS) cohort. In these comparisons, participants at low genetic risk with a favorable lifestyle served as the reference group. There was no evidence of a significant interaction between genetic and lifestyle risk factors (P = 0.38 for interaction in the ARIC cohort, P = 0.31 in the WGHS cohort, and P = 0.24 in the MDCS cohort). Unadjusted incidence rates are reported per 1000 person-years of follow-up. A random-effects meta-analysis was used to combine cohort-specific results. Republished with permission from Khera AV, Emdin CA, Drake I, et al. Genetic Risk, Adherence to a Healthy Lifestyle, and Coronary Disease. N Engl J Med. 2016 Dec 15;375(24):2349–2358.
Central Illustration.
Central Illustration.. ARIC Study Design.
Design of prospective cohort study with clinic examinations; community surveillance for myocardial infarction, coronary heart disease and heart failure, including feasibility pilot study of surveillance using Electronic Health Record data; and Aging and Cognitive Health Evaluation in Elders (ACHIEVE) randomized clinical trial with participants recruited from cohort and de novo participants from study communities. Information about ARIC can be found on the study website: https://sites.cscc.unc.edu/aric/.

References

    1. The ARIC Investigators. The Atherosclerosis Risk in Communities (ARIC) study: design and objectives. Am J Epidemiol 1989;129:687–702. - PubMed
    1. Taliun D, Harris DN, Kessler MD, et al. Sequencing of 53,831 diverse genomes from the NHLBI TOPMed Program. Nature 2021;590: 290–9. - PMC - PubMed
    1. Havlik RJ, Feinleib M, editors. Proceedings of the 1978 Conference on the Decline in Coronary Heart Disease Mortality. Bethesda, MD: U.S. Department of Health, Education, and Welfare, Public Health Service, National Institutes of Health, 1979.
    1. Goff DC Jr., Khan SS, Lloyd-Jones D, et al. Bending the curve in cardiovascular disease mortality: Bethesda + 40 and beyond. Circulation 2021;143:837–51. - PMC - PubMed
    1. CCSP Coordinating Center. Community Cardiovascular Surveillance Program: Final Report to the National Heart, Lung, and Blood Institute. University of Maryland; Baltimore MD: 1984.

Publication types