. 2021 Jun 11;372(6547):eaba2609.
doi: 10.1126/science.aba2609.

Analysis of multispectral imaging with the AstroPath platform informs efficacy of PD-1 blockade

Affiliations

Analysis of multispectral imaging with the AstroPath platform informs efficacy of PD-1 blockade

Sneha Berry et al. Science. .

Abstract

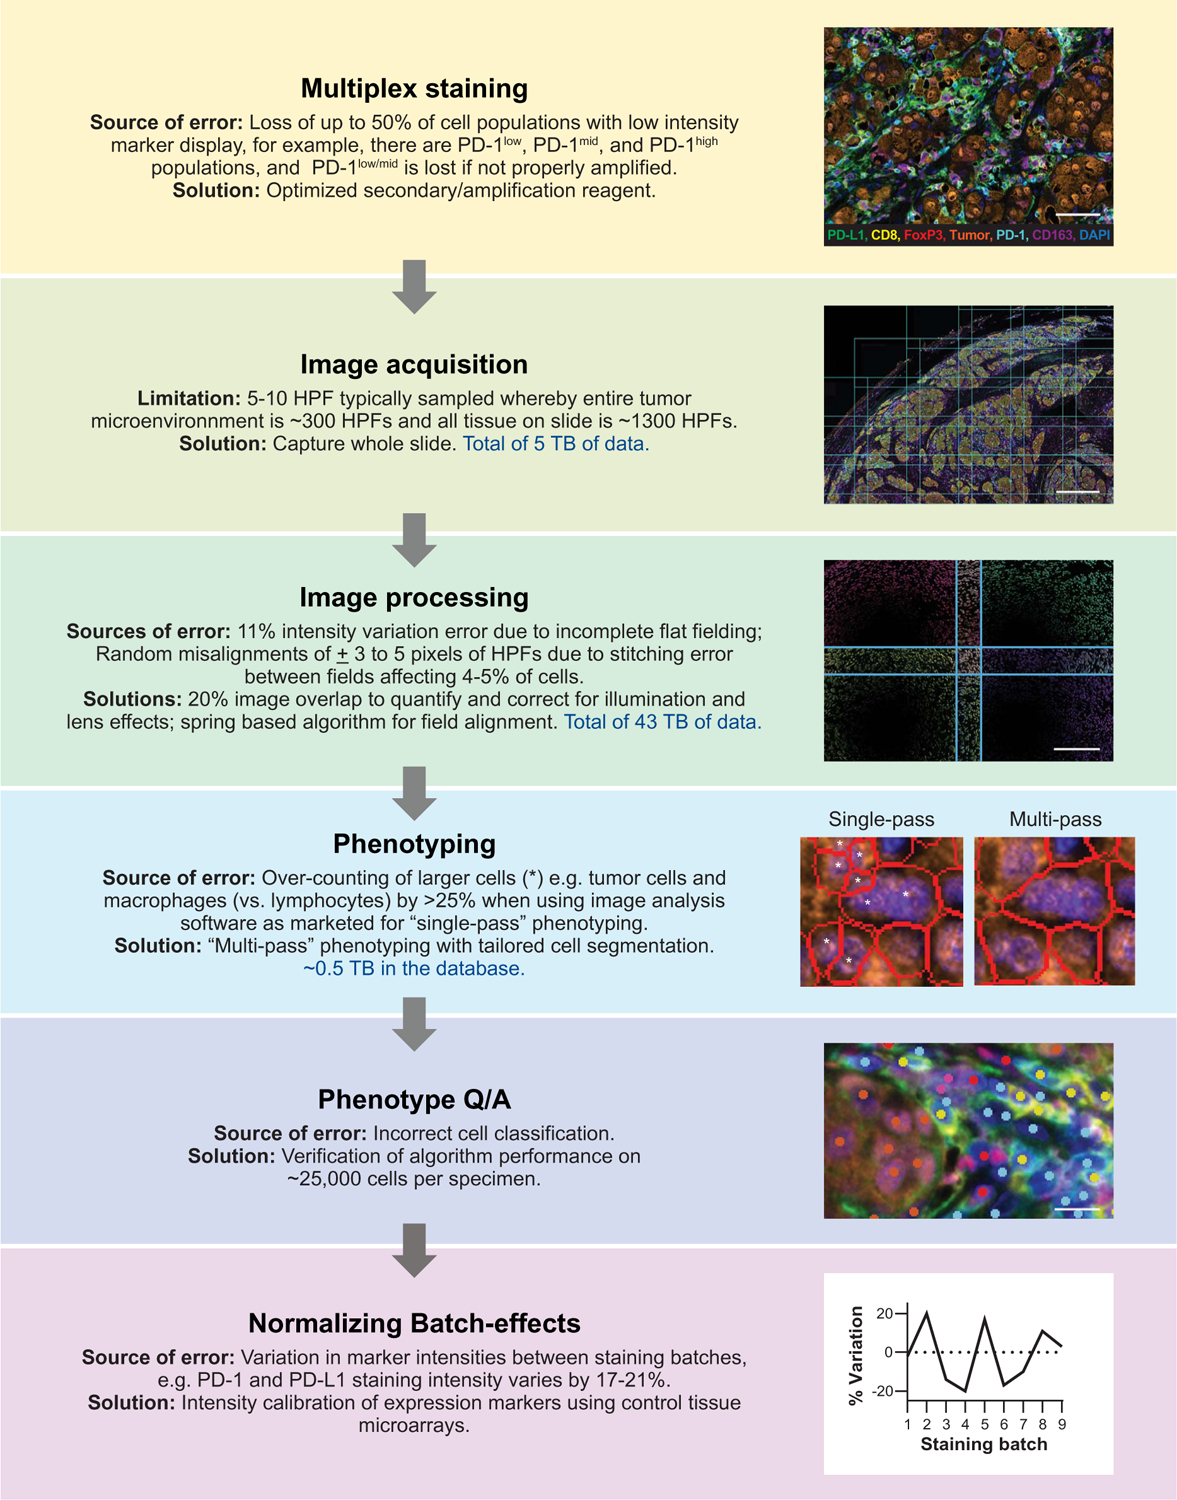
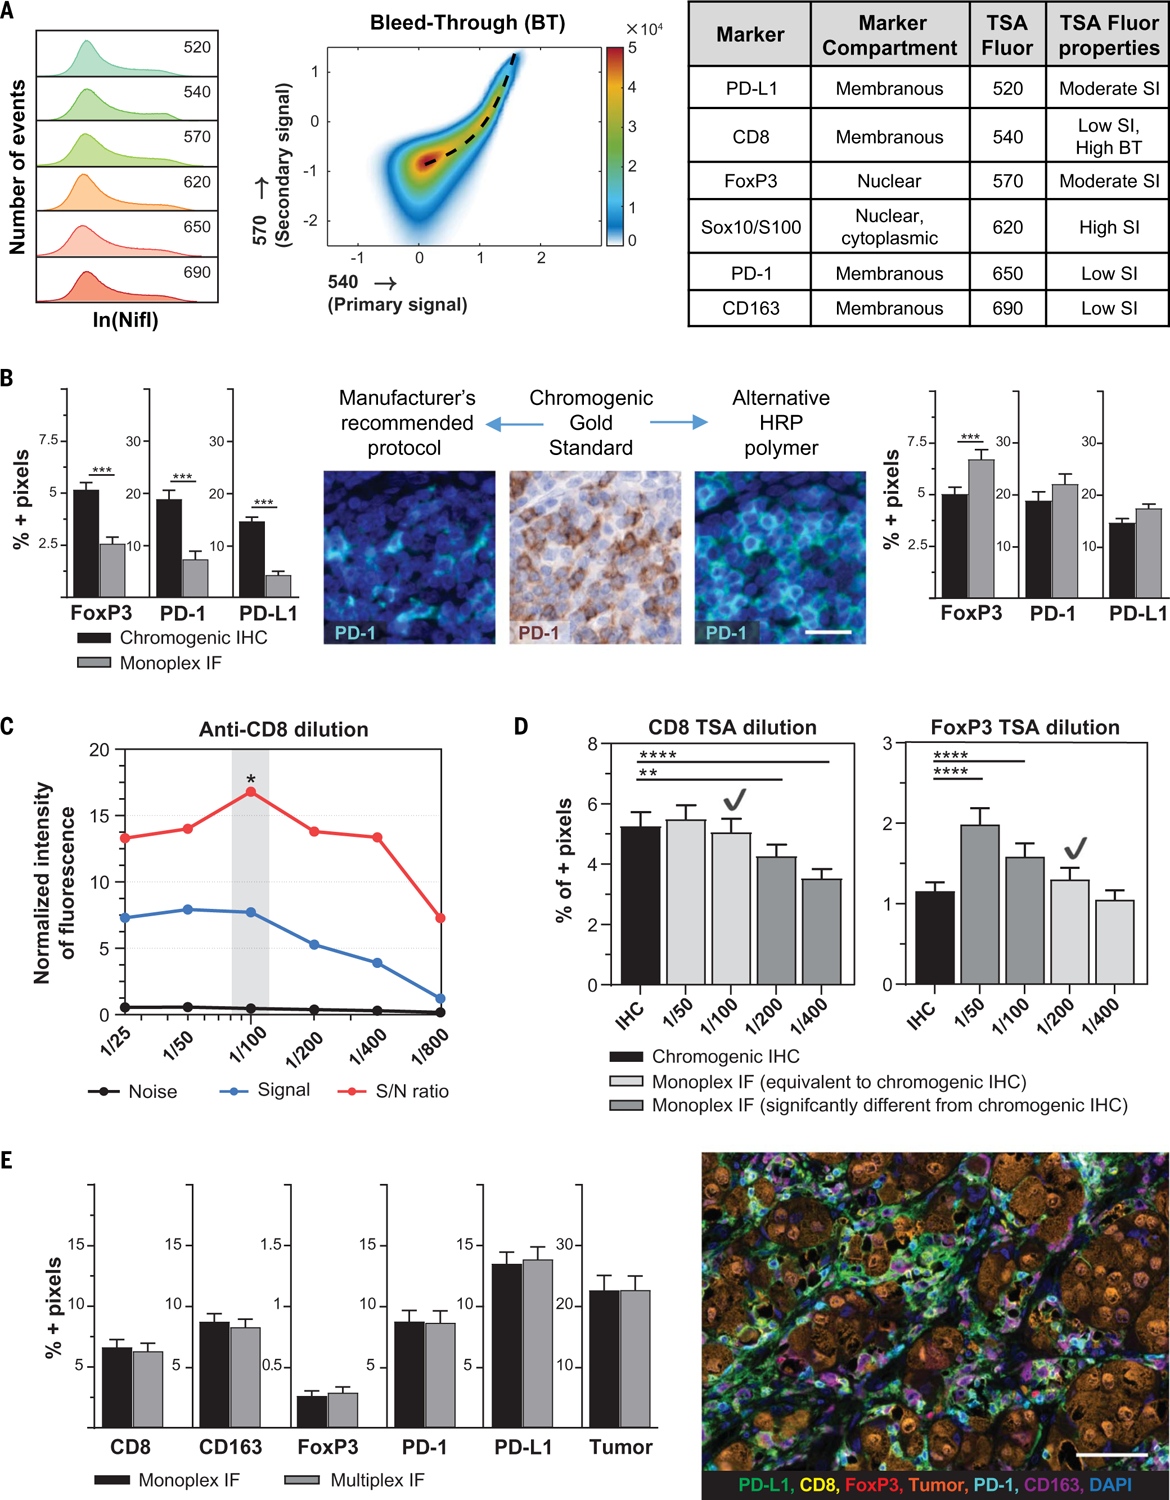
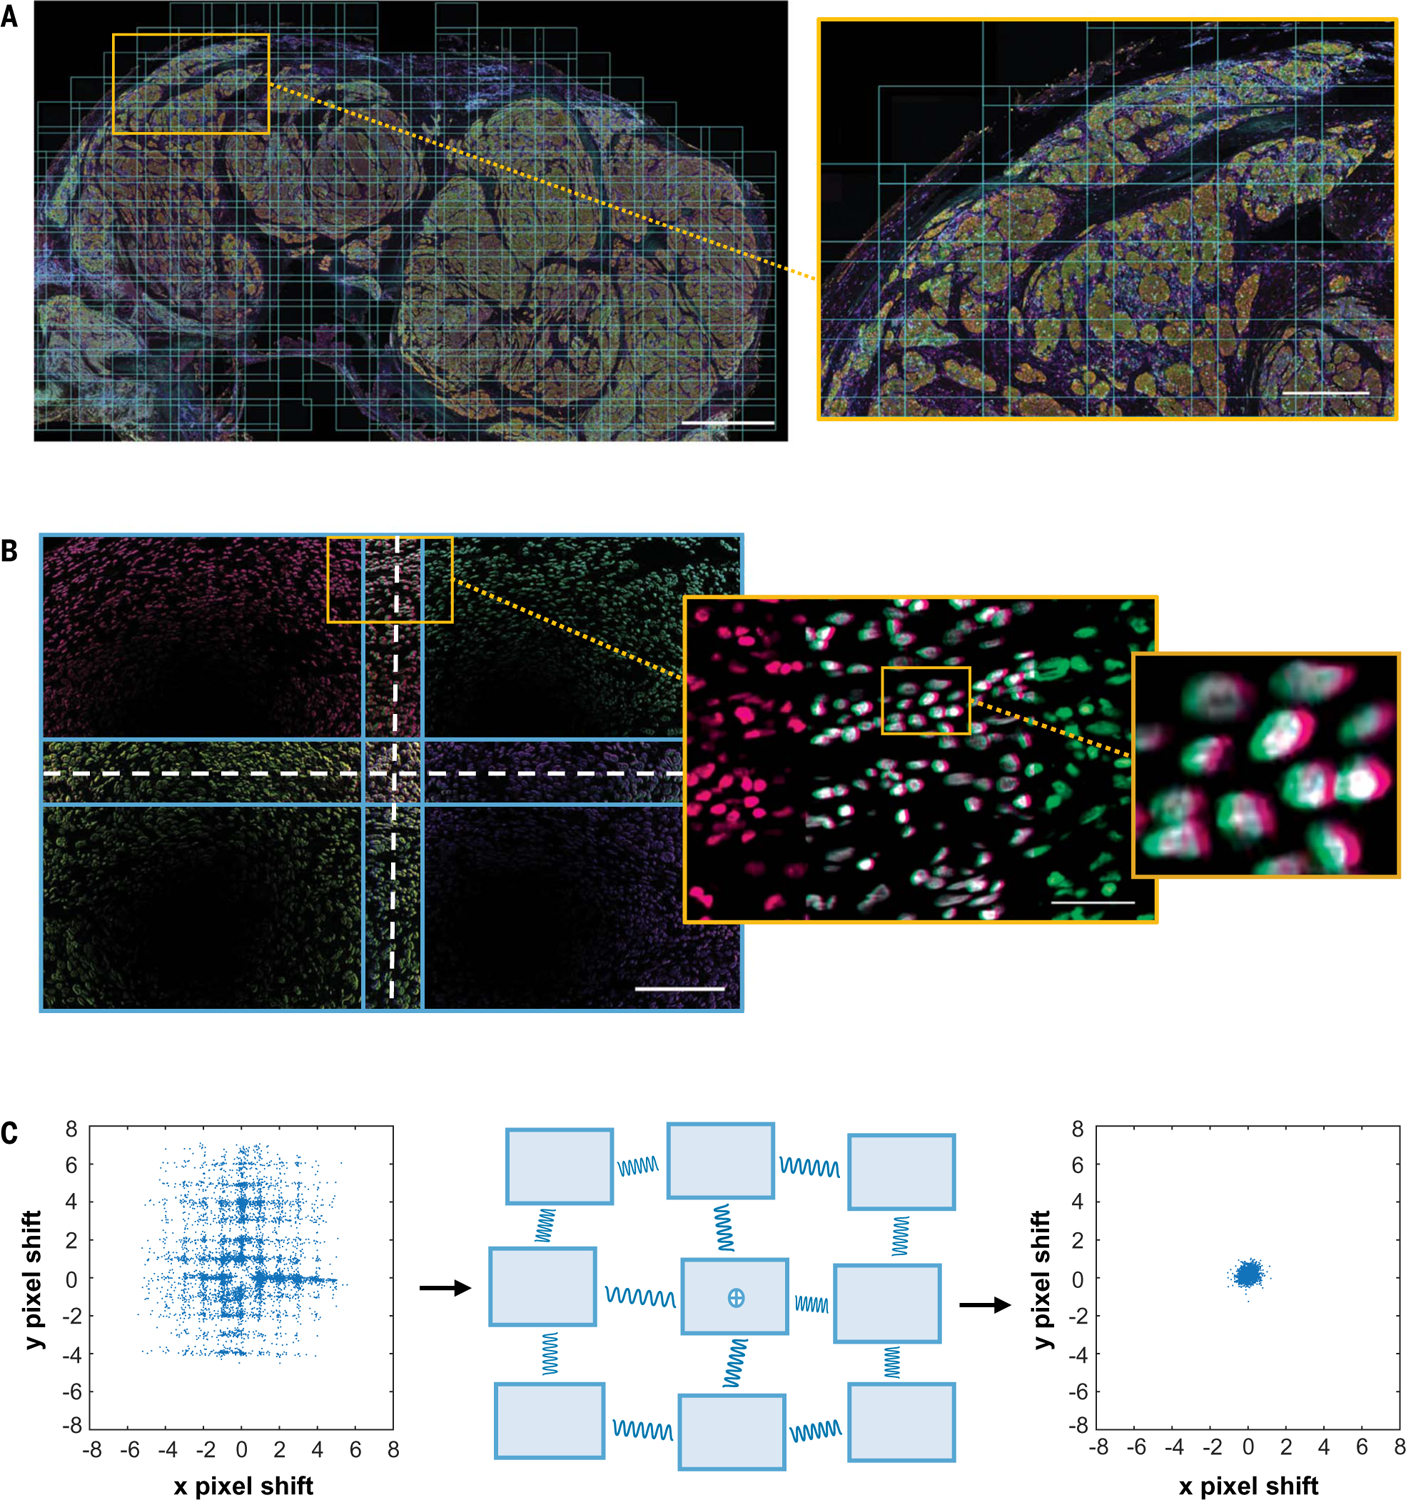
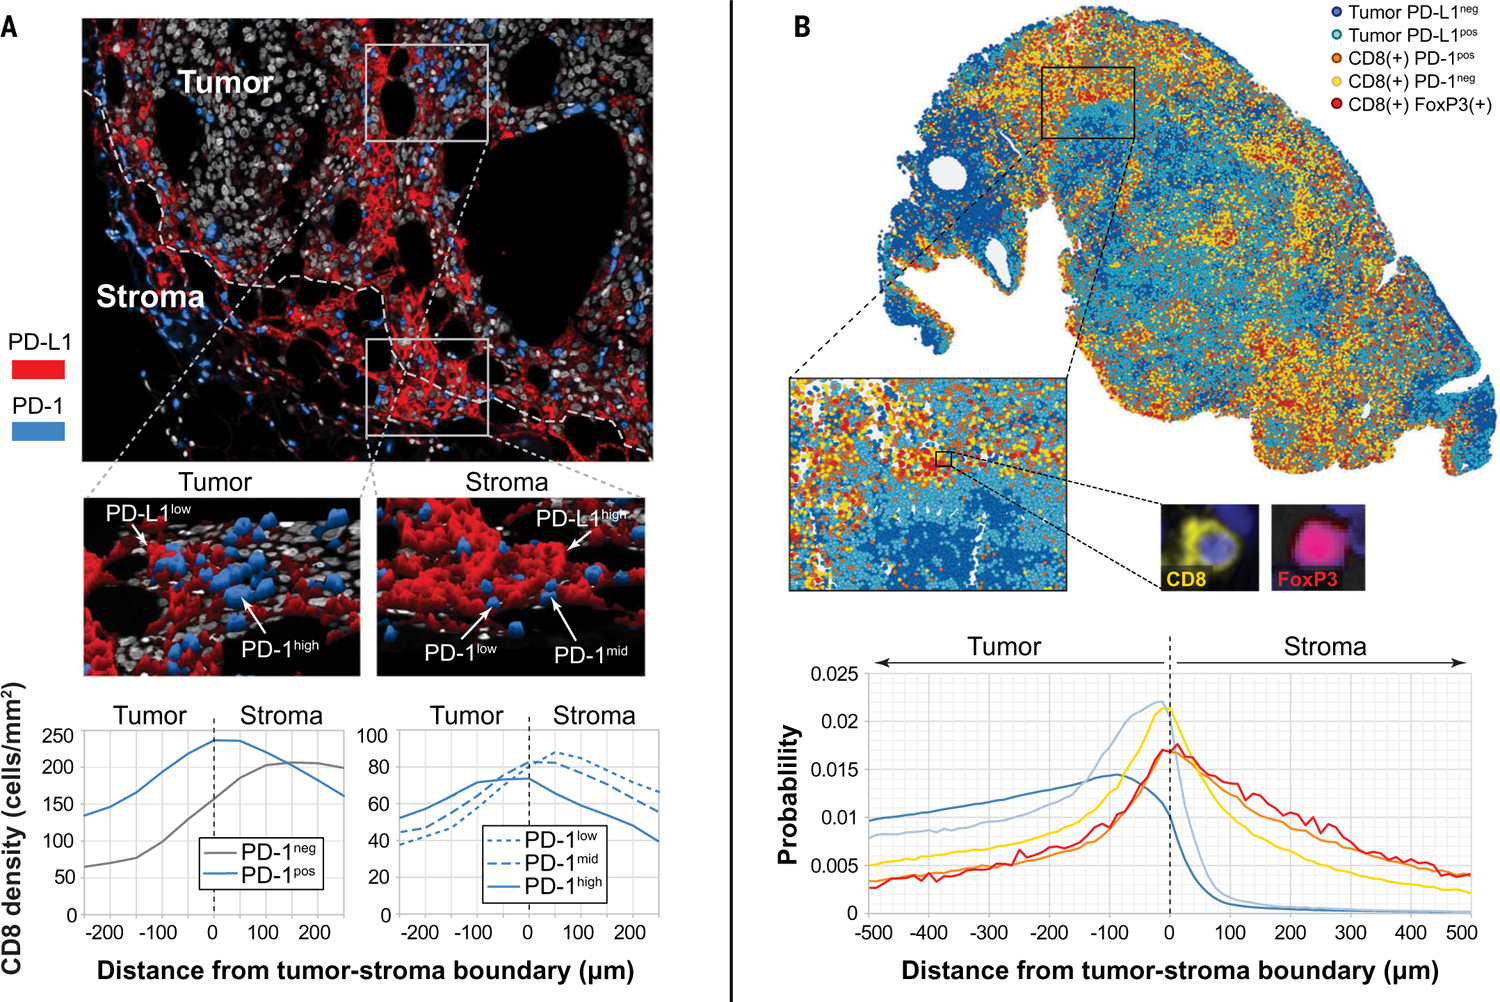
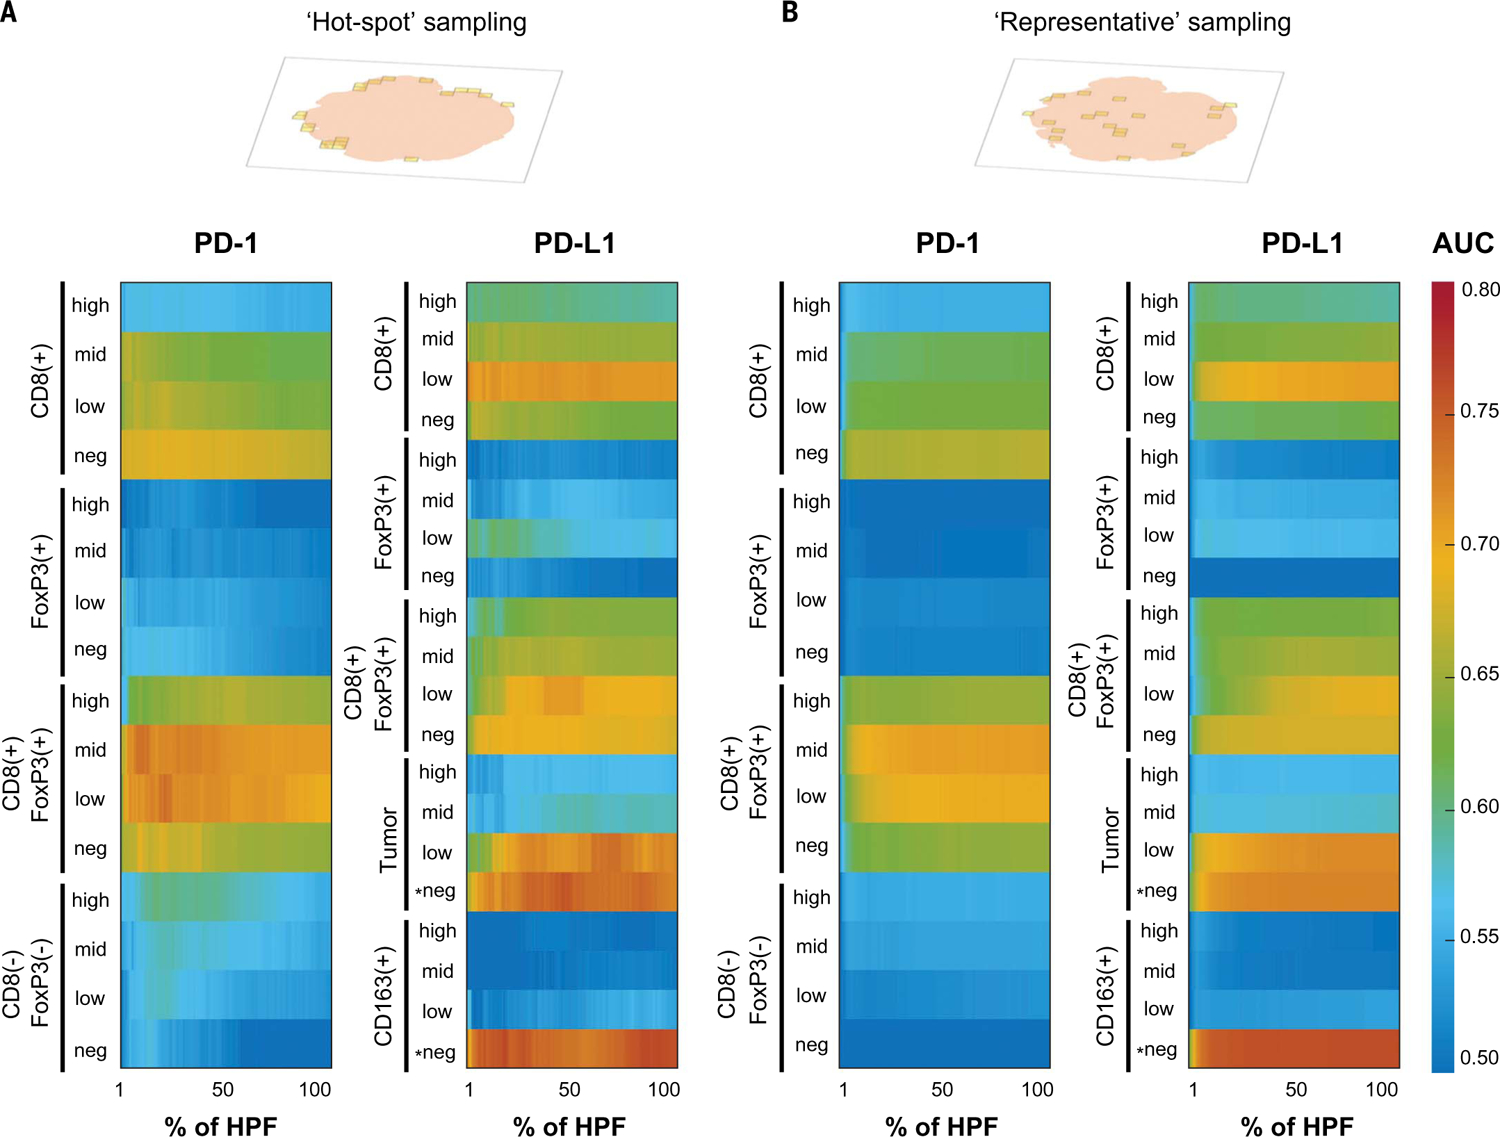
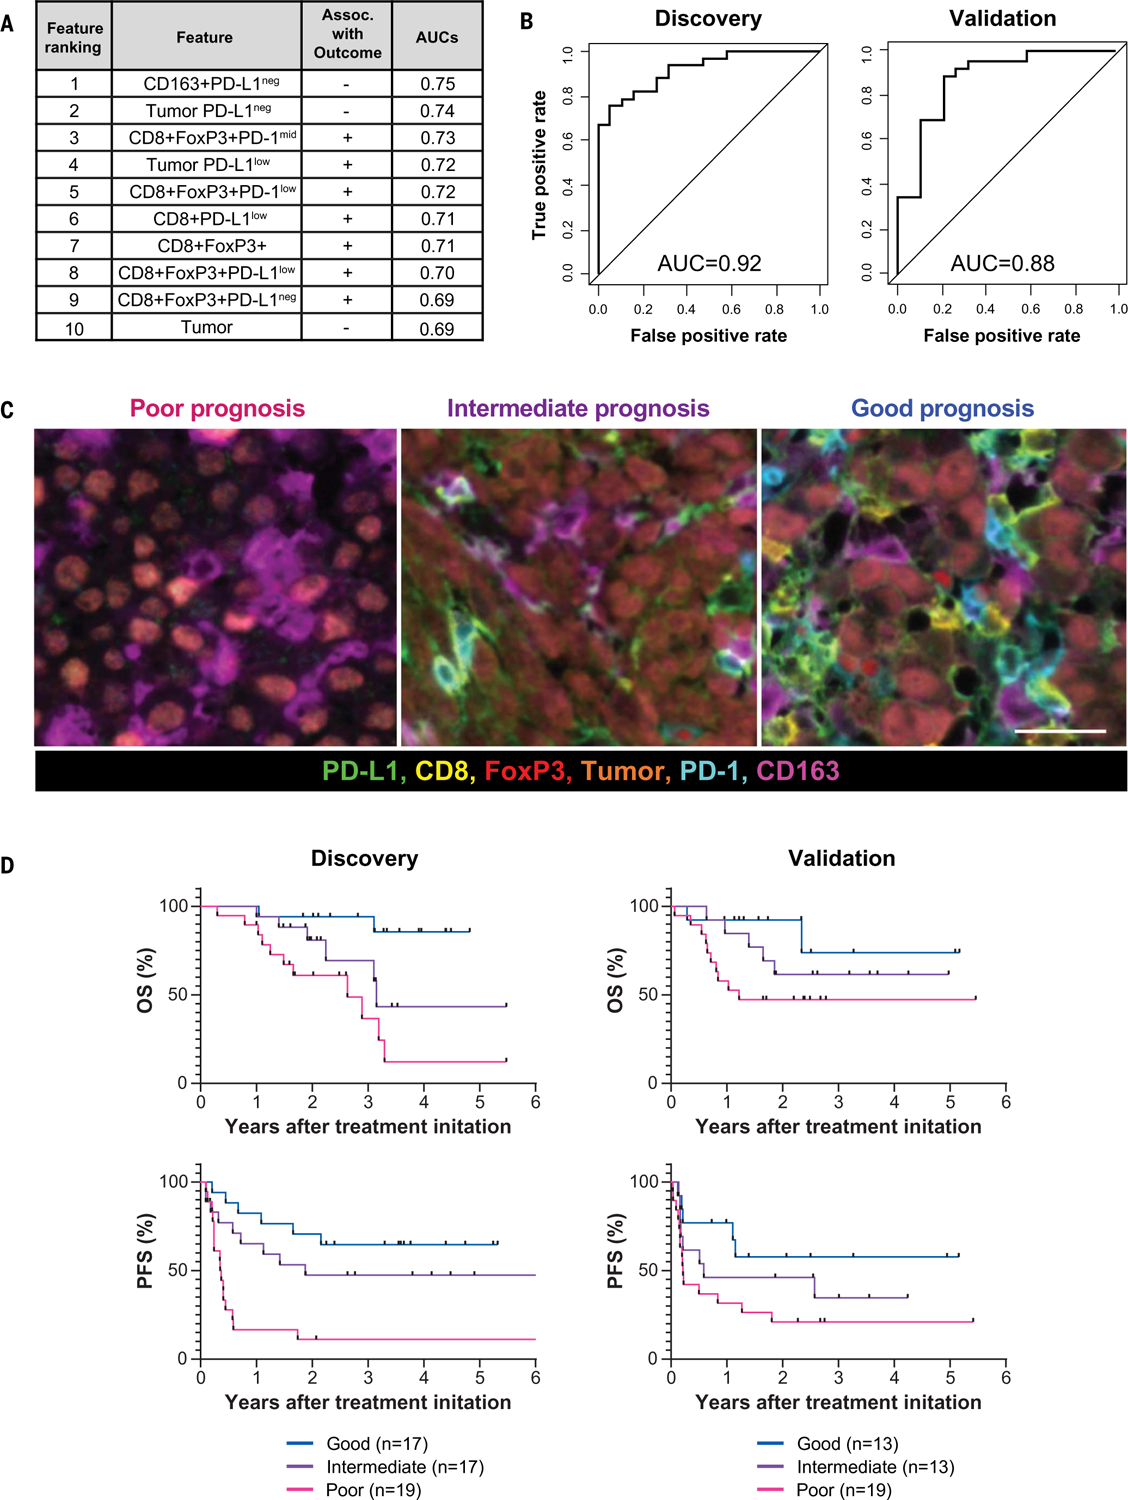
Next-generation tissue-based biomarkers for immunotherapy will likely include the simultaneous analysis of multiple cell types and their spatial interactions, as well as distinct expression patterns of immunoregulatory molecules. Here, we introduce a comprehensive platform for multispectral imaging and mapping of multiple parameters in tumor tissue sections with high-fidelity single-cell resolution. Image analysis and data handling components were drawn from the field of astronomy. Using this "AstroPath" whole-slide platform and only six markers, we identified key features in pretreatment melanoma specimens that predicted response to anti-programmed cell death-1 (PD-1)-based therapy, including CD163+PD-L1- myeloid cells and CD8+FoxP3+PD-1low/mid T cells. These features were combined to stratify long-term survival after anti-PD-1 blockade. This signature was validated in an independent cohort of patients with melanoma from a different institution.


Figures

Fig. 1.
Fig. 1.. AstroPath platform for staining optimization and image processing to generate high-quality datasets.
The optimization of a six-plex assay for characterizing PD-1 and PD-L1 expression (PD-1, PD-L1, CD163, FoxP3, CD8, Sox10/S100, and DAPI) is shown to detail the TSA-based AstroPath workflow of mIF with imaging and associated data usage. Solutions to common limitations and sources of error are outlined. Additional sources of error during multiplex staining and their solutions are provided in Fig. 2. Data usage amounts include the discovery and validation cohorts combined. Scale bars, top to bottom, 70 μm, 1.0 mm, 250 μm, and 12.5 μm.
Fig. 2.
Fig. 2.. Optimization of staining to achieve high sensitivity and specificity by using chromogenic IHC as gold standard.
(A) Staining index (SI) and bleed-through (BT) propensity were used to inform TSA fluorophore-marker pairing. (B) Sensitivity of IF staining was compared with chromogenic IHC. The original signal was decreased in PD-1, PD-L1, and FoxP3 when using the manufacturer’s recommended protocol. The sensitivity was increased by replacing the secondary antibody. Scale bar, 25 μm. (C) Primary antibody dilutions were then performed to optimize the signal-to-noise (S/N) ratio. Representative figure for CD8 IF staining indicates that 1:100 is the optimal dilution. (D) The optimal concentration for each TSA fluorophore was determined next. Only dilutions with equivalent signal to chromogenic IHC (light gray bars) were considered to ensure sensitivity of the assay. To minimize BT between channels, the lowest acceptable TSA concentration was chosen for most markers (CD8/540 in this example). However, where a fluorophore-marker pair is prone to receive BT, the highest acceptable TSA concentration was chosen to raise the threshold of true positivity (for example, FoxP3/570). Check marks represent the dilution that was chosen. (E) For final validation, the detection of each marker in multiplex IF was compared with its respective monoplex IF, confirming equivalence. Photomicrograph shows representative image of optimized multiplex panel. Scale bar, 70 μm. *P ≤ 0.05, **P ≤ 0.01, ***P ≤ 0.001, ****P ≤ 0.0001.
Fig. 3.
Fig. 3.. Minimizing instrumental errors during field acquisition and stitching of whole slide by using lessons from astronomy.
(A) The entire tissue of interest was captured by using HPFs with 20% overlap as shown in the low- and high-power images (average 1300 fields acquired per case). Scale bars, (left) 1.5 mm and (right) 1.0 mm. (B) Each HPF was found to have instrumental imaging errors, including lens distortion and variations in field illumination. Scale bars, (left) 200 μm and (right) 50 μm. (C) Pixels in overlapping image regions were compared to determine the field alignment error. To improve alignment, a spring-based model was used to minimize pixel shift. The misalignment error was reduced from ±3 pixels in the x direction and from ±5 pixels in the y direction, to less than ±1 pixel for both (ranges are reported for the 95th to 5th percentile). The illumination variation was also reduced, from 11.2% variance to 1.2% variance.
Fig. 4.
Fig. 4.. Immune cell populations and marker expression in situ vary by location.
(A) Representative mIF image showing a hotspot at the edge of the tumor with PD-1low T cells adjacent to PD-L1high cells. Within the tumor parenchyma, PD-1high and PD-1mid cells were observed, adjacent to PD-L1low cells, which is consistent with a more exhausted T cell phenotype. Histograms including all cases in the cohort show cell densities of CD8+ cells displaying PD-1 as a function of distance to tumor boundary. PD-1 expression intensity increased as T cells were exposed to tumor antigen. (B) Representative image of a metastatic melanoma deposit showing localization of CD8+FoxP3+ cells in areas of dense CD8+PD-1neg and CD8+PD-1+ cell infiltrates, adjacent to tumor cells demonstrating adaptive (IFN-γ–driven) PD-L1 expression by tumor. Histograms including all cases in the cohort showed that CD8+FoxP3+ cells were most likely to be localized near CD8+PD-1 cells. Other cell types in the same relative location to the tumor-stromal boundary included CD8+PD-1+ cells and PD-L1+ tumor cells.
Fig. 5.
Fig. 5.. AUC heat maps for response to therapy as a function of various immune cell types expressing PD-1/L1 and the intensity of PD-1/L1 expression by using two different slide-sampling strategies.
(A) PD-1/PD-L1 mIF assay combined with hotspot HPF selection showed that the densities of CD8+FoxP3+PD-1low/mid, tumor PD-L1, and CD163+PD-L1 cells had the highest value of individual features for predicting response and nonresponse to anti–PD-1. Approximately 86% of CD8-FoxP3-PD-1pos cells in melanoma represented conventional CD4 T cells (fig. S14). (B) A similar characterization was performed by using representative field sampling and highlighted similar key features associated with response to therapy. However, the resultant AUCs, particularly for the CD8+ cell subsets, were not as high when using this approach. *Tumor PD-L1 and CD163+PD-L1 were negatively associated features; all others were positively associated features.
Fig. 6.
Fig. 6.. Multifactorial analysis of six-plex mIF assay with a focus on PD-1 and PD-L1 intensities for predicting objective response and long-term survival.
(A) The 10 features associated with response to therapy by univariate analysis at 30% hotspot HPFs. Features are listed in decreasing order of predictive value (table S3). (B) Combinatorial receiving operating characteristics (ROC) curves and the corresponding AUC values were assessed for these 10 features in the discovery cohort, as well as a second, independent cohort. (C) (Left) The TME from patients with poor prognosis was characterized by high densities of tumor cells and CD163+ cells that lack PD-L1 expression, irrespective of whether other immune cells were present. (Middle) Those with intermediate prognosis had TMEs with low level immune infiltrates and were not CD163+PD-L1neg myeloid-rich. (Right) The patients with the best prognosis had TMEs that were highly inflamed, characterized by CD8+ and CD8+FoxP3+ T cells expressing various PD-1 and PD-L1 intensities. PD-L1 expression was also evident on CD163+ cells. Scale bar, 20 μm. (D) Distinct TMEs defined by specific cell types displaying differing PD-1 and PD-L1 expression intensities stratified patients into those with poor, intermediate, and good overall survival (OS) and progression-free survival (PFS) in a discovery cohort, Kaplan-Meier analysis. Similar stratification of patient outcomes was achieved by using an independent, validation cohort from a different institution (OS, P = 0.036; PFS, P = 0.024, log-rank test). Similar analyses focused on the whole TME (100% sampling) are presented in fig. S15 and table S4.

Comment in

References

    1. www.fda.gov/drugs/informationondrugs/approveddrugs/ucm279174.htm.
    1. Sunshine J, Taube JM, PD-1/PD-L1 inhibitors. Curr. Opin. Pharmacol 23, 32–38 (2015). doi: 10.1016/j.coph.2015.05.011; - DOI - PMC - PubMed
    1. Taube JM et al., Implications of the tumor immune microenvironment for staging and therapeutics. Mod. Pathol 31, 214–234 (2018). doi: 10.1038/modpathol.2017.156; - DOI - PMC - PubMed
    1. Le DT et al., Mismatch repair deficiency predicts response of solid tumors to PD-1 blockade. Science 357, 409–413 (2017). doi: 10.1126/science.aan6733; - DOI - PMC - PubMed
    1. Rizvi NA et al., Mutational landscape determines sensitivity to PD-1 blockade in non-small cell lung cancer. Science 348, 124–128 (2015). doi: 10.1126/science.aaa1348; - DOI - PMC - PubMed

Publication types

MeSH terms

LinkOut - more resources