. 2021 Jun 10;12(1):3530.
doi: 10.1038/s41467-021-23164-2.

Targeting monoamine oxidase A-regulated tumor-associated macrophage polarization for cancer immunotherapy

Affiliations

Targeting monoamine oxidase A-regulated tumor-associated macrophage polarization for cancer immunotherapy

Yu-Chen Wang et al. Nat Commun. .

Abstract

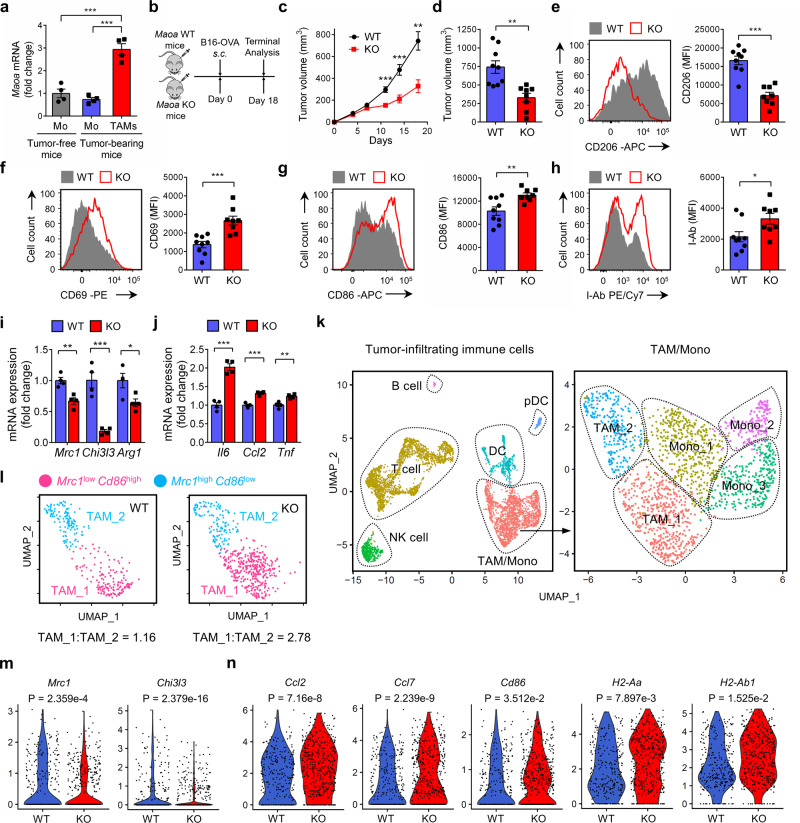
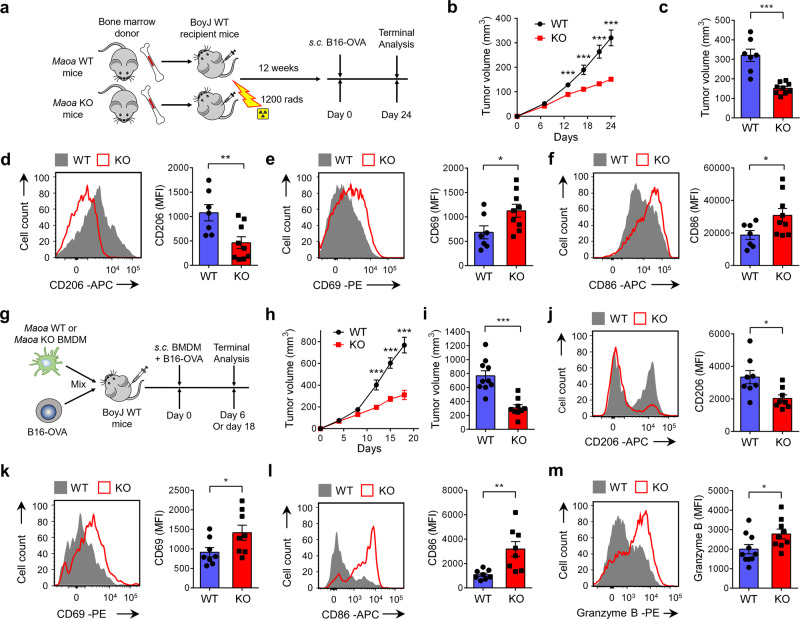
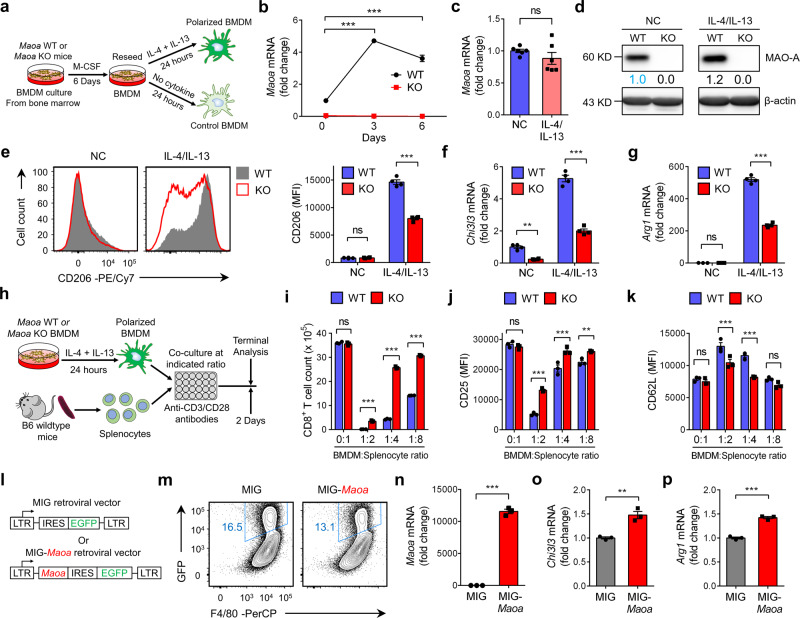
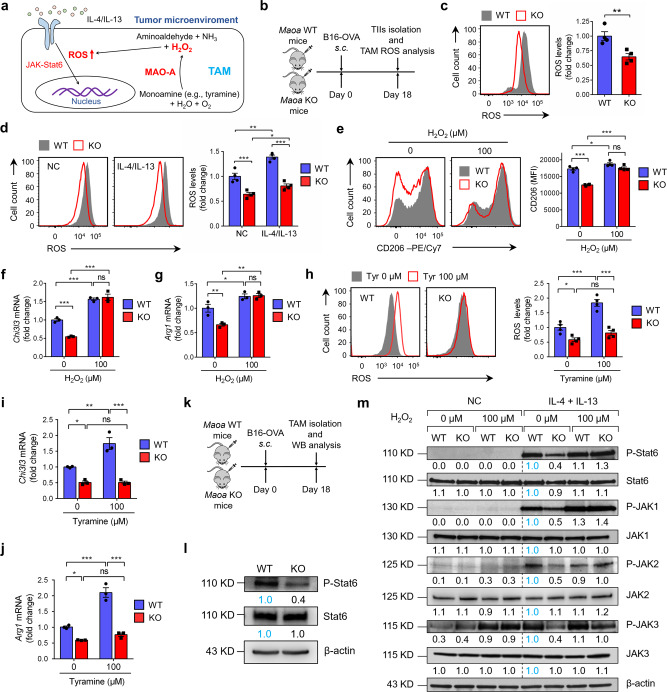
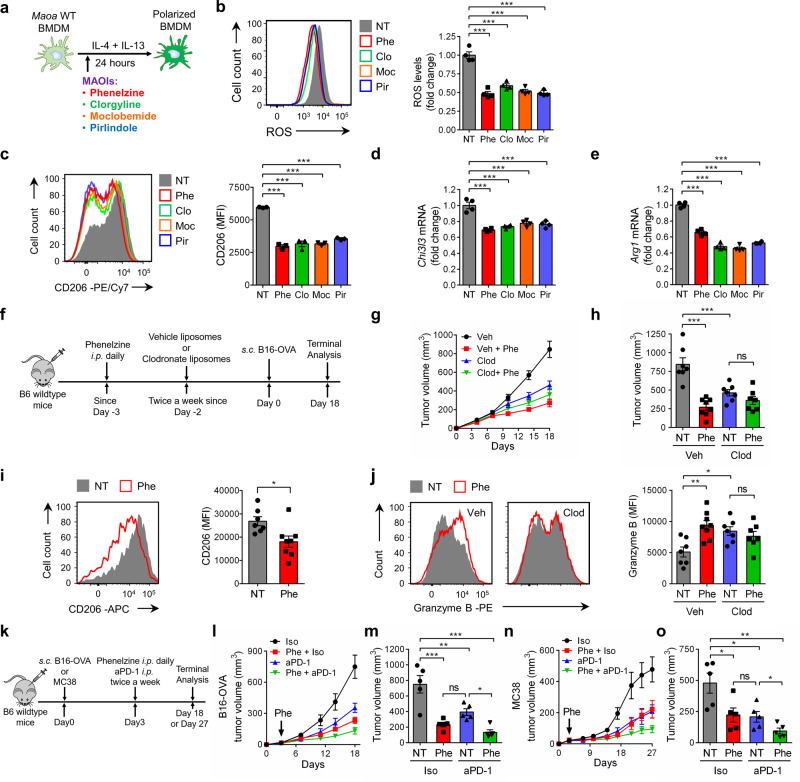
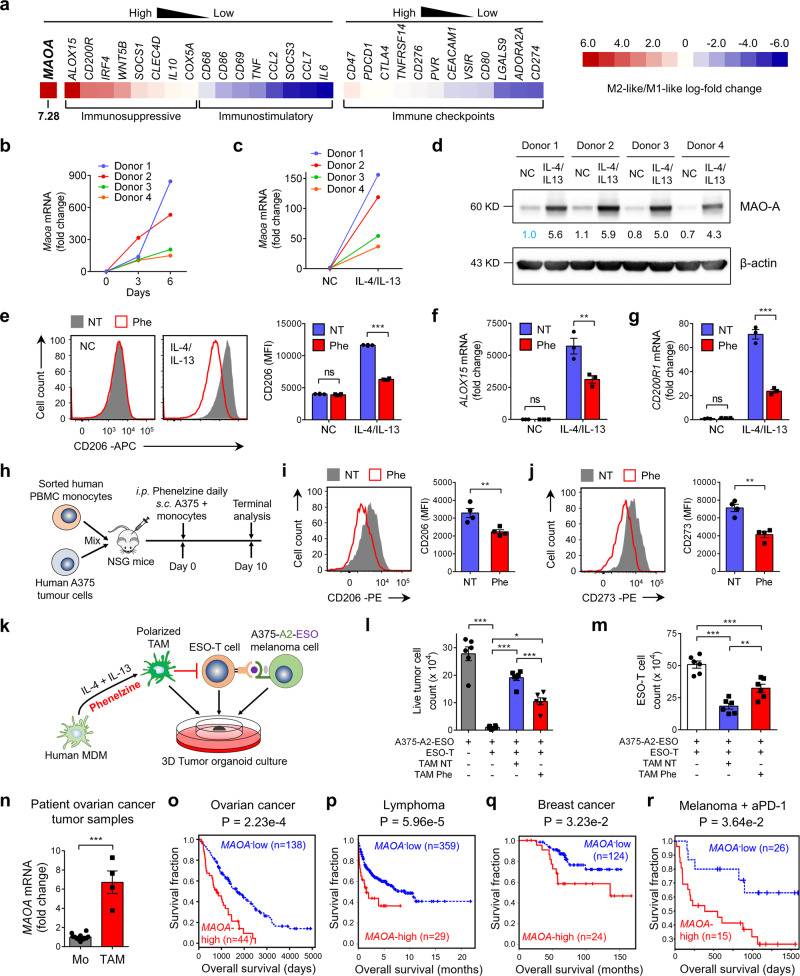
Targeting tumor-associated macrophages (TAMs) is a promising strategy to modify the immunosuppressive tumor microenvironment and improve cancer immunotherapy. Monoamine oxidase A (MAO-A) is an enzyme best known for its function in the brain; small molecule MAO inhibitors (MAOIs) are clinically used for treating neurological disorders. Here we observe MAO-A induction in mouse and human TAMs. MAO-A-deficient mice exhibit decreased TAM immunosuppressive functions corresponding with enhanced antitumor immunity. MAOI treatment induces TAM reprogramming and suppresses tumor growth in preclinical mouse syngeneic and human xenograft tumor models. Combining MAOI and anti-PD-1 treatments results in synergistic tumor suppression. Clinical data correlation studies associate high intratumoral MAOA expression with poor patient survival in a broad range of cancers. We further demonstrate that MAO-A promotes TAM immunosuppressive polarization via upregulating oxidative stress. Together, these data identify MAO-A as a critical regulator of TAMs and support repurposing MAOIs for TAM reprogramming to improve cancer immunotherapy.


Conflict of interest statement

L.Y., Y-C.W. and X.W. are inventors on patents relating to this study filed by UCLA. The remaining authors declare no competing interests.

Figures

Fig. 1
Fig. 1. MAO-A-deficient mice show reduced tumor growth associated with altered TAM polarization.
a QPCR analyses of Maoa mRNA expression in TAMs isolated from wild-type mice-bearing B16-OVA tumors. Monocytes (Mo) were isolated from peripheral blood of tumor-free and tumor-bearing mice (***p < 0.001). N = 4. bj Studying B16-OVA tumor growth in Maoa WT and Maoa KO mice. b Experimental design. c Tumor growth (**p = 0.0038, ***p < 0.001). d Tumor volume at day 18 (**p = 0.0038). eh FACS analyses of CD206 (e) (***p < 0.001), CD69 (f) (***p < 0.001), CD86 (g) (**p = 0.0064) and I-Ab (h) (*p = 0.0275) expression on TAMs at day 18. WT, n = 9; KO, n = 8. MFI mean fluorescence intensity. i, j QPCR analyses of immunosuppressive (Mrc1, **p = 0.0041; Chi3l3, ***p < 0.001 and Arg1, *p = 0.0339; i) and immunostimulatory (Il6, ***p < 0.001; Ccl2, ***p < 0.001 and Tnf, **p = 0.0036; j) signature genes mRNA expression in TAMs (n = 4). kn scRNAseq analyses of tumor-infiltrating immune cells (TIIs) from Maoa WT and Maoa KO mice at day 14 post B16-OVA tumors challenge. k Uniform Manifold Approximation and Projection (UMAP) of single TIIs showing the formation of six cell clusters (TAM/Mono, T cell, NK cell, B cell, DC and pDC) from total CD45.2+ TIIs and five cell clusters (TAM_1, TAM_2, Mono_1, Mono_2 and Mono_3) from the TAM/Mono subpopulation. Each dot represents one single cell and is coloured according to cell types. Mono monocyte, NK natural killer cell, DC dendritic cell, pDC plasmacytoid dendritic cell. l UMAP of the TAM subpopulation, showing the formation of two clusters (TAM_1: Mrc1lowCd86high; and TAM_2: Mrc1highCd86low). Each dot represents one single cell and is coloured according to cell clusters. Ratios of TAM_1:TAM_2 are presented. m, n Violin plots of immunosuppressive (Mrc1 and Chi3l3; m) and immunostimulatory (Ccl2, Ccl7, Cd86, H2-Aa, and H2-Ab1; n) signature genes expression in single TAMs. Each dot represents an individual cell. Representative of 1 (kn), 3 (a), and 5 (bj) experiments. Analysed by one-way ANOVA (a) or by Student’s t test (cj). p values of violin plots are determined by Wilcoxon rank-sum test (m, n). Statistics are all two-sided. Source data are provided as a Source Data file.
Fig. 2
Fig. 2. MAO-A directly regulates TAM polarization and influences TAM-associated antitumor T-cell reactivity.
af Studying B16-OVA tumor growth and TAM phenotype in BoyJ (CD45.1) wild-type mice reconstituted with bone marrow cells isolated from either Maoa WT or Maoa KO donor mice (denoted as WT or KO experimental mice, respectively). a Experimental design. b Tumor growth (***p < 0.001). c Tumor volume at day 24 (***p < 0.001). df FACS analyses of CD206 (d) (**p = 0.0087), CD69 (e) (*p = 0.0349) and CD86 (*p = 0.0429). f Expression on TAMs at day 24. WT, n = 7; KO, n = 9. gm Studying B16-OVA tumor growth and antitumor T-cell reactivity in a tumor-TAM co-inoculation in vivo experiment. BoyJ wild-type mice received s.c. inoculation of B16-OVA tumor cells mixed with either Maoa WT or Maoa KO BMDMs (denoted as WT or KO experimental mice, respectively). BMDM bone marrow-derived macrophage. g Experimental design. h Tumor growth (n = 9–10) (***p < 0.001). i Tumor volume at day 18 (***p < 0.001). WT, n = 10; KO, n = 9. j, l FACS analyses of CD206 (j) (*p = 0.0139), CD69 (k) (*p = 0.0443) and CD86 (l) (**p = 0.0047) expression on CD45.2+ TAMs at day 6 (n = 8). m FACS analyses of intracellular Granzyme B production in tumor-infiltrating CD45.1+CD8+ T cells at day 18 (*p = 0.0371) (WT, n = 10; KO, n = 9). Representative of three experiments. Analysed by Student’s t test. Statistics are all two-sided. Source data are provided as a Source Data file.
Fig. 3
Fig. 3. MAO-A promotes macrophage immunosuppressive polarization.
ag Studying the in vitro differentiation and IL-4/IL-13-induced polarization of Maoa WT (WT) and Maoa KO (KO) BMDMs. a Experimental design. b, c QPCR analyses of Maoa mRNA expression over the 6-day BMDM differentiation culture (b) (***p < 0.001) and IL-4/IL-13-induced polarization (c) (n = 6). d Western blot analyses of MAO-A protein expression in the indicated BMDMs. Source data are provided as a Source Data file. e FACS analyses of CD206 expression on the indicated BMDMs (***p < 0.001) (n = 4). f, g QPCR analyses of Chi3l3 (f) (NC, **p = 0.0023; IL-4/IL-13, ***p < 0.001) and Arg1 (g) (***p < 0.001) mRNA expression in the indicated BMDMs (n = 4). NC no cytokine control BMDMs, IL-4/IL-13 IL-4 and IL-13-polarized BMDMs, ns not significant. hk Studying the T-cell suppression function of Maoa WT (WT) and Maoa KO (KO) IL-4/IL-13-polarized BMDMs in an in vitro macrophage/T-cell co-culture assay (n = 3). h Experimental design. i FACS quantification of CD8+ T cells (identified as TCRβ+CD4-CD8+ cells) (***p < 0.001). j, k FACS analyses of CD25 (j) (1:2, ***p < 0.001; 1:4, ***p < 0.001; 1:8, **p = 0.0038) and CD62L (k) (***p < 0.001) expression on CD8+ T cells. lp Studying the IL-4/IL-13-induced polarization of Maoa KO BMDMs with MAO-A overexpression (n = 3). In vitro-cultured Maoa KO BMDMs were transduced with either a MIG-Maoa retrovector or a MIG mock retrovector, polarized with IL-4/IL-13, followed by FACS sorting of GFP+ Maoa KO BMDMs for further analyses. l Schematics of the MIG and MIG-Maoa retrovectors. m FACS analyses of prior-to-sorting Maoa KO BMDMS, showing retrovector transduction efficiency (measured as %GFP+ cells). np QPCR analyses of sorted GFP+ Maoa KO BMDMs, showing the mRNA expression of Maoa (n) (***p < 0.001), Chi3l3 (o) (**p = 0.0038), and Arg1 (p) (***p < 0.001). Representative of three (hk, lp) and four (ag) experiments. ns not significant. Analysed by one-way ANOVA (b), two-way ANOVA (eg, ik) or by Student’s t test (c, np). Statistics are all two-sided. Source data are provided as a Source Data file.
Fig. 4
Fig. 4. MAO-A promotes macrophage immunosuppressive polarization via ROS upregulation.
a Schematics showing MAO-A breaks down monoamines and generates hydrogen peroxide (H2O2) as a by-product, thereby increasing reactive oxygen species (ROS) levels in a TAM. b, c Studying the in vivo ROS levels in TAMs isolated from Maoa WT and Maoa KO mice-bearing B16-OVA tumors (n = 4). b Experimental design. c FACS analyses of ROS levels in TAMs at day 18. TAMs were gated as the CD45.2+CD11b+Ly6GLy6C-/lowF4/80+ cells of total TIIs (**p = 0.0088). d FACS analyses of ROS levels in in vitro-cultured Maoa WT and Maoa KO BMDMs, without or without IL-4/IL-13 polarization (n = 4). NC no cytokine, IL-4/IL-13 IL-4/IL-13-polarized. *p < 0.05, **p < 0.01 and ***p < 0.001. eg Study of IL-4/IL-13-polarized Maoa WT and Maoa KO BMDMs, with or without H2O2 treatment (n = 3). e FACS analyses of CD206 expression. f, g QPCR analyses of Chi3l3 (f) and Arg1 (g) mRNA expression. *p < 0.05, **p < 0.01 and ***p < 0.001. hj Study of IL-4/IL-13-polarized Maoa WT and Maoa KO BMDMs, with or without tyramine supplement (n = 3). h FACS analyses of ROS levels. i, j QPCR analyses of Chi3l3 (i) and Arg1 (j) mRNA expression. *p < 0.05, **p < 0.01 and ***p < 0.001. k, l Study of TAMs isolated from Maoa WT and Maoa KO mice-bearing B16-OVA tumors at day 18 (combined from five mice per group). k Experimental design. l Western blot analyses of TAMs. TAMs were FACS sorted as the DAPICD45.2+CD11b+Ly6GLy6C−/lowF4/80+ cells from total TIIs. Source data are provided as a Source Data file. m Western blot analyses of JAK-Stat6 signalling in Maoa WT and Maoa KO BMDMs, with or without IL-4/IL-13 polarization and H2O2 treatment. BMDMs were treated with H2O2 for 30 min prior to IL-4/IL-13 stimulation for another 30 min. Representative of three experiments. Analysed by two-way ANOVA (dj) or by Student’s t test (c). Statistics are all two-sided. Source data are provided as a Source Data file.
Fig. 5
Fig. 5. MAO-A blockade for cancer immunotherapy—syngeneic mouse tumor model studies.
ae Studying the effect of MAOI treatment on IL-4/IL-13-induced BMDM polarization in vitro (n = 4). a Experimental design. Wild-type BMDMs were stimulated with IL-4/IL-13 with or without MAOI treatment. MAOIs (monoamine oxidase inhibitors) studied were phenelzine (Phe; 20 μM), clorgyline (Clo; 20 μM), moclobemide (Moc; 200 μM), and pirlindole (Pir; 20 μM). NT no MAOI treatment. b FACS analyses of ROS levels in BMDMs. c FACS analyses of CD206 expression on BMDMs. d, e QPCR analyses of Chi3l3 (d) and Arg1 (e) mRNA expression in BMDMs. ***p < 0.001. fj Studying the TAM-related cancer immunotherapy potential of MAOI treatment in a B16-OVA melanoma syngeneic mouse tumor model. f Experimental design. B6 wild-type mice were treated with clodronate liposomes (Clod) to serve as TAM-depleted experimental mice or treated with vehicle liposomes (Veh) to serve as TAM-intact control mice. Phe phenelzine treatment, NT no phenelzine treatment. g Tumor growth. h Tumor volume at day 18 (***p < 0.001). i FACS analyses of CD206 expression on TAMs of TAM-intact experimental mice (*p = 0.0164). j FACS analyses of intracellular Granzyme B production in tumor-infiltrating CD8+ T cells of all experimental mice (NT, *p = 0.0257; Veh, **p = 0.0025). Veh NT, n = 7; Veh Phe, n = 8; Clod NT, n = 7; Clod Phe, n = 7. ko Studying the cancer therapy potential of MAOI treatment in combination with anti-PD-1 treatment in the B16-OVA melanoma and MC38 colon cancer syngeneic mouse tumor models (n = 5). k Experimental design. Tumor-bearing mice were treated with anti-PD-1 antibody (aPD-1) or isotype control (Iso), together with or without phenelzine (Phe) treatment. NT no Phe treatment. l B16-OVA tumor growth. m B16-OVA tumor volume at day 18. n MC38 tumor growth. o MC38 tumor volume at day 27. *p < 0.05, **p < 0.01 and ***p < 0.001. Representative of three experiments. Analysed by one-way ANOVA (be, h, j, m, o) or by Student’s t test (i). Statistics are all two-sided. Source data are provided as a Source Data file.
Fig. 6
Fig. 6. MAO-A blockade for cancer immunotherapy—human TAM and clinical data correlation studies.
a Heatmap showing the mRNA expression fold change of the indicated genes in human M2-like/M1-like macrophages. bd Studying the MAO-A expression in in vitro-cultured human monocyte-derived macrophages (MDMs) (n = 4). b, c QPCR analyses of MAOA mRNA expression in MDMs over the 6-day differentiation culture (b) and post the IL-4/IL-13-induced polarization (c). d Western blot analyses of MAO-A protein expression in IL-4/IL-13-polarized MDMs. eg Studying the IL-4/IL-13-induced polarization of human MDMs (n = 3). e FACS analyses of CD206 expression (***p < 0.001). f, g QPCR analyses of ALOX15 (f) (**p = 0.0012) and CD200R1 (g) (***p < 0.001) mRNA expression. hj Studying the in vivo polarization of human macrophages in a human tumor-TAM co-inoculation xenograft mouse model (n = 4). h Experimental design. i, j FACS analyses of CD206 (i) (**p = 0.0093) and CD273 (j) (**p = 0.0013) expression on TAMs (gated as hCD45+hCD11b+hCD14+ cells of TIIs). km Studying the in vitro efficacy of phenelzine in reprogramming human TAMs and enhancing human T-cell antitumor reactivity (n = 6). k Experimental design. l, m FACS quantification of live tumor cells (gated as hCD45 cells) and ESO-T cells (gated as hCD45+hCD8+ESO-TCR+ cells). NT no phenelzine treatment. *p < 0.05, **p < 0.01 and ***p < 0.001. n QPCR analyses of MAOA mRNA expression in human TAMs isolated from ovarian cancer patient tumor samples (n = 4). Mo, monocytes isolated from random healthy donor peripheral blood (n = 10). ***p < 0.001. or Clinical data correlation studies. Kaplan–Meier plots are presented, showing the association between the intratumoral MAOA gene expression levels and overall survival (OS) of cancer patients, in an ovarian cancer patient cohort (GSE26712, n = 182; o), a lymphoma patient cohort (GSE10846, n = 388; p), a breast cancers patient cohort (GSE9893, n = 148; q) and a melanoma patient cohort with anti-PD-1 therapy (PRJEB23709, n = 41; r). Phe phenelzine, NC no cytokine stimulation, NT no phenelzine treatment. Representative of one (n), two (bd, hj) and three (eg, km) experiments. Analysed by one-way ANOVA (l, m), two-way ANOVA (eg), Student’s t test (i, j, n), or by two-sided Wald test in a Cox-PH regression (or). Statistics are all two-sided. Source data are provided as a Source Data file.

References

    1. Jenkins RW, Thummalapalli R, Carter J, Canadas I, Barbie DA. Molecular and genomic determinants of response to immune checkpoint inhibition in cancer. Annu. Rev. Med. 2018;69:333–347. doi: 10.1146/annurev-med-060116-022926. - DOI - PubMed
    1. Ribas A. Releasing the brakes on cancer immunotherapy. N. Engl. J. Med. 2015;373:1490–1492. doi: 10.1056/NEJMp1510079. - DOI - PubMed
    1. Topalian SL, et al. Safety, activity, and immune correlates of anti-PD-1 antibody in cancer. N. Engl. J. Med. 2012;366:2443–2454. - PMC - PubMed
    1. Dougan M, Dranoff G, Dougan SK. Cancer immunotherapy: beyond checkpoint blockade. Annu. Rev. Cancer Biol. 2019;3:55–75. doi: 10.1146/annurev-cancerbio-030518-055552. - DOI - PMC - PubMed
    1. Sharpe AH. Introduction to checkpoint inhibitors and cancer immunotherapy. Immunol. Rev. 2017;276:5–8. doi: 10.1111/imr.12531. - DOI - PMC - PubMed

Publication types

MeSH terms