. 2021 Jun 10;12(1):3546.
doi: 10.1038/s41467-021-22910-w.

Rapid detection of identity-by-descent tracts for mega-scale datasets

Affiliations

Rapid detection of identity-by-descent tracts for mega-scale datasets

Ruhollah Shemirani et al. Nat Commun. .

Abstract

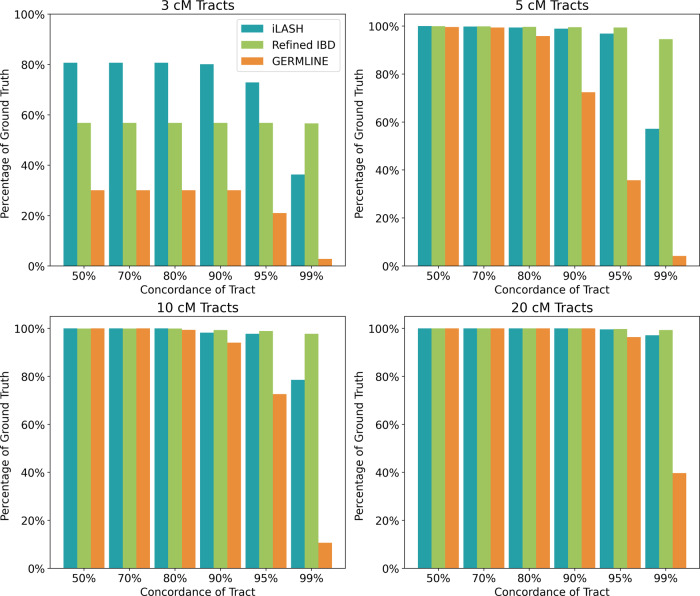
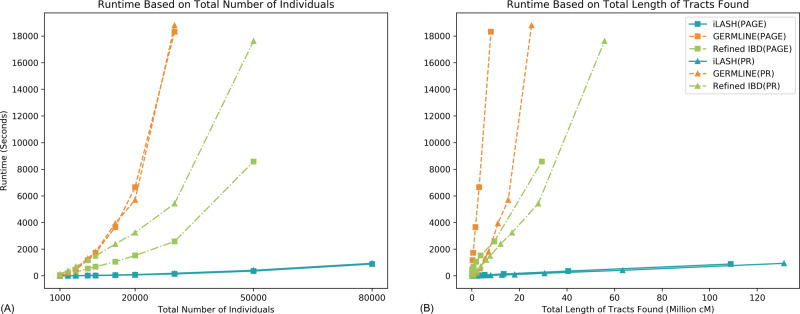
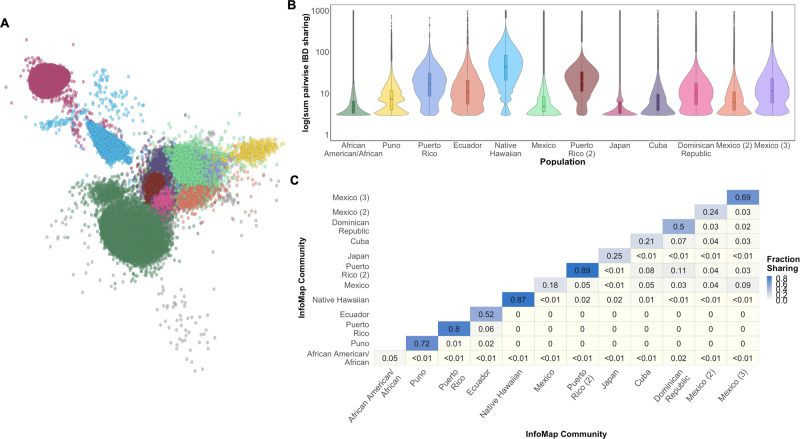
The ability to identify segments of genomes identical-by-descent (IBD) is a part of standard workflows in both statistical and population genetics. However, traditional methods for finding local IBD across all pairs of individuals scale poorly leading to a lack of adoption in very large-scale datasets. Here, we present iLASH, an algorithm based on similarity detection techniques that shows equal or improved accuracy in simulations compared to current leading methods and speeds up analysis by several orders of magnitude on genomic datasets, making IBD estimation tractable for millions of individuals. We apply iLASH to the PAGE dataset of ~52,000 multi-ethnic participants, including several founder populations with elevated IBD sharing, identifying IBD segments in ~3 minutes per chromosome compared to over 6 days for a state-of-the-art algorithm. iLASH enables efficient analysis of very large-scale datasets, as we demonstrate by computing IBD across the UK Biobank (~500,000 individuals), detecting 12.9 billion pairwise connections.


Conflict of interest statement

The authors declare no competing interests.

Figures

Fig. 1
Fig. 1. iLASH pipeline.
Schematic of the iLASH algorithm pipeline. Starting from the top left with the Slicing step (A) where haplotypes are broken into slices (segments of uniform or variable length). The Minhashing step (B) creates minhash signatures by generating a table of random permutations. The LSH step (C) bands together minhash values to create an integrated LSH hash table where candidate matches are grouped together. Finally, in the Pairwise Extension step (D), these candidates are further analyzed to be extended in the (likely) case that an IBD tract spans multiple windows.
Fig. 2
Fig. 2. Accuracy of IBD estimation tools in simulated data.
Accuracy of iLASH, GERMLINE, and Refined IBD on simulated data (30000 samples derived from the Puerto Rican population in the PAGE study sharing 3,660,900 IBD segments) at tract lengths of 3, 5, 10, and 20 cM and accuracies from 50 to 99%. The displayed percentages are based on the total number of IBD tracts with the specified length. Source data are provided as a Source Data file.
Fig. 3
Fig. 3. Comparison of runtimes among algorithms.
IBD computation runtime in seconds for iLASH, Refined IBD, and GERMLINE on synthesized haplotypic data simulating all of PAGE and Puerto Rican (PR) populations IBD patterns: (A) as the number of individuals grows, (B) as the total output (total length of tracts found) grows. Source data are provided as a Source Data file.
Fig. 4
Fig. 4. Network of IBD sharing in the PAGE dataset.
A A network of IBD sharing within PAGE plotted via the Fruchterman Reingold algorithm. Each node represents an individual (edges not shown). Individuals are colored based on community membership as inferred by the InfoMap algorithm. B Distribution of the sum of IBD sharing within the top 16 largest InfoMap communities demonstrates variance in levels of IBD sharing between different communities. Boxplots inlayed within violins depict the median and interquartile range of the within-community sum of pairwise IBD sharing (cM), while the minimal and maximal values per distribution are represented by the extreme tails of the violin plot. InfoMap communities are labeled according to the demographic label that most strongly correlated with community membership (as measured by positive predictive value). Elevated pairwise IBD sharing can be observed in several InfoMap communities, which may represent founder effects. C Heatmap of the population level fraction of IBD sharing within and between the top 16 largest InfoMap communities demonstrates elevated sharing within, relative to between communities.
Fig. 5
Fig. 5. Identity-by-descent sharing in the UK biobank.
A Distribution of the sum of pairwise IBD sharing (cM) in the UK Biobank across all N = 487,330 participants. B Correlation between the sum of IBD sharing and kinship as measured by the KING software in all pairs of individuals reported in the UK Biobank output to be > = 3rd degree relatives.

References

    1. Carmi S, et al. The variance of identity-by-descent sharing in the Wright-Fisher model. Genetics. 2013;193:911–928. doi: 10.1534/genetics.112.147215. - DOI - PMC - PubMed
    1. Erlich Y, Shor T, Pe’er I, Carmi S. Identity inference of genomic data using long-range familial searches. Science. 2018;362:690–694. doi: 10.1126/science.aau4832. - DOI - PMC - PubMed
    1. Palamara PF, Lencz T, Darvasi A, Pe’er I. Length distributions of identity by descent reveal fine-scale demographic history. Am. J. Hum. Genet. 2012;91:809–822. doi: 10.1016/j.ajhg.2012.08.030. - DOI - PMC - PubMed
    1. Browning SR, Browning BL. Accurate non-parametric estimation of recent effective population size from segments of identity by descent. Am. J. Hum. Genet. 2015;97:404–418. doi: 10.1016/j.ajhg.2015.07.012. - DOI - PMC - PubMed
    1. Browning SR, Browning BL. Identity by descent between distant relatives: detection and applications. Annu Rev. Genet. 2012;46:617–633. doi: 10.1146/annurev-genet-110711-155534. - DOI - PubMed

Publication types