. 2021 Jun 10;12(1):3539.
doi: 10.1038/s41467-021-23906-2.

Ventral tegmental area GABA neurons mediate stress-induced blunted reward-seeking in mice

Affiliations

Ventral tegmental area GABA neurons mediate stress-induced blunted reward-seeking in mice

Daniel C Lowes et al. Nat Commun. .

Abstract

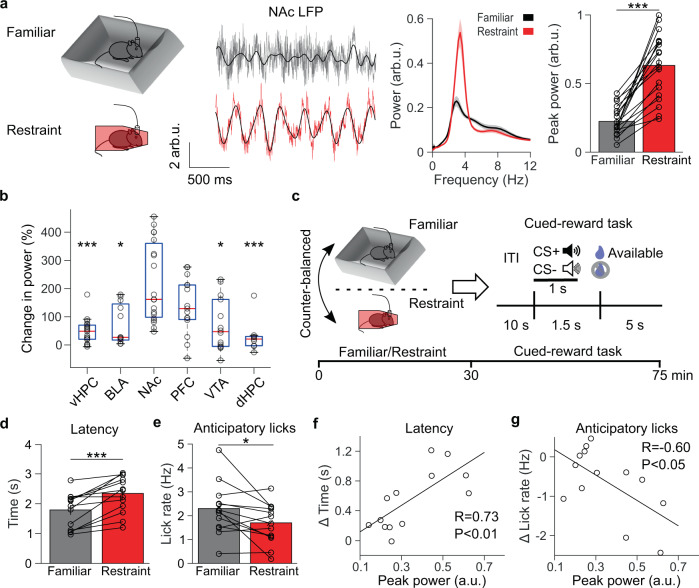
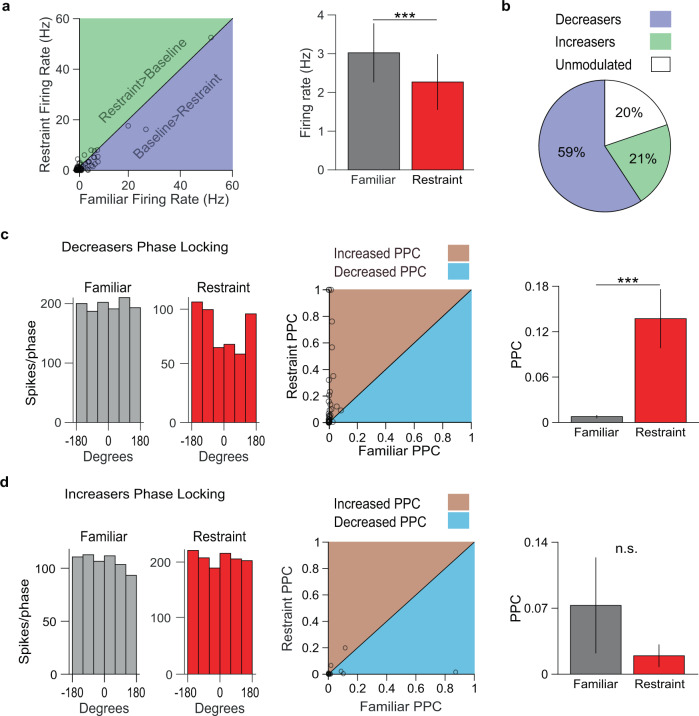
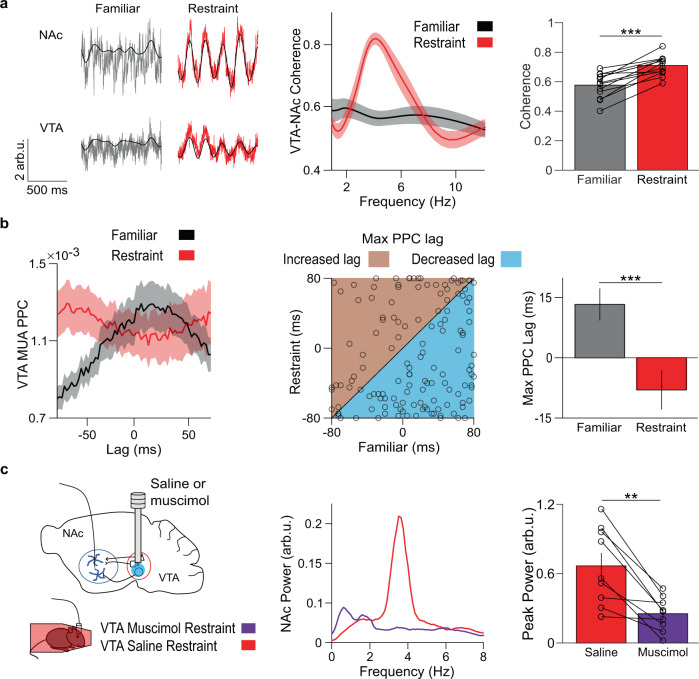
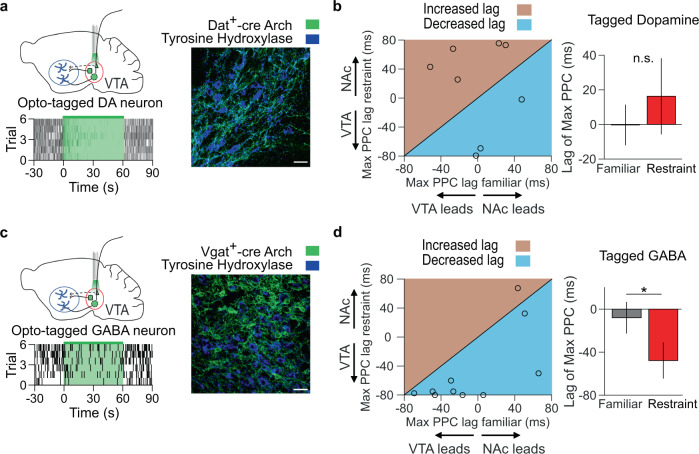
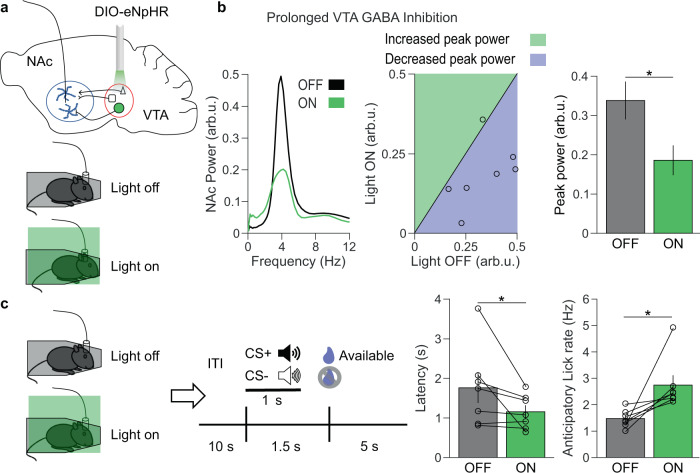
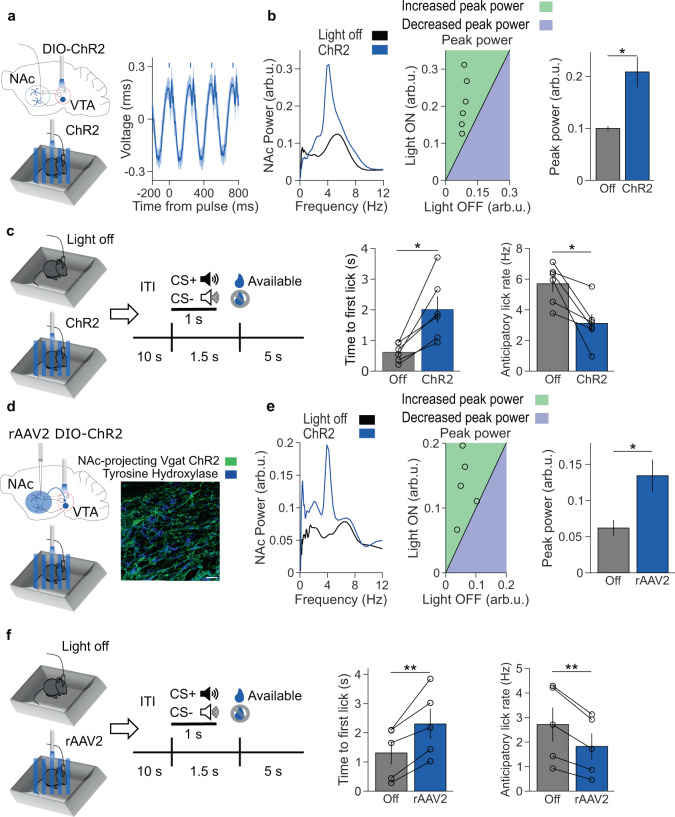
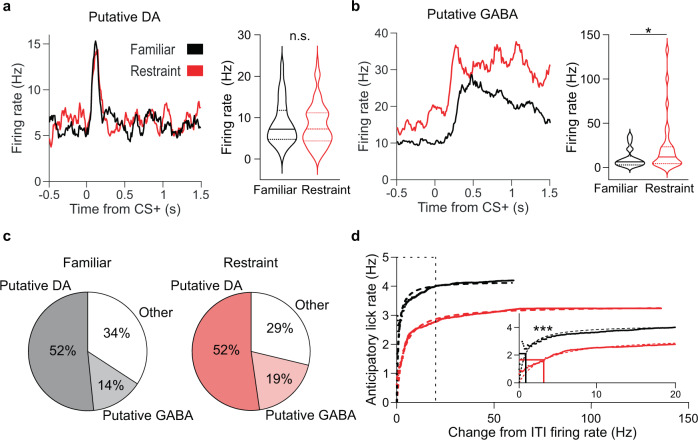
Decreased pleasure-seeking (anhedonia) forms a core symptom of depression. Stressful experiences precipitate depression and disrupt reward-seeking, but it remains unclear how stress causes anhedonia. We recorded simultaneous neural activity across limbic brain areas as mice underwent stress and discovered a stress-induced 4 Hz oscillation in the nucleus accumbens (NAc) that predicts the degree of subsequent blunted reward-seeking. Surprisingly, while previous studies on blunted reward-seeking focused on dopamine (DA) transmission from the ventral tegmental area (VTA) to the NAc, we found that VTA GABA, but not DA, neurons mediate stress-induced blunted reward-seeking. Inhibiting VTA GABA neurons disrupts stress-induced NAc oscillations and rescues reward-seeking. By contrast, mimicking this signature of stress by stimulating NAc-projecting VTA GABA neurons at 4 Hz reproduces both oscillations and blunted reward-seeking. Finally, we find that stress disrupts VTA GABA, but not DA, neural encoding of reward anticipation. Thus, stress elicits VTA-NAc GABAergic activity that induces VTA GABA mediated blunted reward-seeking.


Conflict of interest statement

A.Z.H. is an advisory board member of Genetika+, incorporated. The other authors have no competing interests.

Figures

Fig. 1
Fig. 1. Restraint stress re-organizes the NAc LFP and impairs subsequent reward-seeking.
a Far left: experimental design. Left: representative traces of the nucleus accumbens (NAc) local field potential (LFP) of a mouse freely exploring a familiar environment (gray) or during restraint (red), overlaid with the 2–7 Hz filtered signal (black). Voltage is normalized to the root mean square of a baseline recording and reported in arbitrary units (arb.u.). Right: average NAc LFP power spectra of mice exploring a familiar environment (black) or during restraint stress (red). Far right: restraint increases peak NAc power in the 4 (2–7) Hz range (***P = 0.00013 two-tailed signed-rank test, n = 19 mice). Data are mean ± s.e.m. b The percent change in peak 4 Hz power from familiar to restraint was larger in the NAc than the ventral hippocampus (vHPC), basolateral amygdala (BLA), VTA, and dorsal hippocampus (dHPC) (P < 0.0001 Kruskal–Wallis test; post hoc Tukey–Kramer comparisons ***PvHPC < 0.0001, nvHPC = 19 mice, *PBLA = 0.014, nBLA = 12 mice, PPFC = 0.20, nPFC = 15 mice, *PVTA = 0.015 nVTA = 14 mice, ***PdHPC < 0.0001, ndHPC = 9 mice, nNAc = 10 mice). Data are plotted with median, upper and lower quartiles, and 1.5x interquartile range. c Experimental design. d Restraint stress increases the time to first lick during the reward availability period in the cued-reward task (***P = 0.00049 two-tailed signed-rank test, n = 13 mice). Data are mean ± s.e.m. e Restraint stress decreases average anticipatory lick rate between CS+ onset and reward availability (*P = 0.011 two-tailed paired t test, n = 13 mice). Data are mean ± s.e.m. f Relationship between peak 4 Hz NAc power during restraint and the change in latency to reward retrieval from after familiar environment exploration to after restraint (**P < 0.0049 Pearson correlation, n = 13 mice) g The same as f, but for the change in anticipatory lick rate from after familiar environment exploration to after restraint (*P = 0.029 Pearson correlation, n = 13 mice).
Fig. 2
Fig. 2. Restraint-inhibited NAc units phase-lock to local low-frequency oscillations.
a Left: relationship between NAc firing rates in familiar environment and restraint, with line of equality for reference. Right: summary of data from left panel. Restraint inhibited overall NAc neuron firing rate (***P < 0.0001 two-tailed signed-rank tests, n = 81 neurons). Data are mean ± s.e.m. b Distribution of NAc neurons excited, inhibited, and unmodulated by restraint. c Left: the spike-phase relationship for example restraint-inhibited NAc neuron. The activity was uniformly distributed across 4 Hz filtered NAc LFP phase angles during familiar environment exploration, but phase-locked during restraint. Center: Relationship between the pairwise phase consistency (PPC) of restraint-inhibited NAc neurons during familiar environment exploration and restraint, with line of equality for reference. Right: summary of data from center panel. Restraint-inhibited NAc neurons increased phase-locking to the 4 Hz filtered NAc LFP during restraint (***P < 0.0001, two-tailed signed-rank test, n = 48 neurons). Data are mean ± s.e.m. d Same as c, but with restraint-excited NAc neurons. Restraint-excited NAc neurons did not increase phase locking to the NAc LFP. (P = 0.33, two-tailed signed-rank test, n = 17 neurons). Data are mean ± s.e.m.
Fig. 3
Fig. 3. VTA neural activity leads NAc activity during restraint.
a Left: example traces of NAc and VTA LFPs during familiar environment exploration (gray) or restraint (red), overlaid with the 4 Hz filtered signal (black). Center: coherence of VTA and NAc LFPs. Right: restraint increases average VTA-NAc coherence in the 4 Hz range (***P = 0.00024 two-tailed paired t test, n = 13 mice). Data are mean ± s.e.m. b Left: PPC between VTA MUA and the 4 Hz filtered NAc LFP at different MUA time lags. Restraint increased synchrony of NAc 4 Hz phase with past VTA MUA. Center: relationship between lag of max VTA MUA-NAc PPC during familiar environment exploration and restraint, with the line of equality for reference. Right: summary of data from the center panel. Restraint reorganized VTA MUA from predominantly lagging NAc phase to predominantly leading NAc phase (***P = 0.00033 two-tailed signed-rank test, n = 138 multi-units). Data are mean ± s.e.m. C Left: experimental design. Center: example NAc LFP power spectra following VTA infusion of saline (red) or muscimol (violet). Right: Muscimol reduced maximum 4 Hz NAc power during restraint (**P = 0.0020 two-tailed signed-rank test, n = 9 mice). Data are mean ± s.e.m.
Fig. 4
Fig. 4. VTA GABA activity leads to low-frequency NAc oscillations during restraint.
a Top left: experimental design. Bottom left: raster plot of opto-tagged DA neuron. Right: immunofluorescent image of archaerhodopsin (Arch) expression (green) in a Dat-ires-Cre mouse VTA, with tyrosine hydroxylase counterstain (blue). Scale bar is 30 µm. Representative of 6 experiments. b Left: Relationship between lag of max VTA DA-NAc PPC during familiar environment exploration and restraint, with line of equality for reference. Right: Summary of data from left panel. Restraint did not change the phase-locking direction of the NAc LFP with VTA DA neurons (P = 0.54, two-tailed paired t test, n = 8 neurons). Data are mean ± s.e.m. c Example raster plot and immunofluorescent image from a Vgat-ires-Cre mouse. Scale bar is 30 µm. Representative of six experiments. d The same as b, but for opto-tagged GABA neurons in a Vgat-ires-Cre mouse. Restraint shifted 4 Hz NAc LFP phase-locking toward past VTA GABA neuron activity (*P = 0.012 two-tailed signed-rank test, n = 10 neurons). Data are mean ± s.e.m.
Fig. 5
Fig. 5. Prolonged VTA GABA inhibition during restraint decreases low-frequency NAc oscillations and rescues reward-seeking behavior.
a Experimental design. b Left: example NAc LFP spectra during light off (black) and light on (green) sessions. Center: relationship between peak 4 Hz NAc power during light off and light on sessions, with a line of equality for reference. Right: summary of data from the center panel. Prolonged VTA GABA inhibition reduced peak 4 Hz NAc power (*P = 0.014 two-tailed paired t test, n = 7 mice). Data are mean ± s.e.m. c Left: experimental design. Right: Prolonged VTA GABA inhibition during restraint improved reward retrieval latency and anticipatory lick rate (*P = 0.031 and *P = 0.016, two-tailed signed-rank test, n = 7 mice). Data are mean ± s.e.m.
Fig. 6
Fig. 6. Activation of NAc-projecting VTA GABA neurons produces a low-frequency oscillation and impairs reward-seeking.
a Left: experimental design. Right: event-related potential of NAc LFP. Bars indicate 10 ms laser pulse onset. b Left: representative NAc spectra with no stimulation (black) and rhythmic low-frequency stimulation (blue). Center: relationship between max 4 Hz NAc power during light off and stimulation, with a line of equality for reference. Right: summary of data from the center panel. ChR2 stimulation increased peak 4 Hz NAc power (*P = 0.031 two-tailed signed-rank test, n = 6 mice). Data are mean ± s.e.m. c Left: experimental design. Right: rhythmic ChR2 stimulation impaired subsequent reward retrieval latency and anticipatory lick rate (*P = 0.031 and *P = 0.031, two-tailed signed-rank test, n = 6 mice). Data are mean ± s.e.m. d Left: experimental design. Right: immunofluorescent image of retrograde ChR2 expression (green) in a Vgat-ires-Cre mouse VTA, with tyrosine hydroxylase counterstain (blue). The scale bar is 30 µm. Representative of five experiments. e Left: representative NAc spectra of no stimulation and rhythmic low-frequency stimulation. Center: relationship between max 4 Hz NAc power during light off and stimulation, with the line of equality for reference. Right: Summary of data from the center panel. Stimulating NAc-projecting VTA GABA neurons increased peak 4 Hz NAc power (*P = 0.040 two-tailed paired t test, n = 5 mice). Data are mean ± s.e.m. f Left: experimental design. Right: rhythmic VTA illumination impaired subsequent reward retrieval latency and anticipatory lick rate (**P = 0.0091 and **P = 0.0057 two-tailed paired t test, n = 5 mice). Data are mean ± s.e.m.
Fig. 7
Fig. 7. Restraint enhances VTA GABA activity but weakens its relationship with anticipatory behavior.
a Left: representative CS+ evoked firing rates of putative DA neurons in non-stressed (black) and stressed (red) conditions. Right: CS+ evoked firing rates for putative DA neurons recorded in non-stressed and stressed conditions. Restraint did not affect the CS+ evoked firing rates of putative DA neurons (P = 0.64, two-tailed rank-sum test, nFamiliar = 80 neurons, nRestraint = 80 neurons). Data plotted are median, upper and lower quartiles, and kernel density estimate. b The same as a, but for putative GABA neurons. Restraint enhanced CS+ evoked firing of putative GABA neurons (*P = 0.028, two-tailed rank-sum test, nFamiliar = 22 neurons, nRestraint = 29 neurons). Data plotted are median, upper and lower quartiles, and kernel density estimate. c Distribution of putative DA and GABA neurons recorded during familiar environment and restraint stress conditions (total neurons nFamiliar = 155, nRestraint = 153). d Relationship between cumulative change in firing rate of putative GABA neurons and average anticipatory lick rate for the familiar environment and restraint stress conditions. Dotted lines are nonlinear least-squares fitted functions. Inset: Same data graphed up to 20 Hz. Solid lines indicate EC50 value calculated for the fitted function. The EC50 value for the familiar environment fitted function was smaller than that of the restraint stress fitted function (***P < 0.0001 two-tailed ANCOVA).

References

    1. Berghorst LH, Bogdan R, Frank MJ, Pizzagalli DA. Acute stress selectively reduces reward sensitivity. Front. Hum. Neurosci. 2013;7:133. doi: 10.3389/fnhum.2013.00133. - DOI - PMC - PubMed
    1. Wanat MJ, Bonci A, Phillips PE. CRF acts in the midbrain to attenuate accumbens dopamine release to rewards but not their predictors. Nat. Neurosci. 2013;16:383–385. doi: 10.1038/nn.3335. - DOI - PMC - PubMed
    1. Harris AZ, et al. A novel method for chronic social defeat stress in female mice. Neuropsychopharmacology. 2018;43:1276–1283. doi: 10.1038/npp.2017.259. - DOI - PMC - PubMed
    1. Pizzagalli DA. Depression, stress, and anhedonia: toward a synthesis and integrated model. Annu Rev. Clin. Psychol. 2014;10:393–423. doi: 10.1146/annurev-clinpsy-050212-185606. - DOI - PMC - PubMed
    1. Cohen JY, Haesler S, Vong L, Lowell BB, Uchida N. Neuron-type-specific signals for reward and punishment in the ventral tegmental area. Nature. 2012;482:85–88. doi: 10.1038/nature10754. - DOI - PMC - PubMed

Publication types

MeSH terms

LinkOut - more resources