. 2021 Jun 10;12(1):3547.
doi: 10.1038/s41467-021-23828-z.

A robotic prebiotic chemist probes long term reactions of complexifying mixtures

Affiliations

A robotic prebiotic chemist probes long term reactions of complexifying mixtures

Silke Asche et al. Nat Commun. .

Abstract

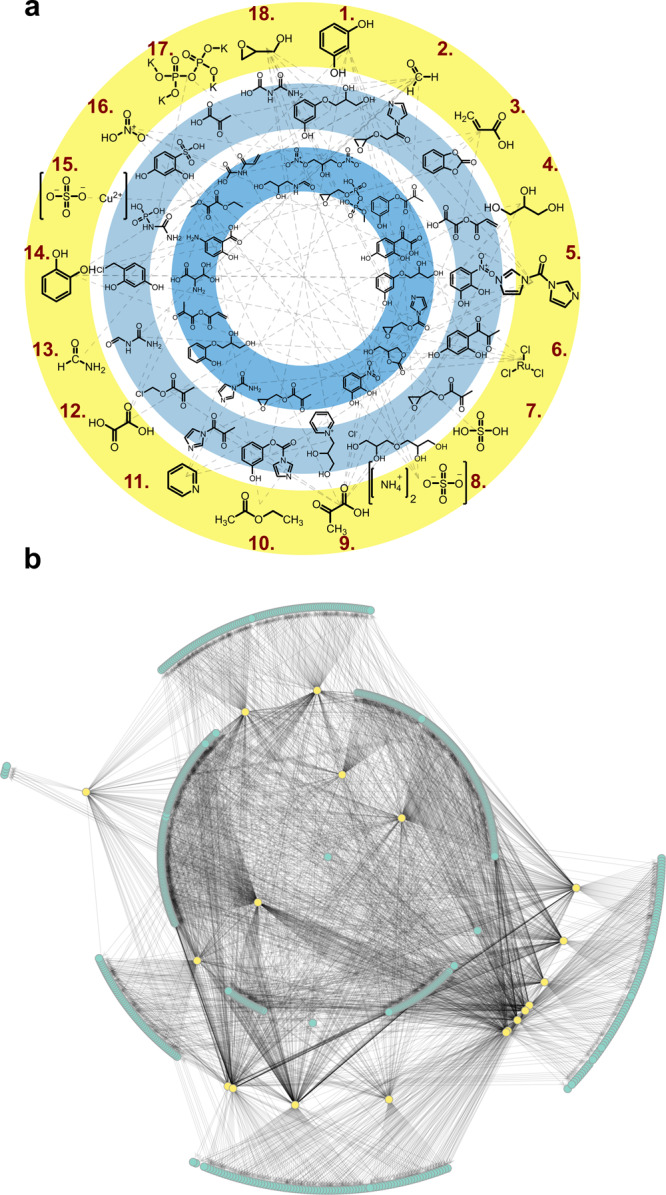
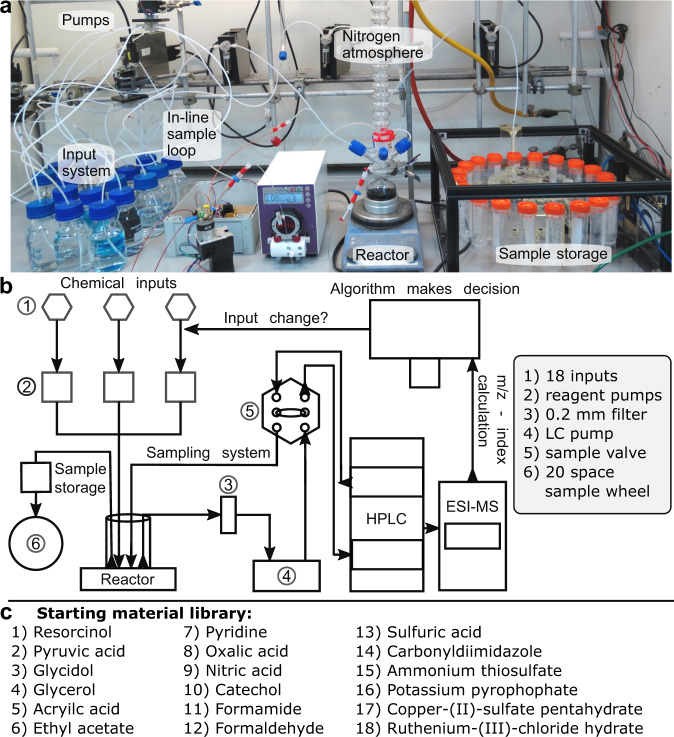
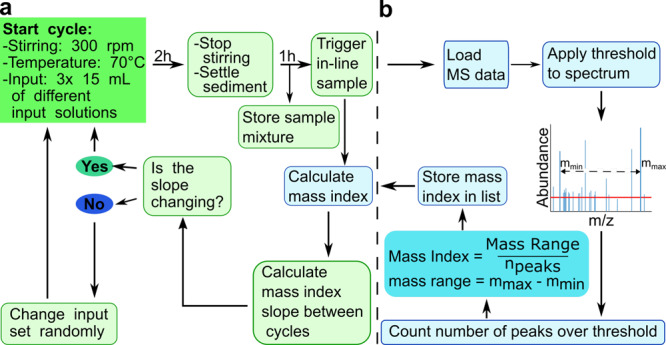
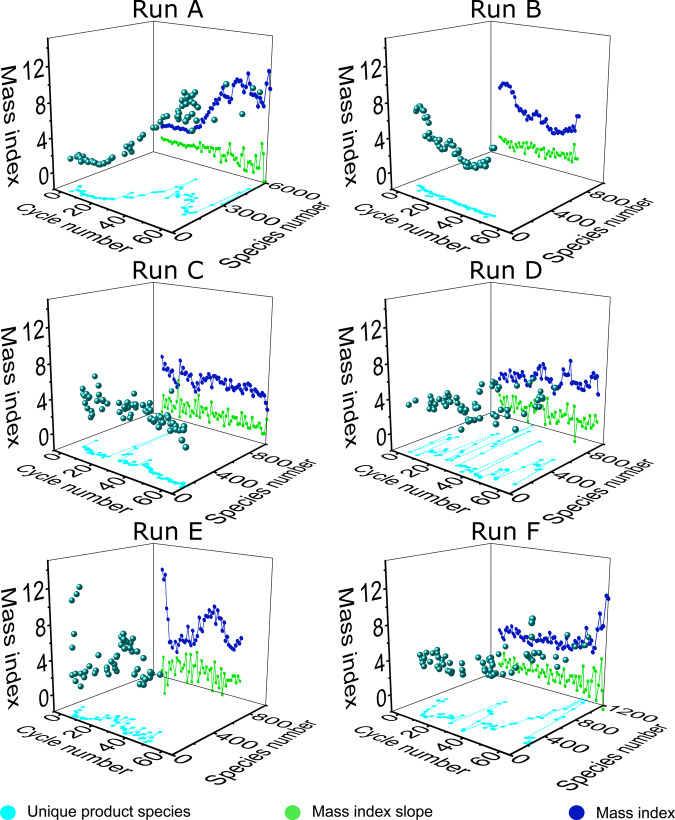
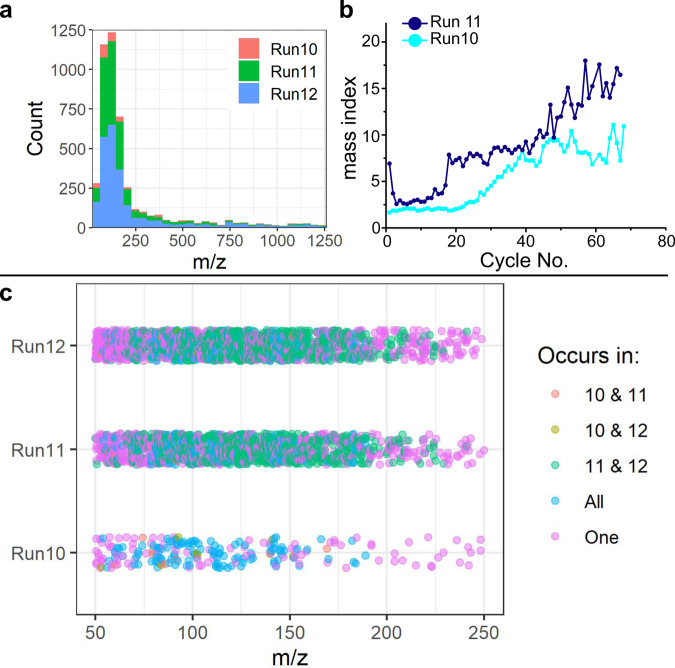
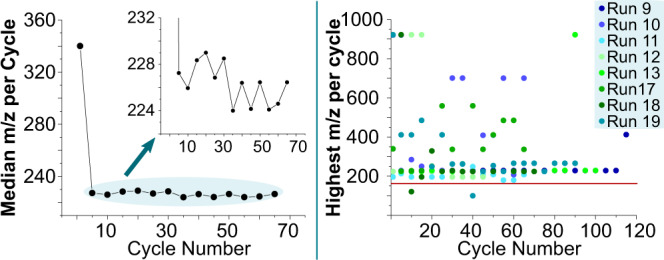
To experimentally test hypotheses about the emergence of living systems from abiotic chemistry, researchers need to be able to run intelligent, automated, and long-term experiments to explore chemical space. Here we report a robotic prebiotic chemist equipped with an automatic sensor system designed for long-term chemical experiments exploring unconstrained multicomponent reactions, which can run autonomously over long periods. The system collects mass spectrometry data from over 10 experiments, with 60 to 150 algorithmically controlled cycles per experiment, running continuously for over 4 weeks. We show that the robot can discover the production of high complexity molecules from simple precursors, as well as deal with the vast amount of data produced by a recursive and unconstrained experiment. This approach represents what we believe to be a necessary step towards the design of new types of Origin of Life experiments that allow testable hypotheses for the emergence of life from prebiotic chemistry.


Conflict of interest statement

The authors declare no competing interests.

Figures

Fig. 1
Fig. 1. Network of reactions possible based on the input library.
On the top panel a is a network where compounds of the starting material library (yellow, outer circle) are reacting to example products with either two starting compounds (pale blue, middle circle) or three compounds (dark blue, circle inside) reacting at once. On the bottom panel b is a full network of all known possible reactions shown, again with two or three input molecules reacting together. Input compounds are represented as yellow dots, while all found reaction products are presented as blue dots.
Fig. 2
Fig. 2. Platform overview.
a A photograph of the platform set up is shown above. The analytical system, including HPLC–MS and the computer, which controlled the platform processes, is not shown in the photograph. b A detailed schematic depiction is shown in the middle. c A list of the starting material library is shown below.
Fig. 3
Fig. 3. Schematic workflow of the automated system.
a The general tasks. b The decision-making process of the algorithm. The formula for the Mass Index was previously reported by Doran et al..
Fig. 4
Fig. 4. Selected experiments, which reached 65 cycles or more.
The light-blue line represents the number of unique product species versus the number of cycles, while the dark-blue line represents the calculated Mass Index for each respective cycle. The green line shows the corresponding slope of the Mass Index values. The spherical data points map these in 3D. Run A, B, C, and D had a cycle time of 6 h, while E and F had 3 h per cycle.
Fig. 5
Fig. 5. Comparison of reproduced identical experiments.
a Shows the m/z value distribution of individual experiments analyzed with the Thermo Orbitrap Fusion Lumos. Run 10 (green), Run 11(blue), and Run 12 (purple) are compared with all ions appearing in total in all samples after thresholding. The graph on the right (b) shows the online analytical result on the Advion L-CMS series of Run 10 and Run 11. The online analytical system failed at Run 12, which is the reason that there is not a third comparable dataset. c It shows a comparison of the offline analytical data of all three runs. The measurements of run 11 and 12 were performed at the same time, while run 10 was measured at a later date. This means that the differences between run 10 and the other runs may be partially due to a difference in performance.
Fig. 6
Fig. 6. Experiments compared by the highest m/z value.
On the left, we present a diagram, which shows the median of the highest m/z value of each experiment compared with the cycle number. As the first value is very high, a zoomed-in version of the plot is shown as an inset. On the right, we show the highest m/z value over the threshold of each cycle of selected runs. The line (red) in the plot represents the m/z value of the heaviest input solution.

References

    1. Nghe P, et al. Prebiotic network evolution: six key parameters. Mol. Biosyst. 2015;11:3206–3217. doi: 10.1039/C5MB00593K. - DOI - PubMed
    1. Keseru GM, Soos T, Kappe CO. Anthropogenic reaction parameters−the missing link between chemical intuition and the available chemical space. Chem. Soc. Rev. 2014;43:5387–5399. doi: 10.1039/C3CS60423C. - DOI - PubMed
    1. Surman AJ, et al. Environmental control programs the emergence of distinct functional ensembles from unconstrained chemical reactions. Proc. Natl Acad. Sci. USA. 2019;116:5387–5392. doi: 10.1073/pnas.1813987116. - DOI - PMC - PubMed
    1. Benner SA, Kim H-J, Biondi E. Prebiotic chemistry that could not not have happened. Life. 2019;9:84. doi: 10.3390/life9040084. - DOI - PMC - PubMed
    1. Guttenberg N, Virgo N, Chandru K, Scharf C, Mamajanov I. Bulk measurements of messy chemistries are needed for a theory of the origins of life. Philos. Trans. A Math. Phys. Eng. Sci. 2017;375:20160347. - PMC - PubMed

Publication types