. 2021 Jun 10;12(1):3528.
doi: 10.1038/s41467-021-23793-7.

Antibody-drug conjugates with dual payloads for combating breast tumor heterogeneity and drug resistance

Affiliations

Antibody-drug conjugates with dual payloads for combating breast tumor heterogeneity and drug resistance

Chisato M Yamazaki et al. Nat Commun. .

Abstract

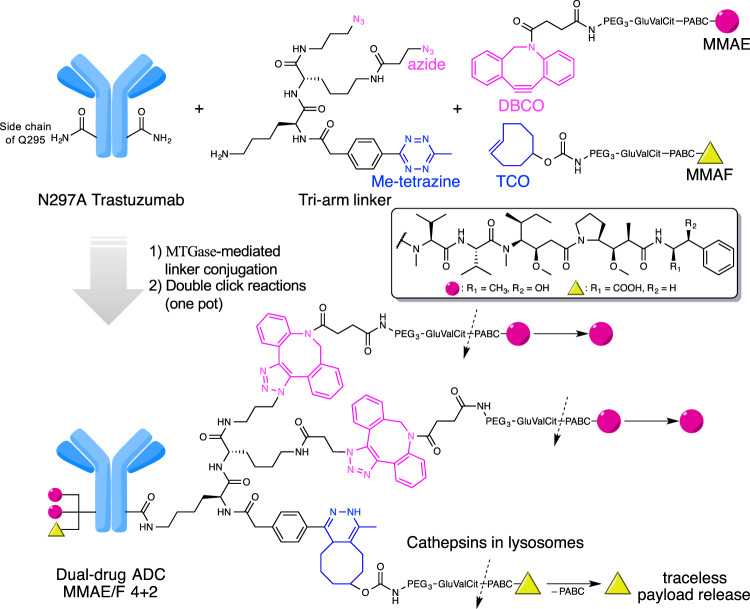
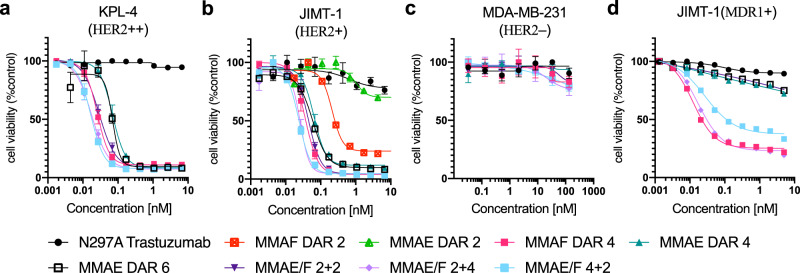
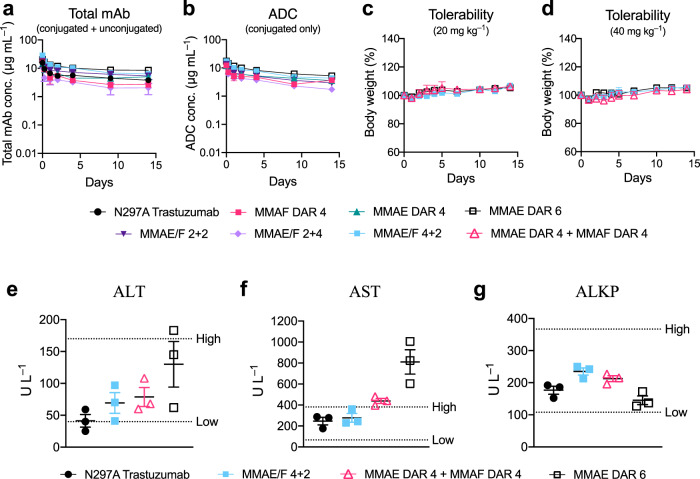
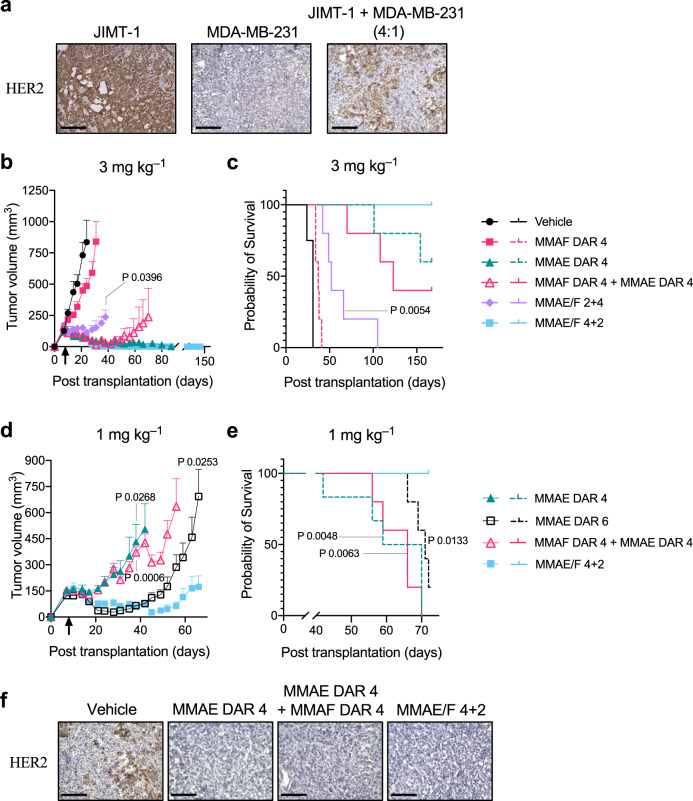
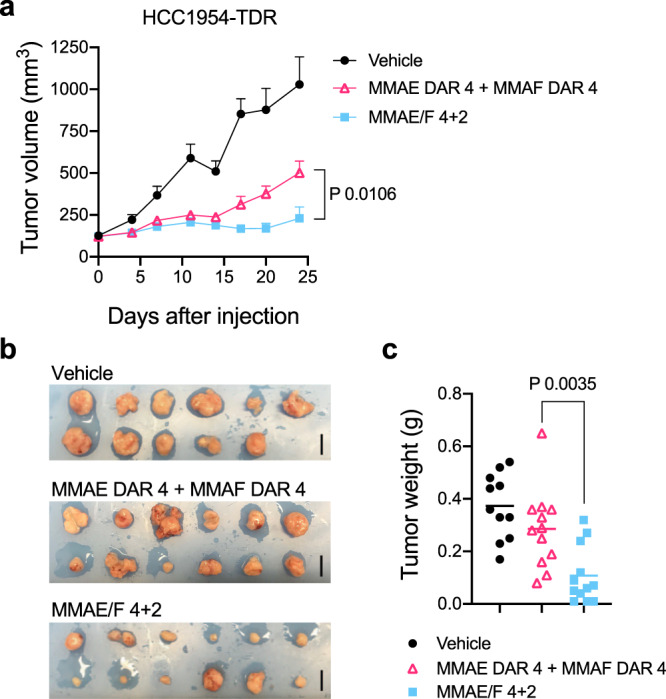
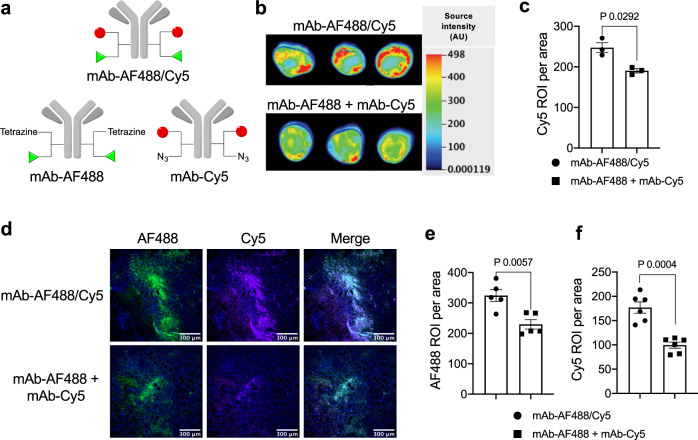
Breast tumors generally consist of a diverse population of cells with varying gene expression profiles. Breast tumor heterogeneity is a major factor contributing to drug resistance, recurrence, and metastasis after chemotherapy. Antibody-drug conjugates (ADCs) are emerging chemotherapeutic agents with striking clinical success, including T-DM1 for HER2-positive breast cancer. However, these ADCs often suffer from issues associated with intratumor heterogeneity. Here, we show that homogeneous ADCs containing two distinct payloads are a promising drug class for addressing this clinical challenge. Our conjugates show HER2-specific cell killing potency, desirable pharmacokinetic profiles, minimal inflammatory response, and marginal toxicity at therapeutic doses. Notably, a dual-drug ADC exerts greater treatment effect and survival benefit than does co-administration of two single-drug variants in xenograft mouse models representing intratumor HER2 heterogeneity and elevated drug resistance. Our findings highlight the therapeutic potential of the dual-drug ADC format for treating refractory breast cancer and perhaps other cancers.


Conflict of interest statement

C.M.Y., Y.A., N.Z., Z.A. and K.T. are named inventors on a patent application relating to the work filed by the Board of Regents of the University of Texas System (PCT/US2018/034363; US-2020-0115326-A1; EU18804968.8-1109/3630189). The remaining authors declare no competing interests.

Figures

Fig. 1
Fig. 1. Molecular design and conjugation strategy for generating dual-drug ADCs.
MTGase-mediated conjugation of bi-functional branched linkers and following orthogonal click reactions with two payload modules afford homogeneous dual-drug ADCs with defined DARs (magenta circle: MMAE; yellow triangle: MMAF). Preparation of anti-HER2 ADC with a DAR of MMAE/F 4 + 2 is shown as an example. The glutamic acid–valine–citrulline (GluValCit)–PABC linker ensures in vivo stability, while allowing for quick and traceless release of payloads upon internalization and following cathepsin-mediated cleavage in lysosomes. DAR, drug-to-antibody ratio; DBCO, dibenzocyclooctyne; MTGase, microbial transglutaminase; PABC, p-aminobenzyloxycarbonyl; PEG, polyethylene glycol; TCO, trans-cyclooctene.
Fig. 2
Fig. 2. Construction and characterization of dual-drug ADCs.
a Deconvoluted ESI-mass spectra. First panel: intact N297A anti-HER2 mAb (trastuzumab mutant). Second panel: antibody–branched linker conjugate. Third panel: intermediate after conjugation with TCO–MMAF modules. Fourth panel: highly homogeneous dual-drug ADC with a DAR of 4 + 2 (MMAE + MMAF). *Fragment ions detected in ESI-MS analysis. b Diagrams illustrating dual-drug and single-drug ADCs prepared and evaluated in this study. Magenta circle: MMAE; yellow triangle: MMAF. See Supplementary Notes for characterization details. c Hydrophobic interaction chromatography (HIC) analysis of ADCs under physiological conditions (phosphate buffer, pH 7.4). The number of conjugated MMAE has a greater contribution to ADC hydrophobicity than does MMAF. d Overlay traces of size-exclusion chromatography (SEC) after incubating each conjugate in PBS (pH 7.4) at 37 °C for 28 days. MMAE/F 2 + 4 ADC (light purple), MMAE/F 2 + 2 ADC (dark purple), MMAE DAR 4 ADC (green), MMAF DAR 4 ADC (magenta), and MMAE/F 4 + 2 ADC (cyan). Retention times of all major peaks were similar (12 min). No significant aggregation was detected in either case.
Fig. 3
Fig. 3. In vitro cytotoxicity.
ad Cell killing potency in the breast cancer cell lines KPL-4 (a), JIMT-1 (b), MDA-MB-231 (c), and JIMT-1(MDR1+) (d). Unconjugated N297A trastuzumab (black circle), MMAF DAR 2 ADC (red square), MMAE DAR 2 ADC (light green triangle), MMAF DAR 4 ADC (magenta square), MMAE DAR 4 ADC (green triangle), MMAE DAR 6 ADC (black open square), MMAE/F 2 + 2 ADC (dark purple inversed triangle), MMAE/F 2 + 4 ADC (light purple diamond), and MMAE/F 4 + 2 ADC (cyan square). Concentrations are based on the antibody dose without normalizing to each DAR. All assays were performed in quadruplicate. Data are presented as mean values ± SEM (n = 3 for N297A trastuzumab, MMAF DAR 4 ADC, and MMAE DAR 6 ADC in KPL-4, and MMAE DAR 2 and MMAE DAR 2 ADCs in JIMT-1; n = 4 for other groups). Source data are available as a Source Data file.
Fig. 4
Fig. 4. In vivo pharmacokinetics (PK), tolerability, and blood chemistry.
a, b PK of unmodified N297A Trastuzumab (black circle), MMAF DAR 4 ADC (magenta square), MMAE DAR 4 ADC (green triangle), MMAE DAR 6 ADC (black open square), MMAE/F 2 + 2 ADC (dark purple inverted triangle), MMAE/F 2 + 4 ADC (light purple diamond), and MMAE/F 4 + 2 ADC (cyan square) in female CD-1 mice (n = 3 for MMAE DAR 4 ADC; n = 4 for other groups). At the indicated time points, blood was collected to quantify total antibody (conjugated and unconjugated, a) and ADC (conjugated only, b) by sandwich ELISA. c, d Body weight change after female BALB/c mice (n = 3) were administered with a single dose of MMAE DAR 6 ADC, MMAE/F 4 + 2 ADC, or a 1 : 1 mixture of MMAF DAR 4 and MMAE DAR 4 ADCs (magenta open triangle) at 20 (c) or 40 mg kg−1 (d). No mice showed acute symptoms or reached the pre-defined humane endpoint during 2-week monitoring. eg Blood chemistry parameters (ALT (e), AST (f), and ALKP (g)) 15 days post injection of a single dose of vehicle control, MMAE/F 4 + 2 ADC (40 mg mL−1), a 1 : 1 mixture of MMAE DAR 4 and MMAF DAR 4 ADCs (40 mg mL−1 each), or MMAE DAR 6 ADC (40 mg mL−1) in female BALB/c mice (n = 3). Dotted lines (High and Low) represent 95% confidential interval of each parameter in healthy BALB/c mice (data from Charles River Laboratories). Data are presented as mean values ± SEM. Source data are available as a Source Data file.
Fig. 5
Fig. 5. In vivo antitumor activity of dual-drug ADCs in the JIMT-1/MDA-MB-231 admixed model.
a HER2 expression on tumors consisting of either HER2-positive JIMT-1 or HER2-negative MDA-MB-231 cells, or both (4 : 1 ratio at the time of implantation). Immunohistochemistry for HER2 was performed on frozen sections of each tumor. Scale bar: 200 µm. This experiment was repeated twice independently with similar results. be Antitumor activity (b, d) and survival benefit (c, e) of each ADC in the JIMT-1/MDA-MB-231 admixed orthotopic breast tumor model (female NU/J mice, n = 4 for vehicle; n = 6 for MMAE DAR 4 at 1 mg kg−1; n = 5 for all other groups). Tumor-bearing mice were treated with each ADC at 3 mg kg−1 (b, c) or 1 mg kg−1 (d, e). At day 8 post transplantation (indicated with a black arrow), mice were administered with a single dose of MMAF DAR 4 ADC (magenta square), MMAE DAR 4 ADC (green triangle), MMAE DAR 6 ADC (black open square), a 1 : 1 mixture of MMAF DAR 4 and MMAE DAR 4 ADCs (magenta open triangle, 3 or 1 mg kg−1 each), MMAE/F 2 + 4 ADC (light purple diamond), MMAE/F 4 + 2 ADC (cyan square), or vehicle control (black circle). All animals other than the ones that were found dead or achieved complete remission were killed at the pre-defined humane endpoint (see “Methods”), which were counted as deaths. Data are presented as mean values ± SEM. For statistical analysis, a two-tailed Welch’s t-test (for tumor volume) and a log-rank test (for survival curve) were used. To control the family-wise error rate in multiple comparisons, crude P-values were adjusted by the Holm–Bonferroni method (see Supplementary Table 4 for details). f HER2 expression of regrown tumors after treatment with MMAE DAR 4 ADC (1 mg kg−1), a 1 : 1 mixture of MMAF DAR 4 and MMAE DAR 4 ADCs (1 mg kg−1 each), and MMAE/F 4 + 2 ADC (1 mg kg−1). Each tumor was collected when its size reached 1000 mm3 and fixed with 4% PFA. Immunohistochemistry for HER2 was performed on frozen sections. Scale bar: 100 µm. This experiment was repeated twice independently with similar results. Source data are available as a Source Data file.
Fig. 6
Fig. 6. In vivo antitumor activity in the low-HER2 heterogeneous HCC1954-TDR model.
a Antitumor activity of each ADC in the HCC1954-TDR orthotopic breast tumor model (female NU/J mice, n = 11 for vehicle; n = 12 for other groups). Once tumors reached an average volume of 125 mm3 (indicated as day 0), mice were administered with a single dose of a 1 : 1 mixture of MMAF DAR 4 and MMAE DAR 4 ADCs (magenta open triangle, 1 mg kg−1 each), MMAE/F 4 + 2 ADC (cyan square, 1 mg kg−1), or vehicle control (black circle). All animals were killed 24 days post ADC injection. Data are presented as mean values ± SEM. b Tumors collected 24 days post injection of each ADC. Scale bar: 1 cm. c Weight of the collected tumors at Day 24. Lines represent mean values. For statistical analysis, a two-tailed Welch’s t-test was used. Source data are available as a Source Data file.
Fig. 7
Fig. 7. Evaluation of payload delivery efficiency by the dual conjugate format.
a Structures of anti-HER2 AF488/Cy5 dual-dye conjugate (DOL of 2 + 2) and single-dye variants (DOL of 2). b, c Whole tumor fluorescence imaging of JIMT-1/MDA-MB-231 (4 : 1) admixed tumors 24 h after intravenous administration of mAb–AF488/Cy5 (3 mg kg−1, black circle) or a 1 : 1 cocktail of mAb–AF488 and mAb–Cy5 (3 mg kg−1 each, black square) into tumor-bearing female NU/J mice (n = 3 per group). Fluorescence images of the whole tumors (b) and semi-quantification (c) detected using a 700 nm channel. df Fluorescence microscopic imaging of the tumor tissues. Fluorescence images of the frozen sections (AF488 and Cy5 channel, scale bar: 300 µm (d) and semi-quantification (AF488 channel (e) and Cy5 channel (f)). For tissue section analysis, six areas were randomly selected from the tissue sections and normalized signal intensity (intensity in each region of interest divided by area) was calculated using ImageJ software. Data are presented as mean values ± SEM (n = 6). For statistical analysis, a two-tailed Welch’s t-test was used. This experiment was repeated twice independently with similar results. Source data are available as a Source Data file. AF488, Alexa Fluor® 488; DOL, degree of labeling.

References

    1. Polyak K. Heterogeneity in breast cancer. J. Clin. Invest. 2011;121:3786–3788. doi: 10.1172/JCI60534. - DOI - PMC - PubMed
    1. Zardavas D, Irrthum A, Swanton C, Piccart M. Clinical management of breast cancer heterogeneity. Nat. Rev. Clin. Oncol. 2015;12:381–394. doi: 10.1038/nrclinonc.2015.73. - DOI - PubMed
    1. DeSantis CE, et al. Breast cancer statistics, 2019. CA Cancer J. Clin. 2019;69:438–451. doi: 10.3322/caac.21583. - DOI - PubMed
    1. Loibl S, Gianni L. HER2-positive breast cancer. Lancet. 2017;389:2415–2429. doi: 10.1016/S0140-6736(16)32417-5. - DOI - PubMed
    1. Seol H, et al. Intratumoral heterogeneity of HER2 gene amplification in breast cancer: its clinicopathological significance. Mod. Pathol. 2012;25:938–948. doi: 10.1038/modpathol.2012.36. - DOI - PubMed

Publication types

MeSH terms