. 2021 Jun 10;11(1):12268.
doi: 10.1038/s41598-021-90543-6.

Vertical and seasonal changes in soil carbon pools to vegetation degradation in a wet meadow on the Qinghai-Tibet Plateau

Affiliations

Vertical and seasonal changes in soil carbon pools to vegetation degradation in a wet meadow on the Qinghai-Tibet Plateau

Jiangqi Wu et al. Sci Rep. .

Abstract

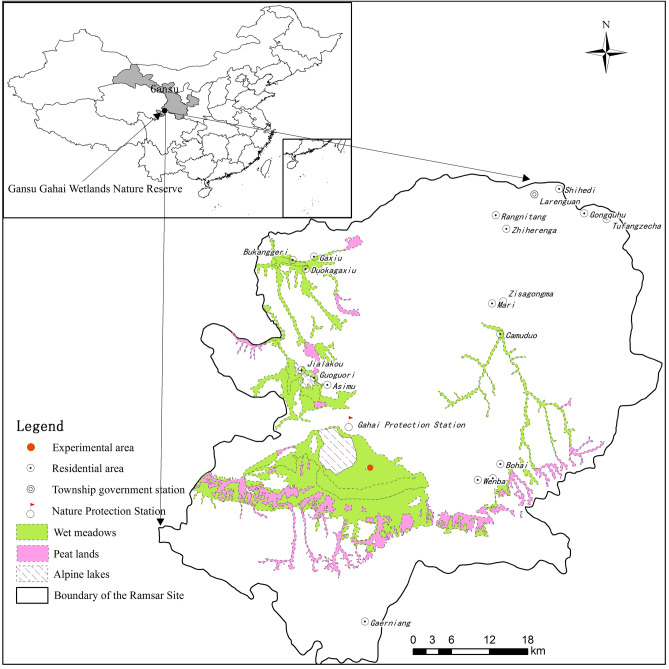
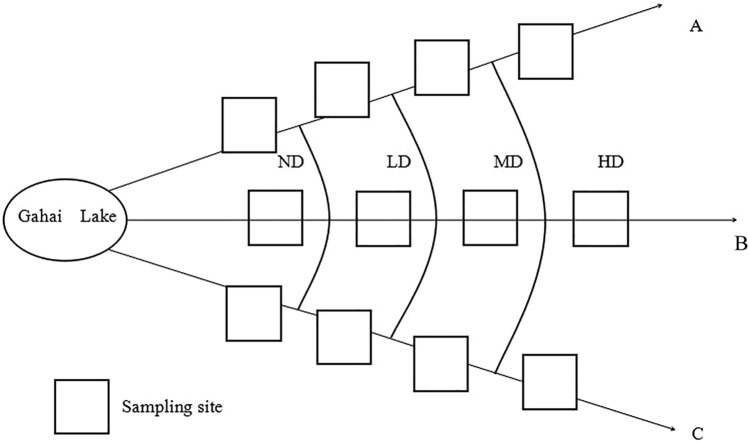
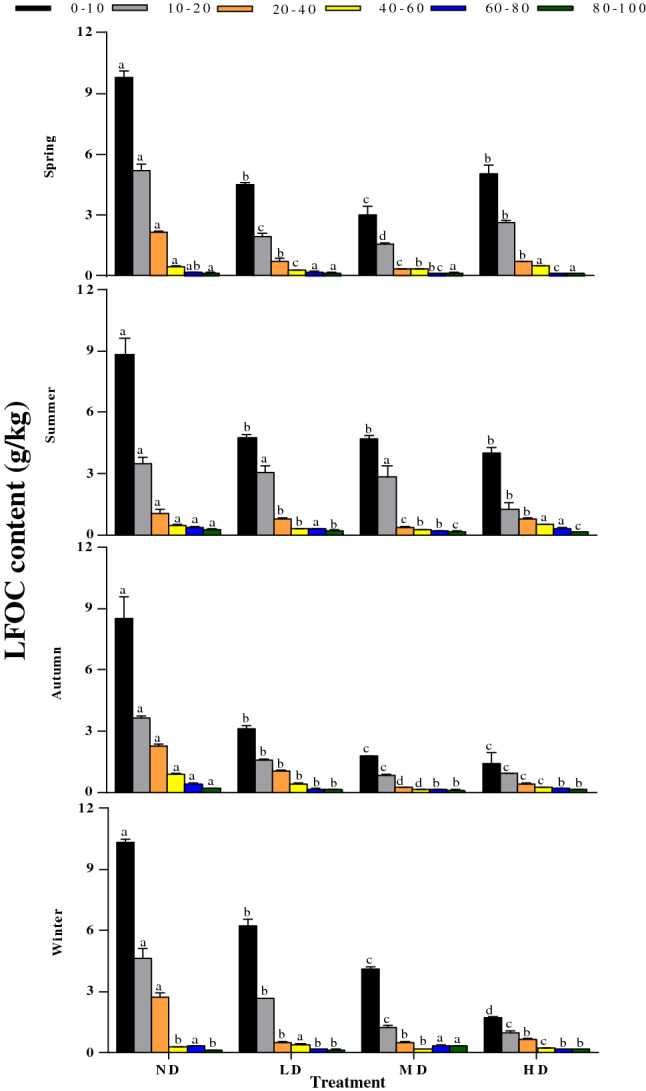
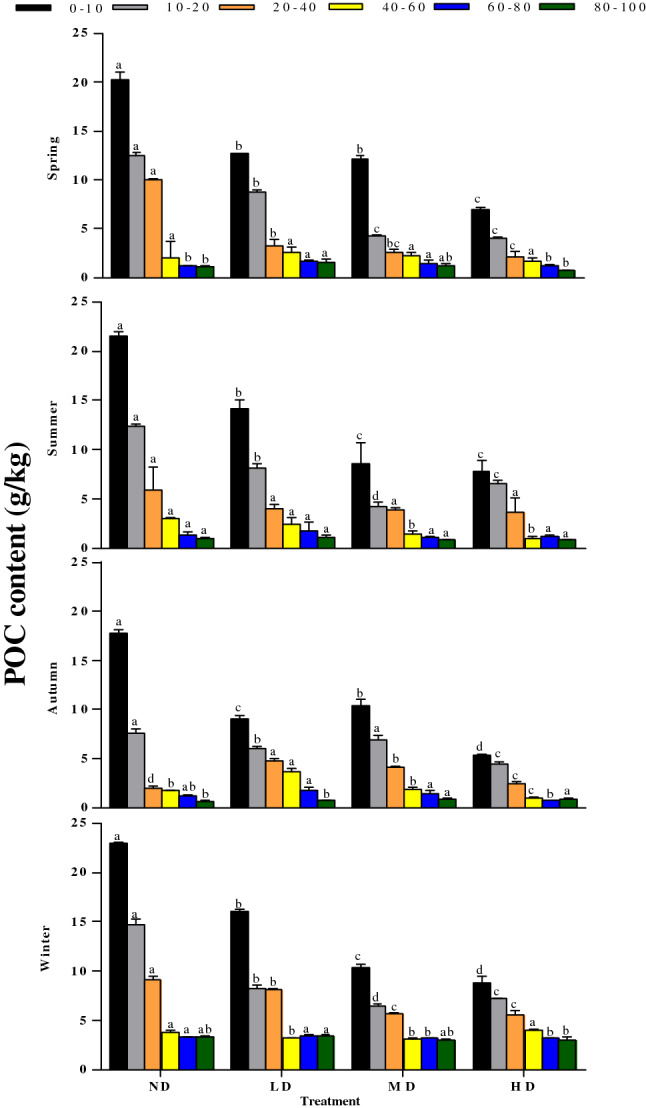
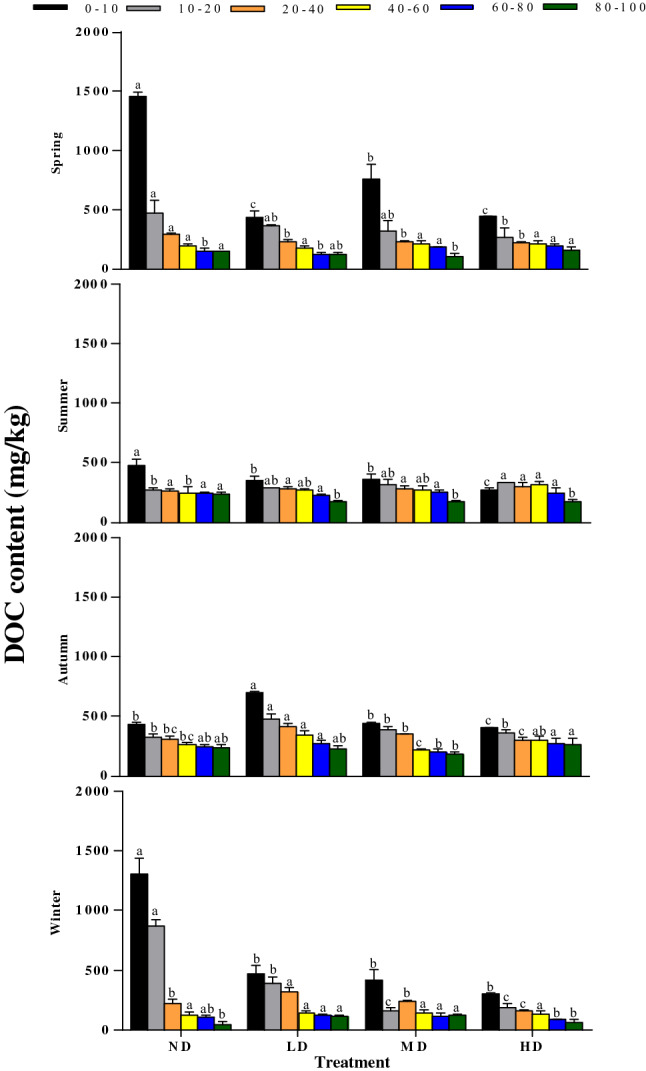
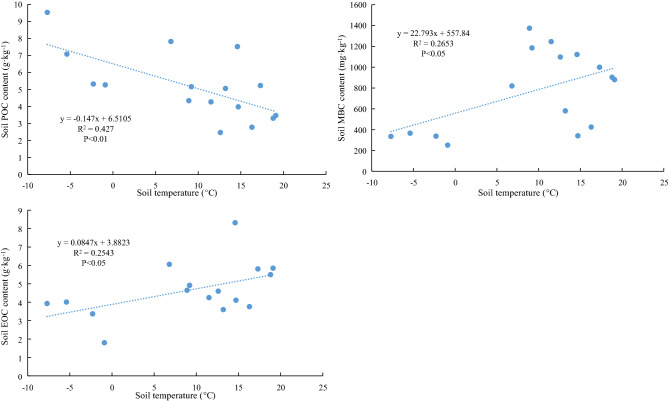
Wet meadows provide opportunities to decrease carbon dioxide (CO2) and methane (CH4) released into the atmosphere by increasing the soil organic carbon (SOC) stored in wetland systems. Although wet meadows serve as the most important and stable C sinks, there has been very few investigations on the seasonal distributions of SOC fractions in high-altitude wet meadows. Here, we studied the effects of four vegetation degradation levels, non-degraded (ND), lightly degraded (LD), moderately degraded (MD), and heavily degraded (HD), on the measured vertical and seasonal changes of SOC and its different fractions. Among these vegetation degradation levels, 0-10 and 10-20 cm soil depths in ND plots had significantly higher SOC contents than the other degradation levels had throughout the year. This is attributed to the relatively greater inputs of aboveground plant litter and richer fine-root biomass in ND plots. Particulate organic carbon (POC) and light fraction organic carbon (LFOC) showed similar vertical and seasonal variations in autumn, reaching a minimum. Moreover, microbial biomass (MBC) and easily oxidizable organic carbon (EOC) contents were highest in summer and the smallest in winter, while dissolved organic carbon (DOC) content was highest in spring and lowest in summer, and were mainly concentrated in the 0-20 cm layer. Pearson correlation analysis indicated that soil properties and aboveground biomass were significantly related to different SOC fractions. The results indicate that vegetation degradation reduces the accumulation of total SOC and its different fractions, which may reduce carbon sink capacity and soil quality of alpine wet meadows, and increase atmospheric environmental pressure. In addition, vegetation biomass and soil characteristics play a key role in the formation and transformation of soil carbon. These results strengthen our understanding of soil C dynamics, specifically related to the different C fractions as affected by vegetation degradation levels and soil depth, in wet meadow systems.


Conflict of interest statement

The authors declare no competing interests.

Figures

Figure 1
Figure 1
The geographical location map of the study area, the red dot represents the specific location after amplification.
Figure 2
Figure 2
Distribution of sampling sites. A, B, and C represent four transects. ND non-degraded, LD lightly degraded, MD moderately degraded, HD heavily degraded.
Figure 3
Figure 3
Seasonal variations in SOC at different depths (0–10, 10–20, 20–40, 40–60, 60–80, and 80–100 cm) in different vegetation degradation levels. ND non-degraded, LD lightly degraded, MD moderately degraded, HD heavily degraded. Error bars indicate standard errors of the mean (n = 3). Different lowercase letters indicate significant differences among vegetation degradation levels for the same soil layer and season based on Duncan's multiple comparison test at P < 0.05.
Figure 4
Figure 4
Seasonal variations in LFOC at different depths (0–10, 10–20, 20–40, 40–60, 60–80, and 80–100 cm) in different vegetation degradation levels. ND non-degraded, LD lightly degraded, MD moderately degraded, HD heavily degraded. Error bars indicate standard errors of the mean (n = 3). Different lowercase letters indicate significant differences among vegetation degradation levels for the same soil layer and season based on Duncan's multiple comparison test at P < 0.05.
Figure 5
Figure 5
Seasonal variations in POC at different depths (0–10, 10–20, 20–40, 40–60, 60–80, and 80–100 cm) in different vegetation degradation levels. ND non-degraded, LD lightly degraded, MD moderately degraded, HD heavily degraded. Error bars indicate standard errors of the mean (n = 3). Different lowercase letters indicate significant differences among vegetation degradation levels for the same soil layer and season based on Duncan's multiple comparison test at P < 0.05.
Figure 6
Figure 6
Seasonal variations in MBC at different depths (0–10, 10–20, 20–40, 40–60, 60–80, and 80–100 cm) in different vegetation degradation levels. ND non-degraded, LD lightly degraded, MD moderately degraded, HD heavily degraded. Error bars indicate standard errors of the mean (n = 3). Different lowercase letters indicate significant differences among vegetation degradation levels for the same soil layer and season based on Duncan's multiple comparison test at P < 0.05.
Figure 7
Figure 7
Seasonal variations in DOC at different depths (0–10, 10–20, 20–40, 40–60, 60–80, and 80–100 cm) in different vegetation degradation levels. ND non-degraded, LD lightly degraded, MD moderately degraded, HD heavily degraded. Error bars indicate standard errors of the mean (n = 3). Different lowercase letters indicate significant differences among vegetation degradation levels for the same soil layer and season based on Duncan's multiple comparison test at P < 0.05.
Figure 8
Figure 8
Seasonal variations in EOC at different depths (0–10, 10–20, 20–40, 40–60, 60–80, and 80–100 cm) in different vegetation degradation levels. ND non-degraded, LD lightly degraded, MD moderately degraded, HD heavily degraded. Error bars indicate standard errors of the mean (n = 3). Different lowercase letters indicate significant differences among vegetation degradation levels for the same soil layer and season based on Duncan's multiple comparison test at P < 0.05.
Figure 9
Figure 9
The soil temperature has a significant linear relationship with the content of POC, MBC, and EOC.

References

    1. Hemes KS, et al. Assessing the carbon and climate benefit of restoring degraded agricultural peat soils to managed wetlands. Agric. For. Meteorol. 2019;268:202–214. doi: 10.1016/j.agrformet.2019.01.017. - DOI
    1. Sun L, et al. Wetland-atmosphere methane exchange in Northeast China: A comparison of permafrost peatland and freshwater wetlands. Agric. For. Meteorol. 2018;249:239–249. doi: 10.1016/j.agrformet.2017.11.009. - DOI
    1. Davidson NC. How much wetland has the world lost? Long-term and recent trends in global wetland area. Mar. Freshw. Res. 2014;65(10):934–941. doi: 10.1071/MF14173. - DOI
    1. Havril T, Tóth Á, Molson JW, Galsa A, Mádl-Szőnyi J. Impacts of predicted climate change on groundwater flow systems: Can wetlands disappear due to recharge reduction? J. Hydrol. 2018;563:1169–1180. doi: 10.1016/j.jhydrol.2017.09.020. - DOI
    1. Ye XC, Meng YK, Xu LG, Xu CY. Net primary productivity dynamics and associated hydrological driving factors in the floodplain wetland of China's largest freshwater lake. Sci. Total Environ. 2019;659:302–313. doi: 10.1016/j.scitotenv.2018.12.331. - DOI - PubMed

Publication types