. 2021 Jun 10;11(1):12287.
doi: 10.1038/s41598-021-91292-2.

HGK promotes metastatic dissemination in prostate cancer

Affiliations

HGK promotes metastatic dissemination in prostate cancer

Sara Garcia-Garcia et al. Sci Rep. .

Abstract

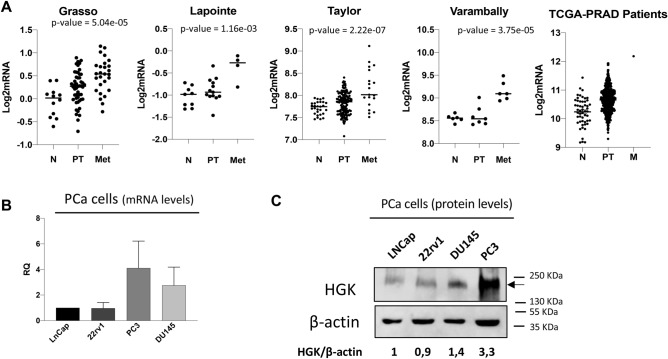
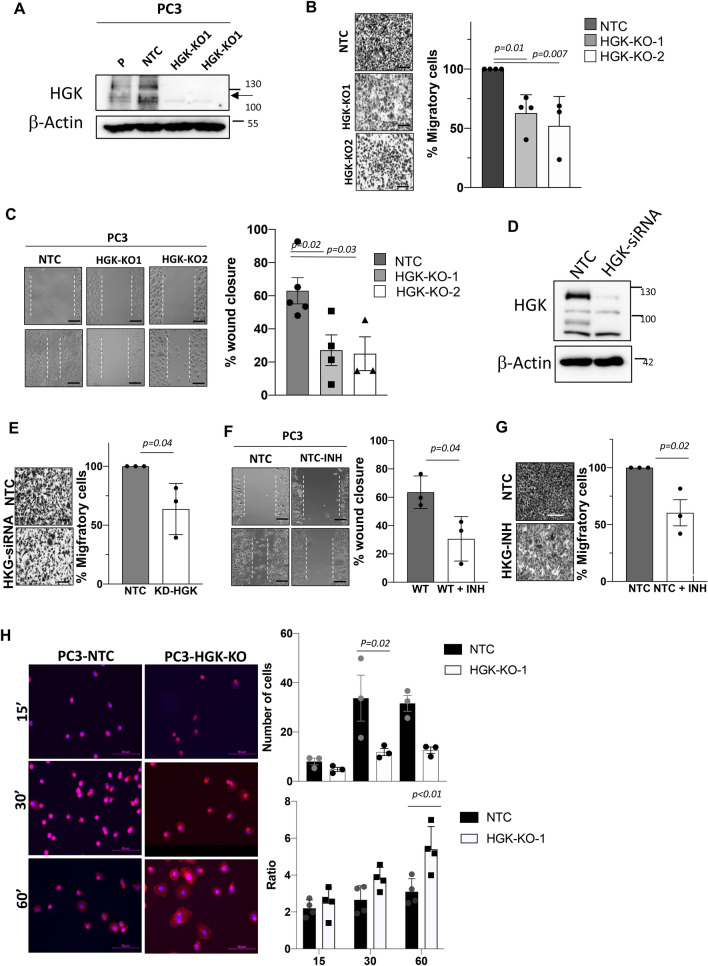
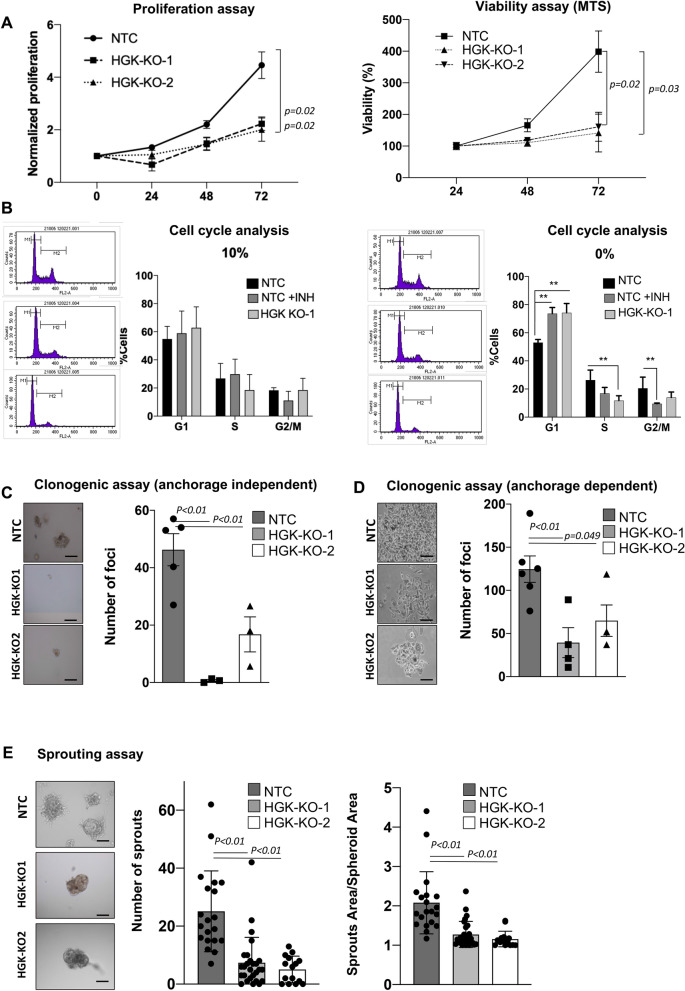
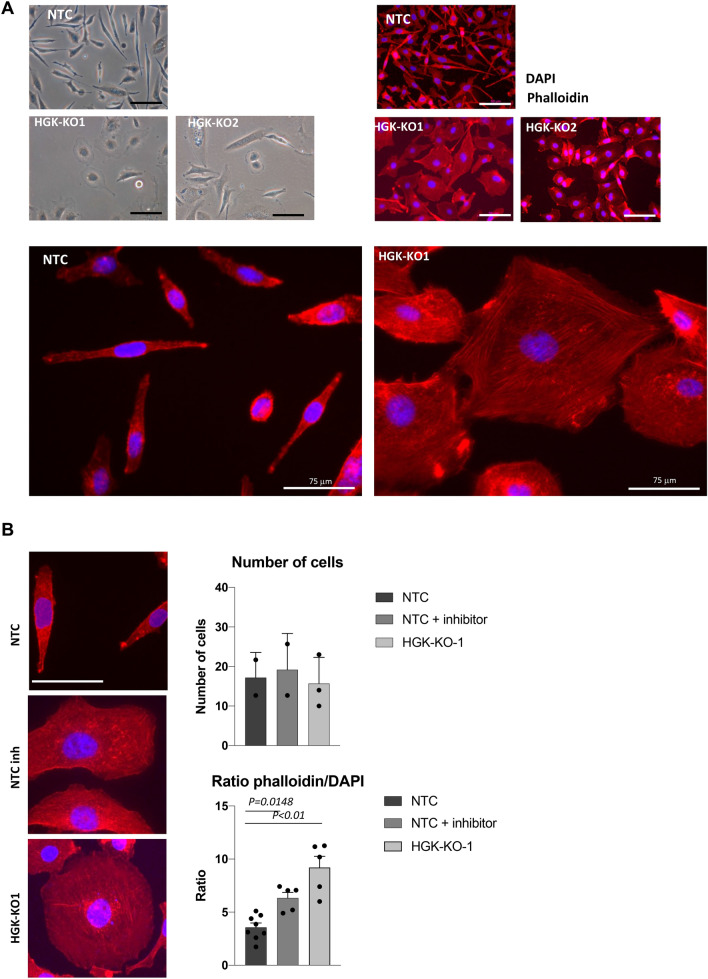
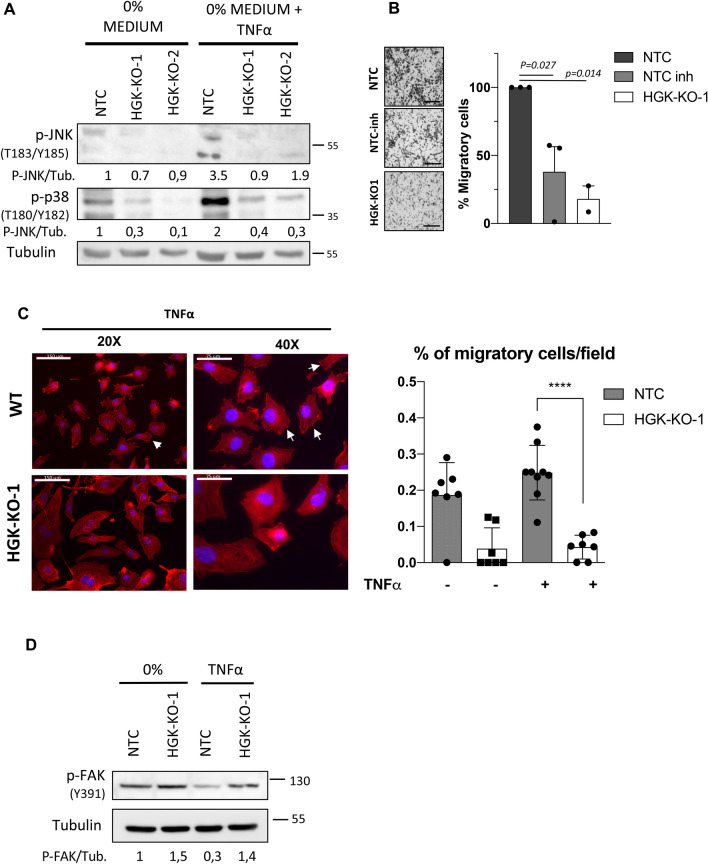
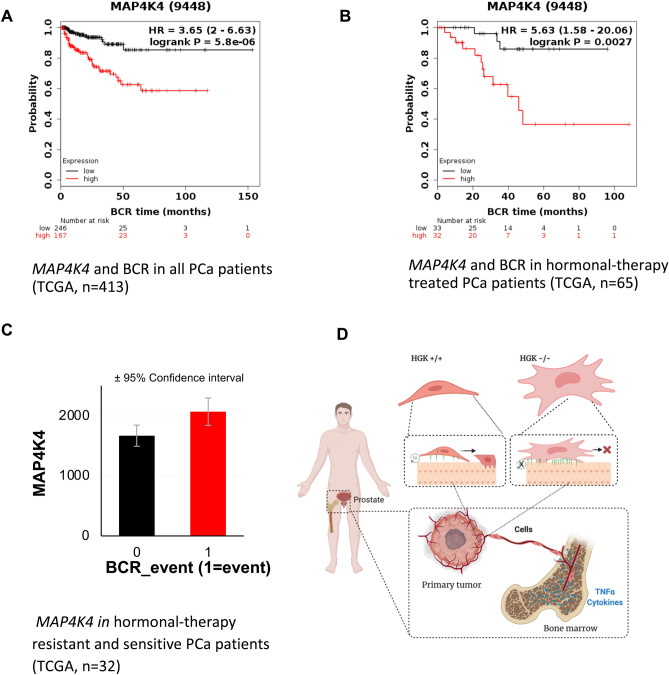
Metastasis is the process of cancer cell dissemination from primary tumors to different organs being the bone the preferred site for metastatic homing of prostate cancer (PCa) cells. Prostate tumorigenesis is a multi-stage process that ultimately tends to advance to become metastatic PCa. Once PCa patients develop skeletal metastases, they eventually succumb to the disease. Therefore, it is imperative to identify essential molecular drivers of this process to develop new therapeutic alternatives for the treatment of this devastating disease. Here, we have identified MAP4K4 as a relevant gene for metastasis in PCa. Our work shows that genetic deletion of MAP4K4 or pharmacological inhibition of its encoded kinase, HGK, inhibits metastatic PCa cells migration and clonogenic properties. Hence, MAP4K4 might promote metastasis and tumor growth. Mechanistically, our results indicate that HGK depleted cells exhibit profound differences in F-actin organization, increasing cell spreading and focal adhesion stability. Additionally, HGK depleted cells fails to respond to TNF-α stimulation and chemoattractant action. Moreover, here we show that HGK upregulation in PCa samples from TCGA and other databases correlates with a poor prognosis of the disease. Hence, we suggest that it could be used as prognostic biomarker to predict the appearance of an aggressive phenotype of PCa tumors and ultimately, the appearance of metastasis. In summary, our results highlight an essential role for HGK in the dissemination of PCa cells and its potential use as prognostic biomarker.


Conflict of interest statement

The authors declare no competing interests.

Figures

Figure 1
Figure 1
HGK is upregulated in PCa patient samples and cell lines. (A) MAP4K4 mRNA levels in PCa patients and normal tissue obtained from indicated databases. (B) MAP4K4 mRNA levels in the indicated PCa cell lines. (C) Western-blot analysis of HGK protein levels in the indicated PCa cell lines normalized with β-actin. Densitometric quantification of HGK/tubulin is shown. Full-length blots are presented in Supplementary Figure 2.
Figure 2
Figure 2
HGK down-regulation diminishes migration, while enhances adhesion in PCa cells. (A) Western-blot analysis of HGK normalized with β-actin in PC3 cells to confirm depletion. (B) Migration analysis in PC3 cells using FBS as a chemoattractant. Left panels, representative images of cells (bars: 100 µm); right panels, histograms showing the mean value ± S.E.M. of the number of migrating cells (n = 3). (C) Wound healing assay. Left panels, representative pictures of PC3 cells at time 0 and 24 h (bars: 100 µm); right panels, histograms showing the mean value ± S.E.M. of the percentage of wound closure (n = 3). (D) Western-blot analysis of HGK normalized with β-actin to confirm depletion after siRNA treatment in PC3 cells. (E) Migration analysis in HGK siRNA PC3 cells using FBS as chemoattractant. Left panels, representative images of migrating cells; (bars: 100 µm); right panels, histograms showing the mean value ± S.E.M. of the number of migrating cells (n = 3). (F) Wound assay analysis of untreated or HGK inhibitor treated PC3 cells. Left panels, representative pictures of cells at time 0 and 24 h (bars: 100 µm); right panels, histograms showing the mean value ± S.E.M. of percentage of wound closure (n = 3). (G) Migration analysis in PC3 cells treated with the HGK inhibitor using FBS as chemoattractant. Left panels, representative images of migrating cells (bars: 100 µm); right panels, histograms showing the mean value ± S.E.M. of the number of migrating cells (n = 3). (H) Adhesion analysis at 15, 30 or 60 min in the indicated PC3 cells. Left panels, representative images of adhered cells (bars: 50 µm). Right panels top, histograms showing the mean value ± S.E.M. of the percentage of adhered cells referred to non-silenced cells at 15 min (n = 3). Right panels bottom, histograms showing the mean value ± S.E.M. of the percentage of adhered cells or the ratio cytosol/nucleus referred to untreated cells at the indicated times (n = 3). Full-length blots are presented in Supplementary Figure 3.
Figure 3
Figure 3
Effect of HGK deletion on tumorigenic and proliferative properties of PCa cells. (A) Proliferation analysis of NTC or HGK depleted PC3 cells. Left panels, normalized number of proliferative cells. Right panel, cell viability evaluated by MTS. (B) Cell cycle analysis: Cells were maintained in presence or absence of 10% FBS for 24 h and analyzed by flow cytometry using ModFit software. Left panel, representative images of the distribution of cell cycle phases; right panel, histogram showing the % of cells in the different phases of cell cycle ± S.E.M. (n = 3). (C) Anchorage-independent growth assay in PC3 cells. Left panel, representative images of a macroscopic view of foci (bars: 100 µm); right panel, histogram showing the mean value ± S.E.M. of the total foci number per field normalized to NTC (n = 3). (D) Anchorage-dependent growth assays in PC3 cells. Left panels, representative images of a macroscopic view of foci (bars: 100 µm); right panels, histograms showing the mean value ± S.E.M. of the foci number per field normalized to NTC (n = 3). (E) Sprouting analysis in NTC or HGK depleted PC3 cells. Left panels, representative images of sprouts formation; right panels, histograms showing the mean value ± S.E.M. of the number of sprouts per spheroid or the sprout area per spheroid area (n = 3). Bars: 50 µm.
Figure 4
Figure 4
HGK depletion alters cell actin cytoskeleton organization. (A) Top left panel, Phase-contrast microscopy images of NTC and HGK depleted PC3 cells maintained in the presence of 10% FBS for 24 h. Top Right panel, Immuno-fluorescence microscopy images of phalloidin staining (red) in NTC and HGK depleted PC3 cells. Cell nuclei were stained with DAPI (blue). Scale bars: 75 μm. An amplification of images is depicted. (B) Adhesion analysis at 24 h in indicated cells. Left panels, representative images of adhered PC3 cells. Right top panels, histograms showing the mean value ± S.E.M. of the percentage of adhered cells referred to non-silenced cells at 24 h (n = 3). Right bottom panel, histograms showing the mean value ± S.E.M. of the ratio cytosol/nucleus referred to untreated cells at 24 h.
Figure 5
Figure 5
HGK regulates ruffle formation and cancer cell motility in response to TNF-α. (A) Representative Western-blot analysis of the phosphorylated levels of JNKs and p38 proteins normalized with β-actin on the indicated PC3 cells. Serum-starved cells (for 16 h) were stimulated with TNF-α for 15 min or maintained untreated. Densitometric quantification are shown (B) Migration analysis of the indicated PC3 cell using TNF-α as chemoattractant. Left panels, representative images of migrating cells (bars: 100 µm); right panels, histograms showing the mean value ± S.E.M. of the number of migrating cells (n = 3). (C) Immuno-fluorescence microscopy images of phalloidin staining (red) in NTC and HGK depleted PC3 cells. Serum starved cells were stimulated with TNF-α for 15 min. Cell nuclei were stained with DAPI (blue). Scale bars: 150 and 75 μm. Right panel, histograms showing the mean value ± S.E.M. of cells with ruffles referred to non-silenced cells (n = 3). (D) Representative western-blot analysis of phosphorylated levels of JNKs and FAK-Y397 normalized with β-actin. Serum-starved PC3 cells (for 16 h) were stimulated with TNF-α for 15 min or maintained untreated. Full-length blots are presented in Supplementary Figure 3.
Figure 6
Figure 6
High levels of HGK predict a poor prognosis in PCa patients. (A) Kaplan–Meier curves showing the difference in BCR-free survival between patients with high and low expression levels of MAP4K4. (B) Kaplan–Meier curves showing the difference in BCR-free survival between hormonal-therapy treated patients with high and low expression levels of MAP4K. (C) MAP4K4 expression in hormonal-therapy resistant and sensitive PCa patients (TCGA, cutoff for resistance: relapse before 40 months, n = 32). (D) Schematic summarizing of the regulation of Focal Adhesion (FA) turnover and its impact on cellular motility by HGK.

Comment in

  • Uro-Science.
    Atala A. Atala A. J Urol. 2022 Feb;207(2):460-461. doi: 10.1097/JU.0000000000002305. Epub 2021 Nov 12. J Urol. 2022. PMID: 34766838 No abstract available.

References

    1. Albala DM. Imaging and treatment recommendations in patients with castrate-resistant prostate cancer. Rev. Urol. 2017;19:200–202. doi: 10.3909/riu193PracticeProfile. - DOI - PMC - PubMed
    1. Weiner AB, Matulewicz RS, Eggener SE, Schaeffer EM. Increasing incidence of metastatic prostate cancer in the United States (2004–2013) Prostate Cancer Prostatic Dis. 2016;19:395–397. doi: 10.1038/pcan.2016.30. - DOI - PubMed
    1. Gutierrez-Uzquiza A, Lopez-Haber C, Jernigan DL, Fatatis A, Kazanietz MG. PKCε is an essential mediator of prostate cancer bone metastasis. Mol. Cancer Res. 2015;13:1336–1346. doi: 10.1158/1541-7786.MCR-15-0111. - DOI - PMC - PubMed
    1. Faltermeier CM, et al. Functional screen identifies kinases driving prostate cancer visceral and bone metastasis. Proc. Natl. Acad. Sci. U. S. A. 2016;113:E172–181. doi: 10.1073/pnas.1521674112. - DOI - PMC - PubMed
    1. Tesz GJ, et al. Tumor necrosis factor alpha (TNFalpha) stimulates Map4k4 expression through TNFalpha receptor 1 signaling to c-Jun and activating transcription factor 2. J. Biol. Chem. 2007;282:19302–19312. doi: 10.1074/jbc.M700665200. - DOI - PubMed

Publication types

MeSH terms

Substances