. 2021 Jun 10;11(1):12239.
doi: 10.1038/s41598-021-91675-5.

Characterization of metapopulation of Ellobium chinense through Pleistocene expansions and four covariate COI guanine-hotspots linked to G-quadruplex conformation

Affiliations

Characterization of metapopulation of Ellobium chinense through Pleistocene expansions and four covariate COI guanine-hotspots linked to G-quadruplex conformation

Cho Rong Shin et al. Sci Rep. .

Abstract

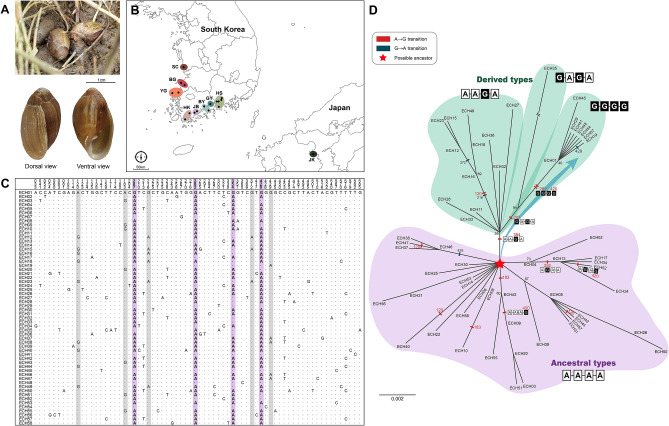
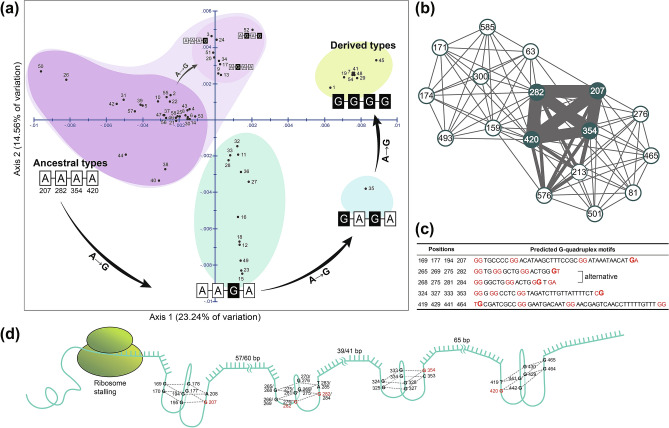
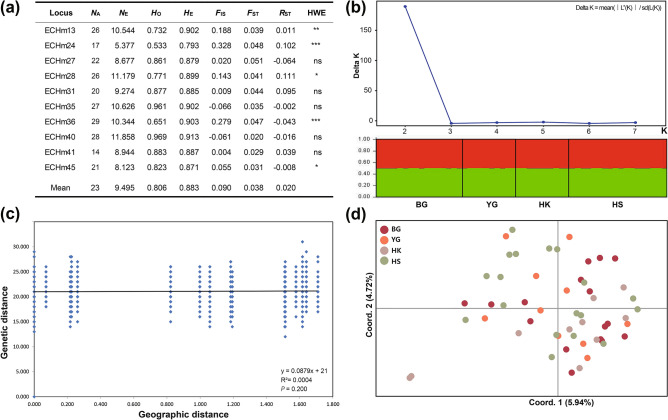
The land snail Ellobium chinense (L. Pfeiffer, 1855) (Eupulmonata, Ellobiida, Ellobiidae), which inhabits the salt marshes along the coastal areas of northwestern Pacific, is an endangered species on the IUCN Red List. Over recent decades, the population size of E. chinense has consistently decreased due to environmental interference caused by natural disasters and human activities. Here, we provide the first assessment of the genetic diversity and population genetic structures of northwestern Pacific E. chinense. The results analyzed with COI and microsatellites revealed that E. chinense population exhibit metapopulation characteristics, retaining under the influence of the Kuroshio warm currents through expansion of the Late-Middle and Late Pleistocene. We also found four phylogenetic groups, regardless of geographical distributions, which were easily distinguishable by four unidirectional and stepwise adenine-to-guanine transitions in COI (sites 207-282-354-420: A-A-A-A, A-A-G-A, G-A-G-A, and G-G-G-G). Additionally, the four COI hotspots were robustly connected with a high degree of covariance between them. We discuss the role of these covariate guanines which link to form four consecutive G-quadruplexes, and their possible beneficial effects under positive selection pressure.


Conflict of interest statement

The authors declare no competing interests.

Figures

Figure 1
Figure 1
Photographs, sampling localities, polymorphic sites inferred from COI haplotypes, and an unrooted maximum likelihood tree for Ellobium chinense inhabiting the northwestern Pacific coast (South Korea and Japan). (A) A salt grass habitat of E. chinense (Hadong, Gyeongnam, South Korea; taken in July 2020), and dorsal and views of the snail’s shell. Refer to Fig. S1 for the full landscape of the habitats. The scale bar indicates 1 cm. (B) The collection sites of E. chinense (marked with black dots) grouped into nine possible populations (colored circles). Full details are given in Table 1. (C) Alignment of 71 polymorphic sites inferred from the alignment of 58 COI haplotype sequences (Fig. S2) from 140 E. chinense individuals; 31 sites are parsimoniously informative. The four light pink columns indicate the four unidirectional stepwise A → G transition hotspots, which could be key sequences for haplotype classification. The five sites partially colored with light aquamarine are additional A → G transitions, with a few exceptional G → A transitions. Overall, guanine-rich COI sequences were evident, likely were caused by unidirectional, biased, A → G transitions during the evolution of E. chinense. (D) An unrooted maximum likelihood tree reconstructed with 58 COI haplotypes. Four different genetic groups are represented by four guanine hotspots: A–A–A–A, A–A–G–A, G–A–G–A, and G–G–G–G. These are depicted with white boxes for A and black boxes for G. The tendency for unidirectional, stepwise, A → G transitions from a plausible ancestor, A–A–A–A (pink star), to the most derived type, G–G–G–G, are shown with a large blue arrow. The additional A → G transitions and exceptional G → A transitions are marked with red and blue boxes, respectively. Node confidence values near nodes are depicted with bootstrapping values in percent. Refer to Fig. S3 for a rooted maximum likelihood tree. The photos and pictures were edited using Adobe Photoshop v.22.2 and Adobe Illustrator v.25.2 (https://www.adobe.com). The basic map is from a free map providing site (https://d-maps.com), which is modified with Adobe Illustrator v.25.2.
Figure 2
Figure 2
Results of principal coordinate analysis (PCoA), covariance of the four guanine hotspots, and plausible G-quadruplex motifs inferred from 58 COI haplotypes found in northwestern Pacific (mainly South Korean) Ellobium chinense; hypothetical ribosome stalling caused by four plausible consecutive G-quadruplex structures in the mRNA of E. chinense COI. (a) Results of PCoA. Representation of the scores on the first two axes (Axis 1 = 23.33%; Axis 2 = 14.68%) from the matrix of genetic distances estimated with the 58 COI haplotypes. Refer to Table 1 for the number of individuals along with the collection site references of the haplotypes; refer to Figs. 1C and S2 for sequence alignment of the 58 COI haplotypes. The colored circles indicate four or five genetic groups regardless of geographical distributions. The black arrows indicate unidirectional, stepwise, A → G transitions (b) Covariance test results for the four adenine/guanine hotspots that may be linked to the four guanine hotspots inferred from 58 COI haplotypes shown in Figs. 1C and S2. In addition, a node in the network represented the position of each sequence, a link represented a covariance position, and the link thickness represented covariance frequency. The detailed data are listed in Data S3. (c) Plausible selected G-quadruplex motifs linked to the four adenine/guanine hotspots on COI. For the 282-site-related motif, the two alternatives are suggested. Refer to Data S3 for the raw data from the G-quadruplex sequence motif search in COI. (d) Hypothetical ribosome stalling in the COI translation process caused by four consecutive G-quadruplex structures with intervals from 39 to 65 bp. Each structure consists of two stacked G-quadruplexes. For the 282-site-linked G-quadruplex structure, two alternative structures are depicted based on the two alternative motif sequences shown in (c). The pictures were edited using Adobe Illustrator v.25.2 (https://www.adobe.com).
Figure 3
Figure 3
Genetic diversity, population genetic structure, isolation by distance (IBD), and principal component analysis (PCoA) based on 10 selected microsatellite markers and 54 Ellobium chinense individuals collected from South Korea. (a) Summary statistics for the genetic diversity of E. chinense. NA: mean number of alleles, NE: number of effective alleles, HO: observed heterozygosity, HE: expected heterozygosity, FIS: inbreeding coefficient (indicates populations with heterozygote deficit); HWE: loci showing a significant departure from Hardy–Weinberg equilibrium with a global test at the 5% level after a sequential Bonferroni correction (*P < 0.05, **P < 0.01, ***P < 0.001, ns: not significant). (b) Determination of the true number of genetic clusters (K = 2) by Bayesian clustering using the method of Evanno et al.. K statistics are based on the rate of change in the log probability of data between successive K values. Bayesian clustering results were obtained using the STRUCTURE program. Refer to Table 1 for information on the four populations: BG, YG, HK, and HS. (c) IBD test results showing that genetic distances are not correlated with geographical distances among the sample collection sites. (d) A two-dimensional plot from the PCoA results showing that any distinct genetic differences did not exist among the four populations of E. chinense in South Korea. The percentage variation attributable to the three principal coordinate axes was 10.66% (Axis 1 = 5.94%; Axis 2 = 4.72%).
Figure 4
Figure 4
Geographical distribution of 58 COI haplotypes from Ellobium chinense in South Korea and Japan, and the results of molecular clock analysis using the haplotypes and BEAST 2.6.0. (a) Geographical distribution of 58 COI haplotypes from E. chinense shown on a map of South Korea and Japan. Each haplotype is represented by a pie chart sized in proportion to its frequency in each population. The haplotype ECH01 was observed in all populations. Results show that E. chinense from South Korea and Japan exhibit metapopulation dynamics. Given the effects of the Kuroshio warm current, the southern China populations might belong to the metapopulation (but this requires confirmation by further research). (b) Molecular clock analysis showing geological times, including the first appearance of the subfamily Ellobiinae (at the Eocene Optimum immediately after the Paleocene–Eocene Thermal Maximum; refer to Fig. S5), the divergence times of the four phylogenetic groups of E. chinense, and the periods of explosive population expansion with an increase in COI haplotype diversity [Late-Middle and Late Pleistocene prior to the Last Glacial Maximum (LGM)]. The gray columns mark interglacial periods related to haplotype divergences of E. chinense before Late-Middle Pleistocene. Light-red and light-green boxes mark the periods of rapid population expansions and the number of bifurcations (= increased haplotype diversity), respectively. The four genetic groups, depicted by A–A–A–A, A–A–G–A, G–A–G–A, and G–G–G–G, are explained in detail in Figs. 1 and 2. The full BEAST analysis results are presented in Fig. S5. Outgroups and the calibration points are described in detail in the section of “Materials and methods”. The photos and pictures were edited using Adobe Photoshop v.22.2 and Adobe Illustrator v.25.2 (https://www.adobe.com).

References

    1. Pfeiffer L. Descriptions of seven new species of land shells from the collection of H. cuming. Esq. Proc. Zool. Soc. Lond. 1864;32:603–605.
    1. Yoo JS. Korean Shells in Colour. IlJiSa Publishing Co.; 1976. pp. 1–196.
    1. Ministry of Oceans and Fisheries. Conservation and management of marine ecosystems act. Korea Ministry of Government Legislation. https://www.law.go.kr/LSW/eng/engLsSc.do?menuId=2&query=CONSERVATION+AND... (2017).
    1. Mable BK. Conservation of adaptive potential and functional diversity: Integrating old and new approaches. Conserv. Genet. 2019;20:89–100. doi: 10.1007/s10592-018-1129-9. - DOI
    1. Lande R. Genetics and demography in biological conservation. Science. 1988;241:1455–1460. doi: 10.1126/science.3420403. - DOI - PubMed

Publication types