Clinical Trial
. 2021 Jun 10;11(1):12312.
doi: 10.1038/s41598-021-91773-4.

SARS-CoV-2 serology in 4000 health care and administrative staff across seven sites in Lombardy, Italy

Affiliations
Clinical Trial

SARS-CoV-2 serology in 4000 health care and administrative staff across seven sites in Lombardy, Italy

Maria Teresa Sandri et al. Sci Rep. .

Abstract

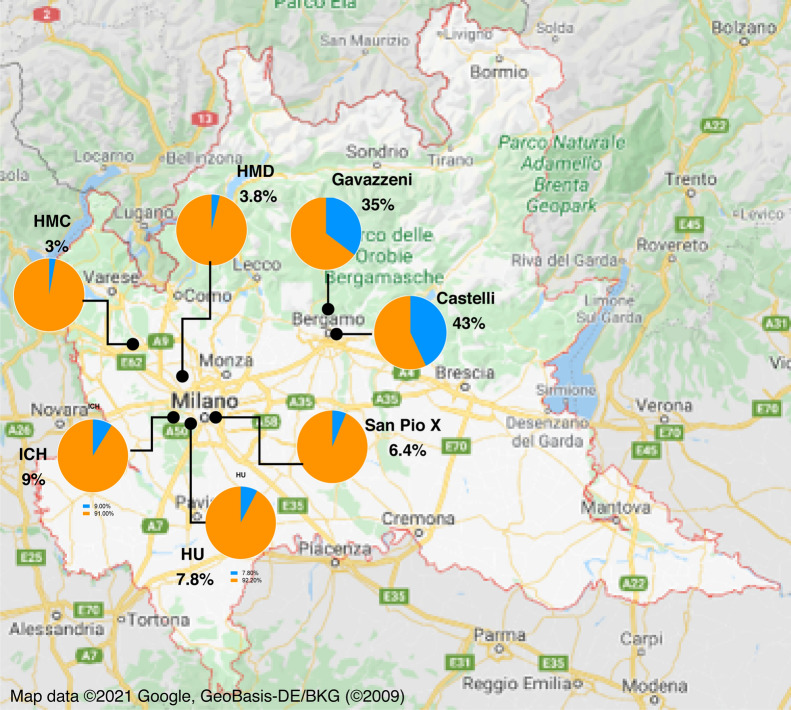
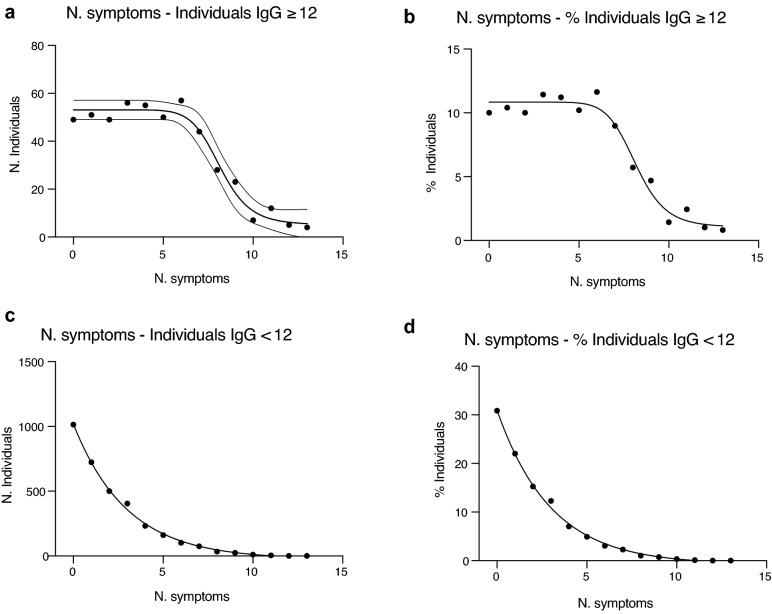
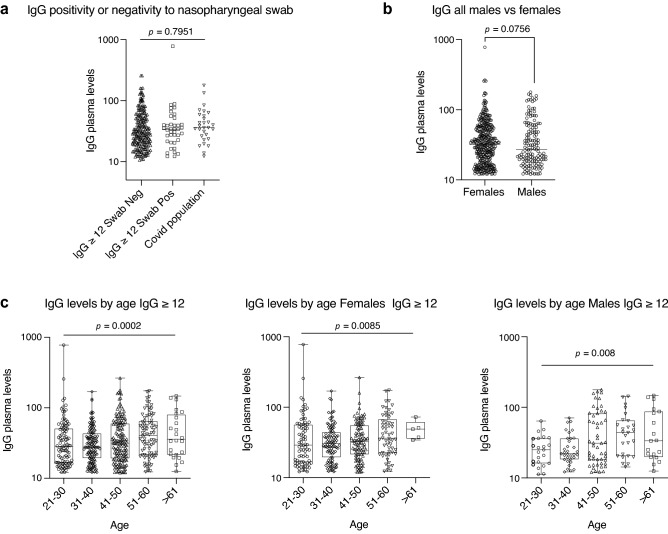
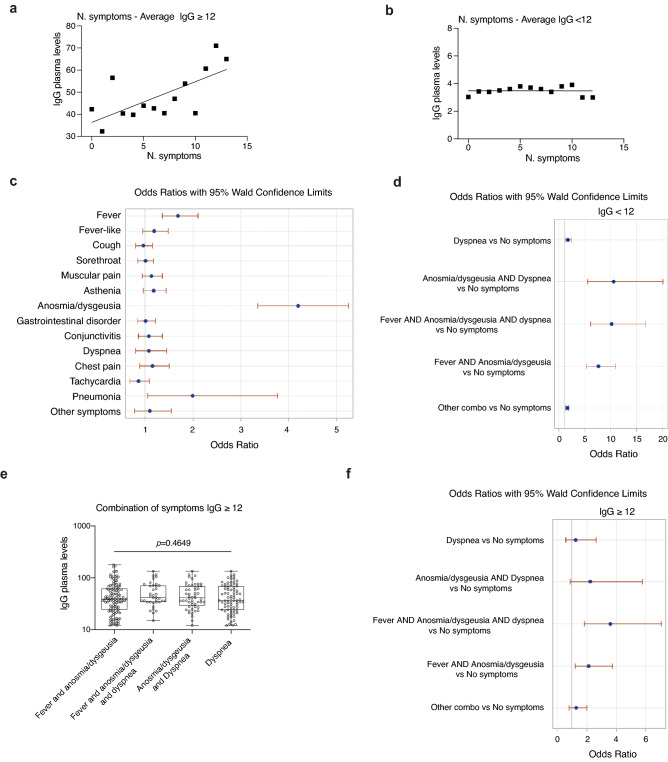
Lombardy is the Italian region most affected by COVID-19. We tested the presence of plasma anti-SARS-CoV-2 IgG antibodies in 3985 employees across 7 healthcare facilities in areas of Lombardy with different exposure to the SARS-CoV-2 epidemic. Subjects filled a questionnaire to self-report on COVID-19 symptoms, comorbidities, smoking, regular or remote working, and the exposure to COVID-infected individuals. We show that the number of individuals exposed to the virus depended on the geographical location of the facility, ranging between 3 and 43%, consistent with the spatial variation of COVID-19 incidence in Lombardy, and correlated with family interactions. We observed a higher prevalence of females than males positive for IgG, however the level of antibodies was similar, suggesting a comparable magnitude of the anti-spike antibody response. IgG positivity among smokers was lower (7.4% vs 13.5%) although without difference in IgG plasma levels. We observed 11.9% of IgG positive asymptomatic individuals and another 23.1% with one or two symptoms. Interestingly, among the IgG positive population, 81.2% of subjects with anosmia/dysgeusia and fever were SARS-CoV-2 infected, indicating that these symptoms are strongly associated to COVID-19. In conclusion, the frequency of IgG positivity and SARS-CoV-2 infection is dependent on the geographical exposure to the virus and primarily to family rather than hospital exposure.


Conflict of interest statement

The authors declare no competing interests.

Figures

Figure 1
Figure 1
Distribution of IgG positivity (≥ 12 AU/mL) across different geographical areas and healthcare facilities in Lombardy, Italy. Employees from 7 different healthcare facilities were analyzed for their anti-SARS-CoV-2 IgG positivity. Pie charts show the percentage of negative subjects (IgG < 12 AU/mL) (orange) and that of positive subjects (IgG ≥ 12 AU/mL) (blue) in each site: Istituto Clinico Humanitas (ICH), Rozzano (MI); Humanitas Gavazzeni, Bergamo; Humanitas Castelli, Bergamo; Humanitas Mater Domini (HMD), Castellanza (VA); Humanitas Medical Center (HMC), Varese (VA); Humanitas University (HU), Pieve Emanuele (MI); Humanitas San Pio X, Milan, (MI). Satellite imagery has been modified from Google Maps (Map data 2021 Google, GeoBasis-DE/BKG (2009) Legal Notices https://www.google.com/intl/it_US/help/legalnotices_maps/).
Figure 2
Figure 2
Frequency of IgG positivity (IgG ≥ 12 AU/mL) by age. (a,b) Histograms show the number (a) and the percentage (b) of positive individuals (IgG ≥ 12 AU/mL) divided by age range and sex on the whole population regardless of site (20–30: M, n = 22; F = 88; 31–40: M, n = 31; F, n = 114; 41–50: M, n = 53; F, n = 108; 51–60: M, n = 26; F, n = 56; > 60: M, n = 19; F, n = 6); in b, p-values were determined using Cuzick’s test for trend. p = 0.0374 (total); p = 0.0008 (female); p = 0.1498 (male); p = 0.0024 (interaction).
Figure 3
Figure 3
Distribution of the IgG ≥ 12 and IgG < 12 populations versus the number of symptoms. (a,b) Distribution of the IgG positive individuals (IgG ≥ 12 AU/mL) as number of individuals (a) or percentage of the population (b) versus the number of self-reported symptoms. The curve that best interpolated the data was a sigmoidal, four parameter logistic curve whereby X is the number of symptoms (R2 = 0.97). (c, d) Distribution of the IgG negative individuals (IgG < 12 AU/mL) as number of individuals (c) or percentage of the population (d) versus the number of self-reported symptoms. The curve that best interpolated the data was exponential (R2 = 0.9975).
Figure 4
Figure 4
Distribution of IgG plasma levels in the different populations. (a) Distribution of IgG plasma levels in the cohort of IgG positive individuals (IgG ≥ 12 AU/mL) negative or positive for the nasopharyngeal swab or ascertained COVID-19 disease. (b) Distribution of IgG plasma levels in IgG positive individuals (IgG ≥ 12 AU/mL) divided by sex. (c) Distribution of IgG plasma levels in IgG positive individuals (IgG ≥ 12 AU/mL) divided by age ranges and sex. In (a) and (b) p-values were determined using Cochran Mantel-Haenzel test for trend. In (c) Cuzick’s test for trend was used: p = 0.0002 (total); p = 0.0085 (female); p = 0.008 (male); p = 0.4192 (interaction).
Figure 5
Figure 5
Distribution of IgG plasma levels in relation to symptoms. (a) Distribution of IgG plasma levels versus the number of self-reported symptoms in IgG positive individuals (IgG ≥ 12 AU/mL). (b) Distribution of IgG plasma levels versus the number of self-reported symptoms in IgG negative individuals (IgG < 12 AU/mL). (c) Association between symptoms and IgG plasma levels. p < 0.0001, LR test for global null hypothesis. Odds ratio (OR) calculated with logistic regression for ordinal data. (d) Analysis of plasma levels of the whole population in relation to a combination of symptoms, p < 0.0001. Odds ratio (OR) calculated with logistic analysis for ordinal data. (e) Distribution of IgG plasma levels versus selected symptoms (alone or in combination) in individuals with IgG ≥ 12 AU/mL. p-values evaluated using Kruskal–Wallis test with Dunn’s post-hoc test. (f) Analysis of plasma levels of positive subjects (IgG ≥ 12) in relation to a combination of symptoms, p = 0.0004. Odds ratio (OR) calculated with logistic analysis for ordinal data.

References

    1. Wang W, et al. Detection of SARS-CoV-2 in different types of clinical specimens. JAMA. 2020 doi: 10.1001/jama.2020.3786. - DOI - PMC - PubMed
    1. Xie X, et al. Chest CT for typical 2019-nCoV pneumonia: Relationship to negative RT-PCR testing. Radiology. 2020 doi: 10.1148/radiol.2020200343. - DOI - PMC - PubMed
    1. Ai T, et al. Correlation of chest CT and RT-PCR testing in coronavirus disease 2019 (COVID-19) in China: A report of 1014 cases. Radiology. 2020 doi: 10.1148/radiol.2020200642. - DOI - PMC - PubMed
    1. Di Paolo M, et al. False-negative RT-PCR in SARS-CoV-2 disease: Experience from an Italian COVID-19 unit. ERJ Open Res. 2020;6:15. doi: 10.1183/23120541.00324-2020. - DOI - PMC - PubMed
    1. Li Y, et al. Stability issues of RT-PCR testing of SARS-CoV-2 for hospitalized patients clinically diagnosed with COVID-19. J. Med. Virol. 2020;92:903–908. doi: 10.1002/jmv.25786. - DOI - PMC - PubMed

Publication types