. 2021 Jun 10;4(1):718.
doi: 10.1038/s42003-021-02258-z.

Macropinocytosis requires Gal-3 in a subset of patient-derived glioblastoma stem cells

Affiliations

Macropinocytosis requires Gal-3 in a subset of patient-derived glioblastoma stem cells

Laetitia Seguin et al. Commun Biol. .

Abstract

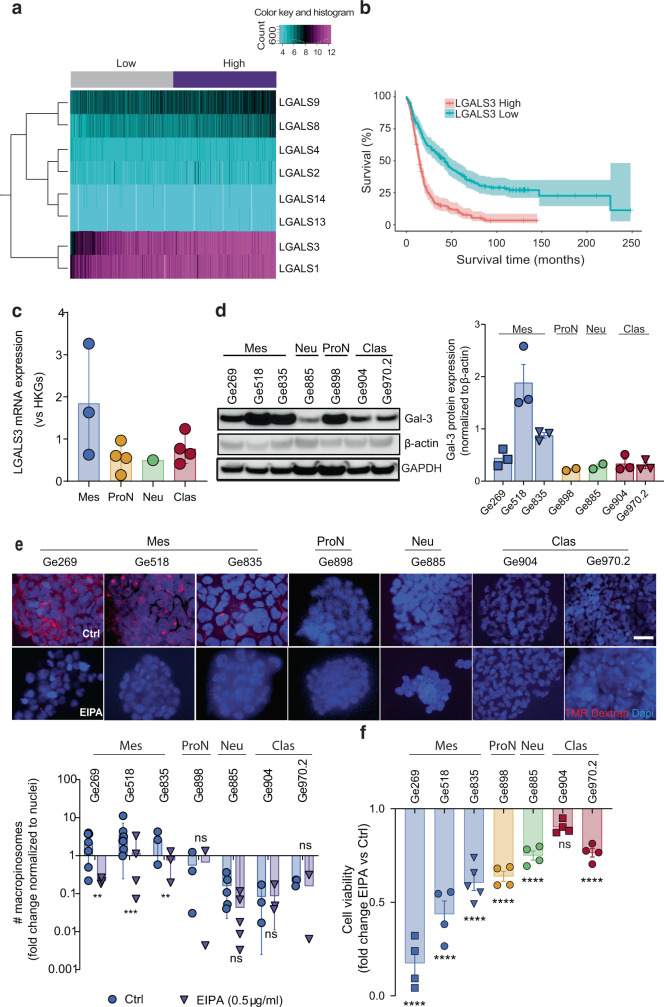
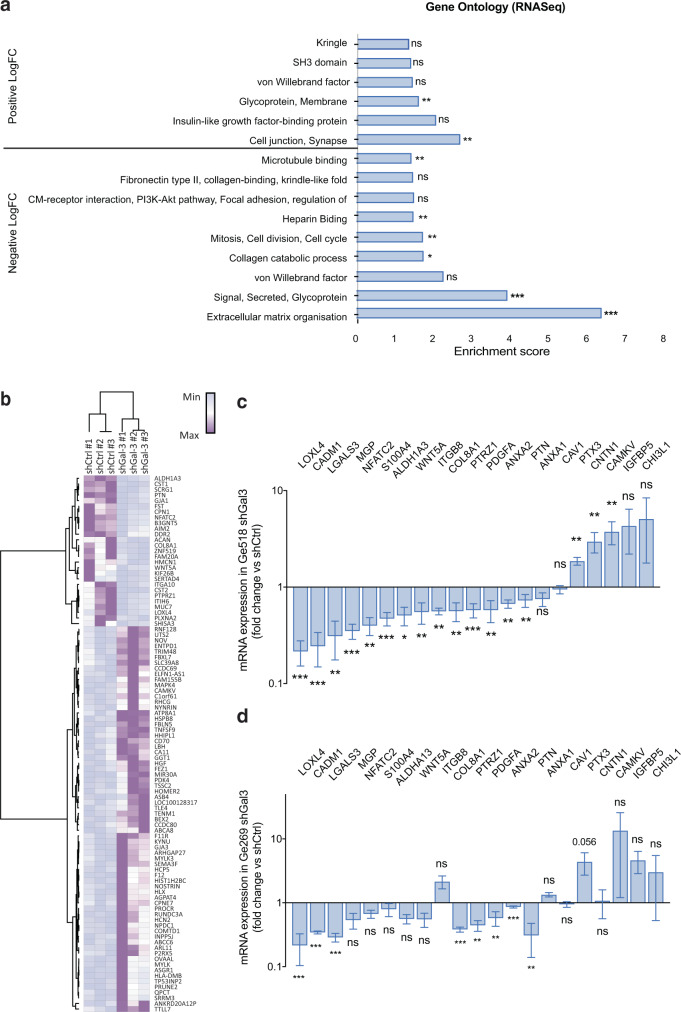
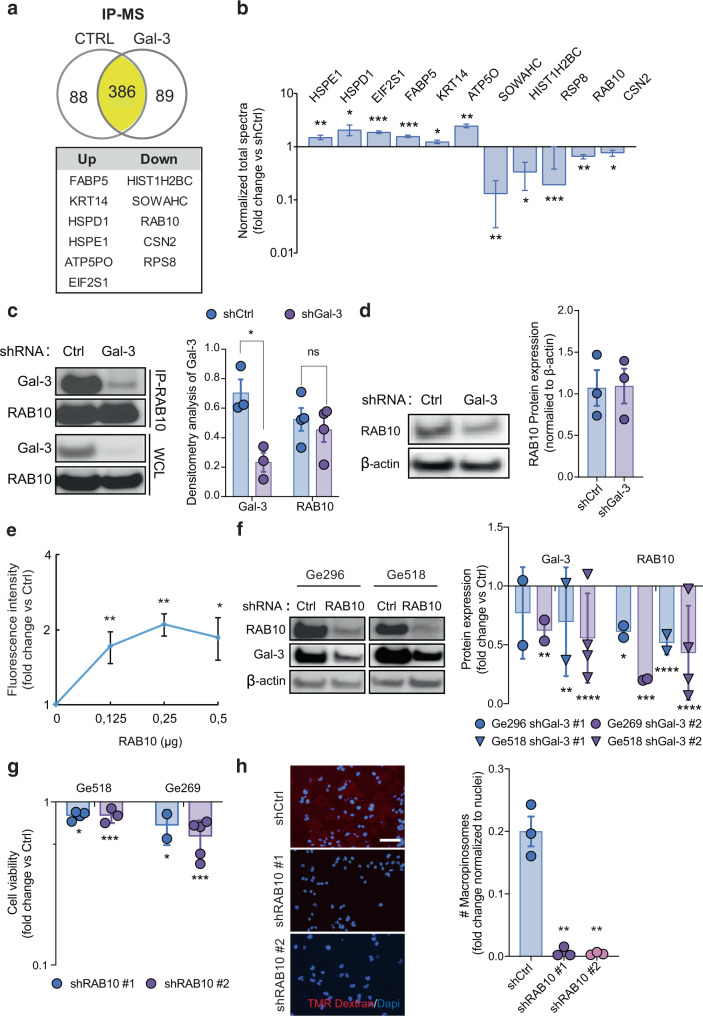
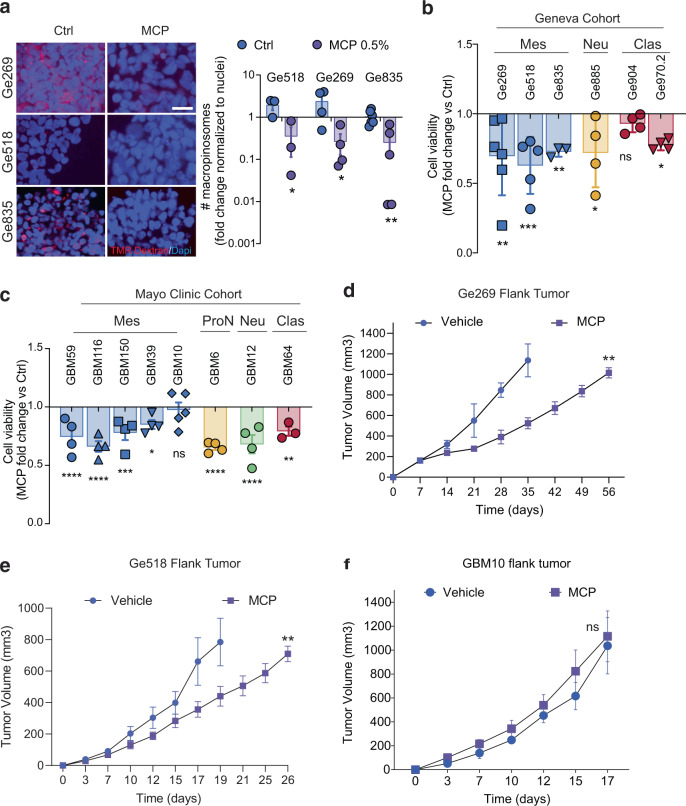
Recently, we involved the carbohydrate-binding protein Galectin-3 (Gal-3) as a druggable target for KRAS-mutant-addicted lung and pancreatic cancers. Here, using glioblastoma patient-derived stem cells (GSCs), we identify and characterize a subset of Gal-3high glioblastoma (GBM) tumors mainly within the mesenchymal subtype that are addicted to Gal-3-mediated macropinocytosis. Using both genetic and pharmacologic inhibition of Gal-3, we showed a significant decrease of GSC macropinocytosis activity, cell survival and invasion, in vitro and in vivo. Mechanistically, we demonstrate that Gal-3 binds to RAB10, a member of the RAS superfamily of small GTPases, and β1 integrin, which are both required for macropinocytosis activity and cell survival. Finally, by defining a Gal-3/macropinocytosis molecular signature, we could predict sensitivity to this dependency pathway and provide proof-of-principle for innovative therapeutic strategies to exploit this Achilles' heel for a significant and unique subset of GBM patients.


Conflict of interest statement

The authors declare no competing interests.

Figures

Fig. 1
Fig. 1. Gal-3 levels correlate with poor survival and macropinocytosis rate in GBM.
a Hierarchical clustering of galectin-3 expression correlated to a risk score predicting patient survival for the TCGA GBM dataset (n = 538 patients). Low = low-risk group; high: high-risk group. b Kaplan–Meier analysis of Rembrandt dataset for Gal-3 expression (n = 179 Gal-3low, n = 136 Gal-3high; p < 0.0001). c Gal-3 mRNA expression was determined by qPCR in GSCs. HKGs = housekeeping genes. d Immunoblots showing the expression of Gal-3 in GSCs. The histogram represents Gal-3 normalized to loading control (β-actin) determined by densitometry analysis. e Macropinocytosis uptake assay using TMR-dextran as a marker of macropinosomes (in red) in GSCs under EIPA or not. Scale bar, 10 µm. Histograms represent the fold change of macropinocytosis activity in all GSCs normalized to nuclei number (n = 2–5). f Effect of EIPA on cell viability measured by CellTiter-Glo in GSCs (n = 4–5). Data are represented as mean ± SEM (*p < 0.05, **p < 0.01 and ***p < 0.001), two-way ANOVA, Sidak’s adjusted p value. ns nonsignificant, Ctrl Vehicle (DMSO), Mes mesenchymal, ProN proneural, Neu neural, Clas classical.
Fig. 2
Fig. 2. Gal-3 is required for macropinocytosis.
a Immunoblots show expression of indicated proteins for Ge518, Ge269, and Ge835 infected by shRNA Control (Ctrl) or shGal-3. Histograms show the fold change of protein expression determined by densitometry analysis. b Macropinocytosis uptake assay using TMR-dextran in shCtrl vs. shGal-3 #2 GSCs. Scale bar, 10 µm. Histograms represent the fold change of macropinocytosis activity in Ge518, Ge269, and Ge835 normalized to nuclei number (n = 4–6). Ctrl = Vehicle (DMSO). c Cell viability of Ge518, Ge269, and Ge835 in shRNA Control (Ctrl) vs. shGal-3, measured by CellTiter-Glo in GSCs (n = 3–4). d Cell viability of Ge518 shRNA Control (Ctrl) vs. shGal-3 under EIPA treatment, measured by CellTiter-Glo in Ge518 (n = 2–3). Data are represented as mean ± SEM (*p < 0.05, **p < 0.01, and ***p < 0.001), two-way ANOVA, Dunnett’s multiple comparisons test. e Cell invasion in 3D of Ge518 shRNA Control (Ctrl) vs. shGal-3 under EIPA treatment (n = 2–3). Scale bar, 100 µm. Histograms represent the fold change of the invasion score in Ge518. Data are represented as mean ± SEM (*p < 0.05, **p < 0.01, and ***p < 0.001), two-way ANOVA, Dunnett’s multiple comparisons test. f Effect of Gal-3 knockdown on tumor growth in vivo: Ge269 shCtrl vs. shGal-3, (n = 7 mice per group), p = 0.016 (Log-rank Mantel–Cox test). g Histological analysis of Ge269 shCtrl vs. shGal-3. Tumors were stained for Gal-3, and counterstained with hematoxylin. (n = at least 3 mice per group). Scale bar, 50 µm. Data are represented as mean ± SEM (*p < 0.05, **p < 0.01, and ***p < 0.001), two-way ANOVA, Sidak’s adjusted p value. ns = nonsignificant, Ctrl = Vehicle (DMSO).
Fig. 3
Fig. 3. Gal-3 expression is modulated by hypoxia and activates Akt.
a Effect of hypoxia (1%) during 48 h on Gal-3 expression determined by qPCR in GSCs and normalized to housekeeping genes (HKGs) (n = 3–5). b Effect of hypoxia (1%) on cell viability during 72 h, measured by CellTiter-Glo. c Effect of EIPA on cell viability under hypoxic conditions during 72 h, measured by using CellTiter-Glo (n = 2–4). d Immunoblots showing expression of indicated proteins when Gal-3 is knocked down in Ge518. Histograms represent the fold change of protein expression determined by densitometry analysis (n = 4). Data are represented as mean ± SEM (*p < 0.05, **p < 0.01, and ***p < 0.001), two-way ANOVA, Sidak’s adjusted p value. ns nonsignificant, Mes mesenchymal, ProN proneural, Clas classical, Neu neural.
Fig. 4
Fig. 4. PTPRZ1, PDGFa, ANXA2, and COL8A1 expression are modulated by Gal-3.
a Functional annotation clustering of gene set enrichment analysis comparing Ge518 shCtrl vs. shGal-3. Histograms show the enrichment score of each family of genes. b Hierarchical clustering of Ge518 shCtrl vs. shGal-3 based on the differential expressed genes. c mRNA expression was determined by qPCR in Ge518 infected by shRNA Control (shCtrl) vs. shGal-3 (n = 2–3). d mRNA expression was determined by qPCR in Ge269 infected by shCtrl vs. shGal-3 (n = 2–3). Data are represented as mean ± SEM (*p < 0.05, **p < 0.01, and ***p < 0.001), Student t test. ns nonsignificant.
Fig. 5
Fig. 5. Gal-3/RAB10 interaction is a surrogate for macropinocytosis-mediated GSC survival.
a The scheme summarizes the IP-MS hits in Ge518 shCtrl vs. shGal-3. b Histograms represent the fold change of normalized total spectra for significantly identified proteins by IP-MS analysis, in Ge518 shCtrl vs. shGal-3. c Immunoblot analysis of RAB10 immunoprecipitation from Ge518 shCtrl vs. shGal-3. Histograms represent the fold change of Gal-3 and RAB10 expression determined by densitometry analysis (n = 3–4). WCL whole-cell lysate. d Immunoblots show expression of indicated proteins for Ge518 shCtrl or shGal-3. Histograms show the fold change of protein expression determined by densitometry analysis (n = 3). e A cell-free binding assay shows direct binding between RAB10 and Gal-3 (n = 4). f Immunoblots show expression of indicated proteins for Ge518 and Ge269 shCtrl vs. shRAB10. Histograms show the fold change of protein expression determined by densitometry analysis. g Effect of RAB10 knockdown on cell viability measured by CellTiter-Glo in Ge518 and Ge269. h Macropinocytosis uptake assay using TMR-dextran in Ge518 shCtrl vs. shRAB10. The histogram represents the fold change of macropinocytosis activity in Ge518 normalized to nuclei number (n = 3). Data are represented as mean ± SEM (*p < 0.05, **p < 0.01, and ***p < 0.001), two-way ANOVA, Dunnett’s multiple comparisons test. ns nonsignificant.
Fig. 6
Fig. 6. Macropinocytosis blockade can be predicted by a transcriptomic signature.
a Heatmap showing the transcriptomic signature used for the Mayo Clinic sample request. Samples were requested based on their macropinocytosis addicted vs. non-addicted signature. The Black dotted rectangle represents Gal-3/macropinocytosis addicted patients. b Macropinocytosis uptake assay using TMR–dextran in Mayo Clinic GSC samples. Histograms represent the fold change of macropinocytosis activity in all GSCs normalized to nuclei number (n = 3–6). c Effect of EIPA on cell viability measured by CellTiter-Glo in GSCs (n = 3–5). Data are represented as mean ± SEM (*p < 0.05, **p < 0.01, and ***p < 0.001), two-way ANOVA, Sidak’s adjusted p value. ns nonsignificant, Mes mesenchymal, ProN proneural, Clas classical.
Fig. 7
Fig. 7. MCP disrupts Gal-3/RAB10 binding and inhibits macropinocytosis-mediated GSC survival.
a Macropinocytosis uptake assay using TMR-dextran in GSCs. Histograms represent the fold change of macropinocytosis activity in Ge518, Ge269, and Ge835 treated with MCP compared to their control (n = 3–5). Scale bar, 10 µm. b Effect of MCP on cell viability measured by CellTiter-Glo in GSCs (n = 3–6). c Effect of MCP on cell viability measured by CellTiter-Glo in GSCs (n = 3–5). df Mice were randomized and treated with either vehicle control (n = 5) or MCP (n = 5; 1% orally in the drinking water) after injection of Ge269, Ge518, and GBM10 cells, respectively. Data are represented as mean ± SEM (*p < 0.05, **p < 0.01, and ***p < 0.001), two-way ANOVA, Sidak’s adjusted p value. ns nonsignificant, Ctrl vehicle (H2O).

References

    1. Louis DN, et al. The 2016 World Health Organization Classification of Tumors of the Central Nervous System: a summary. Acta Neuropathol. 2016;131:803–820. doi: 10.1007/s00401-016-1545-1. - DOI - PubMed
    1. Stupp R, et al. Radiotherapy plus concomitant and adjuvant temozolomide for glioblastoma. N. Engl. J. Med. 2005;352:987–996. doi: 10.1056/NEJMoa043330. - DOI - PubMed
    1. Verhaak RG, et al. Integrated genomic analysis identifies clinically relevant subtypes of glioblastoma characterized by abnormalities in PDGFRA, IDH1, EGFR, and NF1. Cancer Cell. 2010;17:98–110. doi: 10.1016/j.ccr.2009.12.020. - DOI - PMC - PubMed
    1. Brennan CW, et al. The somatic genomic landscape of glioblastoma. Cell. 2013;155:462–477. doi: 10.1016/j.cell.2013.09.034. - DOI - PMC - PubMed
    1. Freije WA, et al. Gene expression profiling of gliomas strongly predicts survival. Cancer Res. 2004;64:6503–6510. doi: 10.1158/0008-5472.CAN-04-0452. - DOI - PubMed

Publication types

MeSH terms