

Temporal Bacterial Community Diversity in the Nicotiana tabacum Rhizosphere Over Years of Continuous Monocropping
- PMID: 34113322
- PMCID: PMC8186668
- DOI: 10.3389/fmicb.2021.641643
Temporal Bacterial Community Diversity in the Nicotiana tabacum Rhizosphere Over Years of Continuous Monocropping
Abstract
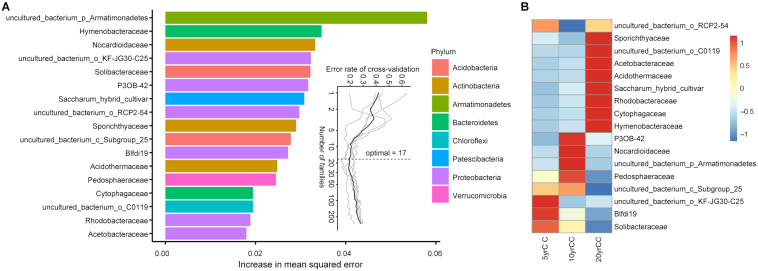
Long-term continuous monocropping negatively influences the physicochemical and biological characteristics of cultivated soil, especially for the economically important crop of flue-cured tobacco that is intolerant to continuous monocropping. The underlying mechanism of soil sickness under continuous monoculture and the temporal dynamic changes over the tobacco life cycle among different monoculture time spans remain poorly characterized. In this study, high-throughput sequencing targeting the 16S rRNA gene phylogenetic marker was performed on 60 soil samples of rhizosphere soil from flue-cured tobacco in the replanting, growth and harvest period across 5, 10, and 20 years of a continuous monocropping system. Bacterial community diversity decreased with the increase in duration of continuous monocropping, and the rhizosphere microbiota was highly dynamic in the harvest period. The random forests algorithm identified 17 taxa as biomarkers and a model was established to correlate root microbiota with continuous monocropping time of flue-cured tobacco. Molecular ecological network analysis elaborated the differences and interactions in bacterial co-occurrence patterns under different monocropping systems. The co-occurrence microbial network was larger in size but there were fewer interactions among microbial communities with the increase in continuous monocropping duration. These results provide insights into the changes of flue-cured tobacco root microbiome diversity in response to continuous monocropping and suggest a model for successional dynamics of the root-associated microbiota over continuous monocropping time and development stage. This study may help elucidate the theoretical basis underlying obstacles to continuous monocropping and could contribute to improving guidance for tobacco production.
Keywords: continuous monocropping; flue-cured tobacco; microbial community; monoculture problems; rhizosphere soil.
Copyright © 2021 Yan, Zhang, Duan, Zhang, Zheng and Lai.
Conflict of interest statement
WD is employed by the company China Tobacco Sichuan Industrial Co., Ltd. The remaining authors declare that the research was conducted in the absence of any commercial or financial relationships that could be construed as a potential conflict of interest.
Figures


Similar articles
-
Integrative analysis of microbiome and metabolome revealed the effect of microbial inoculant on microbial community diversity and function in rhizospheric soil under tobacco monoculture.Microbiol Spectr. 2024 Aug 6;12(8):e0404623. doi: 10.1128/spectrum.04046-23. Epub 2024 Jul 11. Microbiol Spectr. 2024. PMID: 38989997 Free PMC article.
-
Diversity patterns of soil microbial communities in the Sophora flavescens rhizosphere in response to continuous monocropping.BMC Microbiol. 2020 Aug 31;20(1):272. doi: 10.1186/s12866-020-01956-8. BMC Microbiol. 2020. PMID: 32867674 Free PMC article.
-
Microbial Cross-Talk: Dissecting the Core Microbiota Associated With Flue-Cured Tobacco (Nicotiana tabacum) Plants Under Healthy and Diseased State.Front Microbiol. 2022 Apr 14;13:845310. doi: 10.3389/fmicb.2022.845310. eCollection 2022. Front Microbiol. 2022. PMID: 35495684 Free PMC article.
-
Rhizosphere Microbial Community Diversity and Function Analysis of Cut Chrysanthemum During Continuous Monocropping.Front Microbiol. 2022 Mar 16;13:801546. doi: 10.3389/fmicb.2022.801546. eCollection 2022. Front Microbiol. 2022. PMID: 35369487 Free PMC article.
-
Differences in soil physicochemical properties and rhizosphere microbial communities of flue-cured tobacco at different transplantation stages and locations.Front Microbiol. 2023 Apr 20;14:1141720. doi: 10.3389/fmicb.2023.1141720. eCollection 2023. Front Microbiol. 2023. PMID: 37152740 Free PMC article.
Cited by
-
Differential response of bacterial diversity and community composition to different tree ages of pomelo under red and paddy soils.Front Microbiol. 2022 Jul 22;13:958788. doi: 10.3389/fmicb.2022.958788. eCollection 2022. Front Microbiol. 2022. PMID: 35935198 Free PMC article.
-
Long-term continuous mono-cropping of Macadamia integrifolia greatly affects soil physicochemical properties, rhizospheric bacterial diversity, and metabolite contents.Front Microbiol. 2022 Oct 6;13:952092. doi: 10.3389/fmicb.2022.952092. eCollection 2022. Front Microbiol. 2022. PMID: 36274682 Free PMC article.
-
Soil metabolomics and bacterial functional traits revealed the responses of rhizosphere soil bacterial community to long-term continuous cropping of Tibetan barley.PeerJ. 2022 Apr 7;10:e13254. doi: 10.7717/peerj.13254. eCollection 2022. PeerJ. 2022. PMID: 35415021 Free PMC article.
-
Crop rotations increased soil ecosystem multifunctionality by improving keystone taxa and soil properties in potatoes.Front Microbiol. 2023 Feb 23;14:1034761. doi: 10.3389/fmicb.2023.1034761. eCollection 2023. Front Microbiol. 2023. PMID: 36910189 Free PMC article.
-
Accumulation of coumaric acid is a key factor in tobacco continuous cropping obstacles.Front Plant Sci. 2024 Oct 28;15:1477324. doi: 10.3389/fpls.2024.1477324. eCollection 2024. Front Plant Sci. 2024. PMID: 39529931 Free PMC article.
References
-
- Blagodatskaya E., Kuzyakov Y. (2013). Active microorganisms in soil: critical review of estimation criteria and approaches. Soil Biol. Biochem. 67 192–211. 10.1016/j.soilbio.2013.08.024 - DOI
LinkOut - more resources
Full Text Sources