. 2021 May 25:12:668680.
doi: 10.3389/fimmu.2021.668680. eCollection 2021.

Characterization of Human CD4 T Cells Specific for a C-Peptide/C-Peptide Hybrid Insulin Peptide

Affiliations

Characterization of Human CD4 T Cells Specific for a C-Peptide/C-Peptide Hybrid Insulin Peptide

Timothy A Wiles et al. Front Immunol. .

Abstract

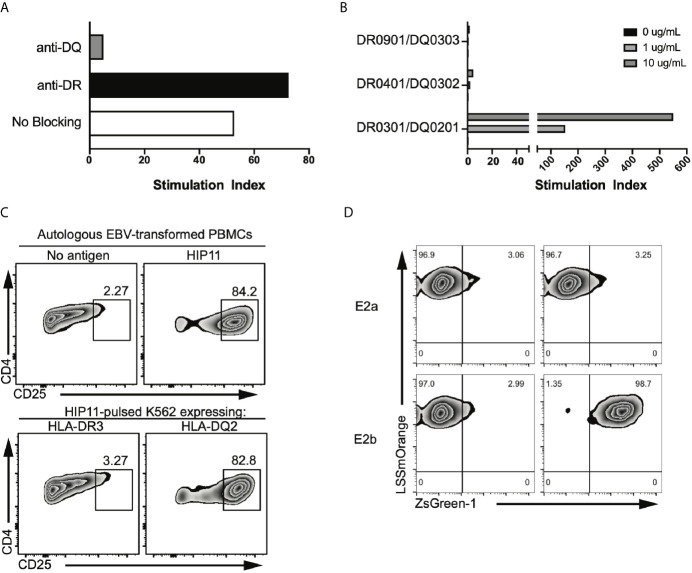
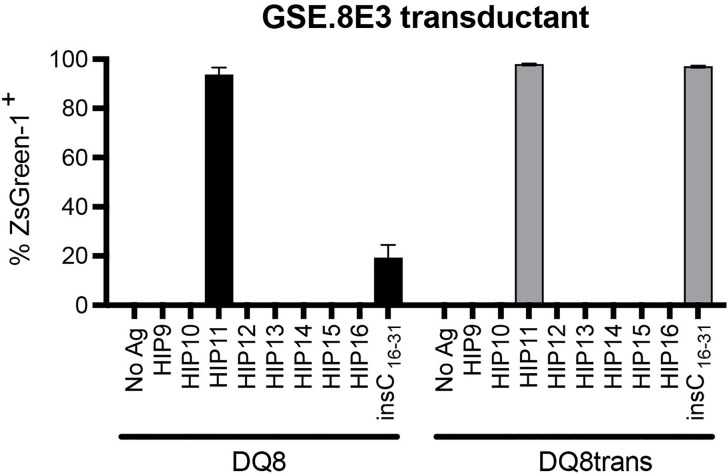
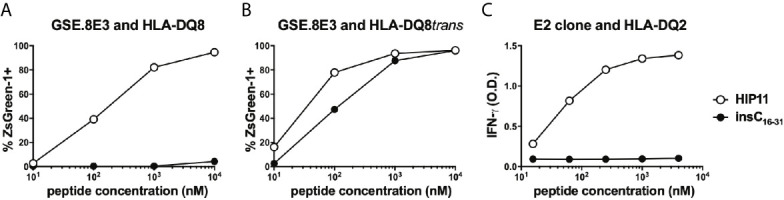
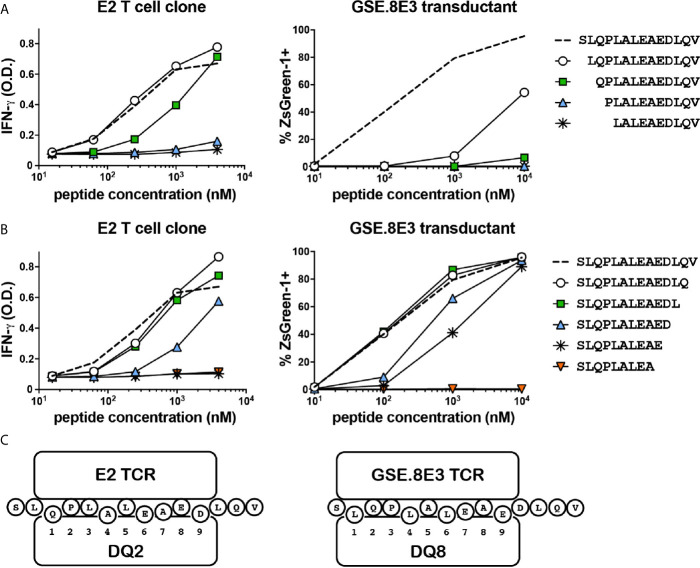
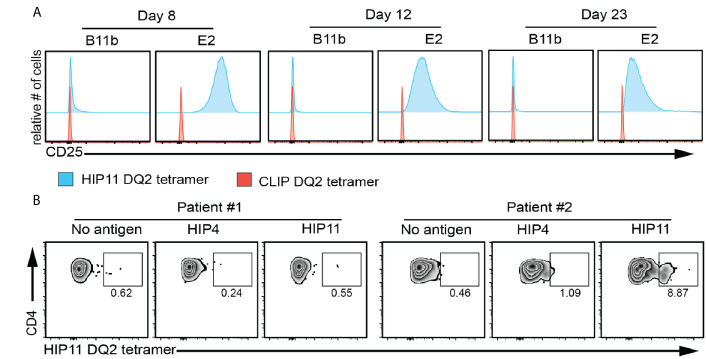
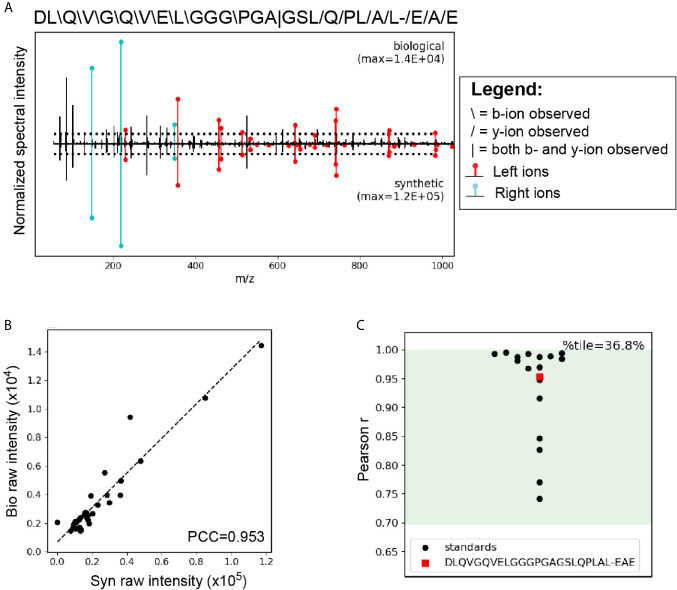
Hybrid Insulin Peptides (HIPs), which consist of insulin fragments fused to other peptides from β-cell secretory granule proteins, are CD4 T cell autoantigens in type 1 diabetes (T1D). We have studied HIPs and HIP-reactive CD4 T cells extensively in the context of the non-obese diabetic (NOD) mouse model of autoimmune diabetes and have shown that CD4 T cells specific for HIPs are major contributors to disease pathogenesis. Additionally, in the human context, HIP-reactive CD4 T cells can be found in the islets and peripheral blood of T1D patients. Here, we performed an in-depth characterization of the CD4 T cell response to a C-peptide/C-peptide HIP (HIP11) in human T1D. We identified the TCR expressed by the previously-reported HIP11-reactive CD4 T cell clone E2, which was isolated from the peripheral blood of a T1D patient, and determined that it recognizes HIP11 in the context of HLA-DQ2. We also identified a HIP11-specific TCR directly in the islets of a T1D donor and demonstrated that this TCR recognizes a different minimal epitope of HIP11 presented by HLA-DQ8. We generated and tested an HLA-DQ2 tetramer loaded with HIP11 that will enable direct ex vivo interrogation of CD4 T cell responses to HIP11 in human patients and control subjects. Using mass spectrometric analysis, we confirmed that HIP11 is present in human islets. This work represents an important step in characterizing the role of CD4 T cell responses to HIPs in human T1D.

Keywords: CD4; autoimmunity; hybrid insulin peptides; mass spectrometry; neoepitope; tetramer; type 1 diabetes.


Conflict of interest statement

The authors declare that the research was conducted in the absence of any commercial or financial relationships that could be construed as a potential conflict of interest.

Figures

Figure 1
Figure 1
The E2 TCR consisting of the TRAV8-2/8-4 TCRα chain and the TRBV5-4 TCRβ chain recognizes HIP11 in the context of DQ2. (A) Peptide-specific proliferation of the E2 T cell clone was assessed using cells from an autologous EBV transformed B cell line as antigen presenting cells and pulsing with 10 µg/mL of the cognate HIP11 peptide in the presence or absence of anti-DR (black bar) or anti-DQ (grey bar) blocking antibody. (B) HLA restriction was further defined using cells from partially HLA-matched third-party donors as antigen presenting cells. Irradiated PBMC from each third party donor were pulsed with the cognate HIP11 peptide at concentrations of 0, 1, and 10 µg/mL. Substantial proliferation was observed only in response to the DQA1*05:01-DQB1*02:01 (HLA-DQ2) positive antigen presenting cells, indicating a DQA1*05:01-DQB1*02:01-restricted response. All data are represented as stimulation index (SI) values, calculated by normalizing the proliferation of the T cell clone based on [3H] thymidine incorporation of un-stimulated wells. (C) To confirm DQ2 restriction, the E2 T cell clone was cultured in the presence of either an autologous B cell line or K562 lines expressing DR3 or DQ2. After 18h, cells were harvested and stained for CD4 and CD25, and CD25 expression was monitored by flow cytometry. Data is representative of 3 independent experiments. (D) Two TCR alpha sequences and one beta sequence were identified from the E2 clone. Each TCR alpha/beta combination, E2a and E2b, was expressed in 5KC T-hybridoma cells with an NFAT-reporter. ZsGreen-1 is expressed upon T cell activation. The E2a and E2b TCR transductants were cultured with the HIP-11 peptide in the presence of K562 cells expressing DQ2 followed by evaluation of ZsGreen-1 expression by flow cytometry.
Figure 2
Figure 2
The GSE.8E3 transductant recognizes HIP11 in the context of DQ8 and DQ8-trans. The GSE.8E3 TCR clonotype identified from a CD4 T cell in the islets of a T1D organ donor was expressed in 5KC T-hybridoma cells with an NFAT-reporter. The GSE.8E3 TCR transductant was cultured with or without various HIPs (10 μM) or a native proinsulin peptide (100 μM) in the presence of K562 cells expressing DQ8 (black bars) or DQ8-trans (gray bars). ZsGreen-1 expression was evaluated by flow cytometry. Each result is the mean for three independent experiments. Error bars indicate the standard error of the mean.
Figure 3
Figure 3
Response of HIP11-reactive T cells to insulin C-peptide. (A, B) The GSE.8E3 TCR transductant was cultured with various concentrations of a HIP11 peptide or an insulin C-peptide sequence in the presence of K562 cells expressing DQ8 (A) or DQ8trans (B). ZsGreen-1 positivity was assessed by flow cytometry as a measure of activation. Data are representative of three independent experiments. (C) The E2 T cell clone was cultured with various concentrations of a HIP11 peptide or an insulin C-peptide sequence in the presence of an autologous EBV-transformed B cell line. After 48 hours, supernatants from T cell cultures were harvested and IFN-γ concentrations were measured by ELISA. Results are representative of two independent experiments.
Figure 4
Figure 4
The E2 CD4 T cell clone and the GSE.8E3 TCR transductant recognize different minimal epitopes. N-terminally (A) and C-terminally (B) truncated HIP11 peptides were tested with E2 and GSE.8E3 for antigenicity. Results are representative of three independent experiments. (C) Proposed binding registers for HIP11 in the context of DQ2 or DQ8 when recognized by E2 or GSE.8E3, respectively.
Figure 5
Figure 5
HIP11/DQ2 tetramer stains the E2 T cell clone and PBMCs from a T1D patient. (A) The E2 or B11b T cell clones were stimulated with HIP11 or HIP4 respectively and an irradiated autologous EBV-transformed B cell line. T cells were then maintained in culture and harvested at 8, 12 and 23 days post-stimulation and stained with the DQ2/HIP11 tetramer (blue histograms) or DQ2/CLIP tetramer (red histograms), CD4, and a fixable viability dye. Tetramer staining was assessed by flow cytometry by gating on live, CD4+ cells. Data are representative of two independent experiments. (B) PBMCs from two DQ2+ patients were isolated, stained with CFSE and cultured with medium only, HIP4, or HIP11. After 10 days, cells were harvested and stained with the DQ2/HIP11 tetramer, anti-CD4 and anti-CD25 antibodies, and a fixable viability dye before flow cytometry analysis. Gates were set on live, CD4+ CD25+ CFSElow events and the percentage of tetramer positive events is reported.
Figure 6
Figure 6
LC-MS/MS analysis using the P-VIS approach confirms that HIP11 is present in human islets. Proteins were extracted from human islets, fractionated by size exclusion chromatography (SEC), and digested with the protease AspN, which cleaves at the N-terminus of aspartic acid (D) residues. Samples were analyzed by LC-MS/MS and data were searched using Agilent Spectrum Mill software. The predicted HIP11 AspN cleavage product DLQVGQVELGGGPGAGSLQPLAL-EAE was identified with high confidence and validated using the P-VIS approach. (A) Mirror plot generated by PSM_validator displaying the spectrum from the biological sample (positive y-axis) and the spectrum from the validation sample (negative y-axis). Peak intensities are normalized to the most intense peak in each spectrum. The intensity of the tallest peak in each spectrum is indicated. In the sequence map, “”, “/”, and “|” indicate that the spectrum from the biological sample contained a b-ion, y-ion, or both, respectively, corresponding to fragmentation at a given bond. Horizontal dotted lines indicate the user-defined threshold for consideration of peaks in the Pearson correlation coefficient (PCC) calculation. Ions corresponding to fragmentation of a bond to the left (L ions) or right (R ions) of the hybrid junction are labeled in red and cyan, respectively. (B) Peaks that were present above the intensity threshold in at least one of the spectra were used to calculate the Pearson correlation coefficient (PCC) between the two spectra. For each peak, the intensity in the biological peptide spectrum (bio raw intensity) and the intensity in the spectrum for the synthetic peptide (syn raw intensity) were paired, and the pairs for all peaks were plotted. Calculation of the PCC for these values indicated that the spectra were highly correlated (PCC = 0.953). (C) Comparison of the PCC for the HIP11 match to the distribution of PCCs for internal standard peptides (ISPs). Data for the ISPs passed the D’Agostino-Pearson omnibus normality test (p = 0.229; p > 0.05 indicates that the null hypothesis cannot be rejected and the data can be treated as normal). Green shading indicates the 95% prediction interval based on one-tailed analysis of Fisher’s z-transformed PCC values. The PCC comparing the biological spectrum and the validation spectrum is shown (red square), and the percentile (%tile) is reported.

Similar articles

Cited by

References

    1. Delong T, Wiles TA, Baker RL, Bradley B, Barbour G, Reisdorph R, et al. . Pathogenic CD4 T Cells in Type 1 Diabetes Recognize Epitopes Formed by Peptide Fusion. Science (80- ) (2016) 351:711–4. 10.1126/science.aad2791 - DOI - PMC - PubMed
    1. Wiles TA, Powell R, Michel CR, Scott Beard K, Hohenstein A, Bradley B, et al. . Identification of Hybrid Insulin Peptides (HIPs) in Mouse and Human Islets by Mass Spectrometry. J Proteome Res (2019) 18:814–25. 10.1021/acs.jproteome.8b00875 - DOI - PMC - PubMed
    1. Wan X, Vomund AN, Peterson OJ, Chervonsky AV, Lichti CF, Unanue ER. The MHC-II Peptidome of Pancreatic Islets Identifies Key Features of Autoimmune Peptides. Nat Immunol (2020) 21:455–63. 10.1038/s41590-020-0623-7 - DOI - PMC - PubMed
    1. Baker RL, Jamison BL, Wiles TA, Lindsay RS, Barbour G, Bradley B, et al. . CD4 T Cells Reactive to Hybrid Insulin Peptides Are Indicators of Disease Activity in the NOD Mouse. Diabetes (2018) 67:1836–46. 10.2337/db18-0200 - DOI - PMC - PubMed
    1. Babon JAB, DeNicola ME, Blodgett DM, Crèvecoeur I, Buttrick TS, Maehr R, et al. . Analysis of Self-Antigen Specificity of Islet-Infiltrating T Cells From Human Donors With Type 1 Diabetes. Nat Med (2016) 22:1482–7. 10.1038/nm.4203 - DOI - PMC - PubMed

Publication types

MeSH terms