. 2021 May 25:12:674279.
doi: 10.3389/fimmu.2021.674279. eCollection 2021.

A Virus-Specific Immune Rheostat in the Immunome of Patients Recovering From Mild COVID-19

Affiliations

A Virus-Specific Immune Rheostat in the Immunome of Patients Recovering From Mild COVID-19

Joo Guan Yeo et al. Front Immunol. .

Abstract

An accurate depiction of the convalescent COVID-19 immunome will help delineate the immunological milieu crucial for disease resolution and protection. Using mass cytometry, we characterized the immune architecture in patients recovering from mild COVID-19. We identified a virus-specific immune rheostat composed of an effector T (Teff) cell recall response that is balanced by the enrichment of a highly specialized regulatory T (Treg) cell subset. Both components were reactive against a peptide pool covering the receptor binding domain (RBD) of the SARS-CoV-2 spike glycoprotein. We also observed expansion of IFNγ+ memory CD4+ T cells and virus-specific follicular helper T (TFH) cells. Overall, these findings pinpoint critical immune effector and regulatory mechanisms essential for a potent, yet harmless resolution of COVID-19 infection.

Keywords: COVID-19; SARS-CoV-2; follicular helper T cells; mass cytometry; regulatory T cells.


Conflict of interest statement

The authors declare that the research was conducted in the absence of any commercial or financial relationships that could be construed as a potential conflict of interest.

Figures

Figure 1
Figure 1
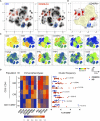
Residual post-COVID-19 immune signatures during the convalescent phase. (A) Density plots after t-SNE dimensionality reduction demonstrate a similarity between the convalescent and healthy immunomes. Each density plot is derived from the random sampling of 50,000 single events from the concatenated mass cytometry data from 9 HD and 19 COVID-19 subjects for their respective plot. The red outlines demarcate statistically different cell clusters between COVID-19 patients and HD. (B) Total CD3+CD4+T cells (merged FlowSOM CD3+CD4+ clusters), CXCR3+CD11b+CD14+ monocytes, CD3-CD56+ NK cells (merged FlowSOM CD3-CD56+ clusters) and Lin-CD11c-HLA-DR+CD303+CD304+ pDC showing statistically significant differences between COVID-19 and HD. Significantly different cell clusters are coloured blue (enriched in HD) or red (enriched in COVID-19 patients). Scatter plot of 280,000 single cell events with 10,000 per subject (n = 19, COVID-19 and n = 9, HD). (C) Comparison of FlowSOM-derived cell frequencies of CD3+CD4+ T cells, CXCR3+CD11b+CD14+ monocytes, CD3-CD56+ NK cells and pDC between HD and COVID-19 convalescent patients. The FlowSOM-derived cell frequencies strongly correlated with the bivariate gated cell frequencies ( Supplemental Figure 3 ), indicating the reliability of the FlowSOM-derived cluster frequencies for statistical inferences. (D) t-SNE plots with embedded marker expression included 280,000 single cell events with 10,000 per subject (n = 19, COVID-19 and n = 9, HD). Median and interquartile range (IQR) are shown. Mann–Whitney U (two-tailed) test, p < 0.05: statistically significant. Unstimulated PBMCs were stained with COVID-19 panel (B) ( Supplemental Table 2 ).
Figure 2
Figure 2
Immunological changes in the memory compartment (CD45RO+CD45RA-) of the CD3+CD4+ cell subsets bear mechanistically important functional markers during the convalescent phase. (A) Density plots after t-SNE dimensional reduction show a convalescent immunome with visible differences when compared to the healthy immunome. Each density plot is derived from random sampling of 50,000 single events from concatenated mass cytometry data from 9 HD and 1019 COVID-19 subjects for their respective plot. (B) Persistent perturbations predominantly involve the CD45RO+CD45RA-CD3+CD4+ (outside yellow demarcated area) T cell subset. Clusters showing statistically significant differences are coloured blue (enriched in HD) or red (enriched in disease). These regions are overlaid onto the density plots in (A). Scatter plot of 280,000 single cell events with 10,000 per subject (n = 19, COVID-19 and n = 9, HD). (C) t-SNE with embedded marker expression. (D) Scaled median (arcsine transformed) marker expression profiles (heat maps) of significant FlowSOM clusters and their frequencies depicted as a percentage of CD45+ PBMC (n = 19, COVID-19 and n = 9, HD). Median and IQR are shown. Mann–Whitney U (two-tailed) test, p < 0.05 for these seven clusters. Stimulated PBMCs (with PMA and ionomycin) were stained with COVID-19 panel (A) ( Supplemental Table 1 ).
Figure 3
Figure 3
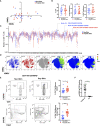
TIGIT+ T-follicular helper cells specific for the RBD region of the SARS-CoV-2 spike glycoprotein are present in COVID-19 convalescent patients. PBMCs from convalescent patients (n = 14) were stimulated for 72 h with/without a peptide pool covering the RBD of the SARS-CoV-2 spike glycoprotein and interrogated with COVID panel (A). (A) FlowSOM cluster frequencies of CD3+CD14-CD19-CD4+CD8- T cells were dimensionally reduced with t-SNE. (B) Gated frequencies of CD3+CD4+, CD3+CD4+CD25-/+FoxP3-(Teff)CD45RA-CD45RO+ or CD3+CD4+CD25+FoxP3+(Treg)CD45RA-CD45RO+ as percentages of CD3+ or CD4+ parent lineages. (C) Relative percentages of FlowSOM clusters (k = 60) of CD4+ T cells, with significant clusters reflected. Data represent the mean ± SD; Mann–Whitney U (two-tailed) test, *p < 0.05, **p < 0.01. (D) tSNE maps reflecting density, location and marker expression of cluster 56 (red circles). (E) Frequencies of CD4+CD25+/-FoxP3-(Teff) CD45RO+CD45RA-CXCR5+ or CD4+CD25+/-FoxP3-(Teff)CD45RO+CD45RA-CXCR5+TIGIT+ as a percentage of CD4+ T cells. Data represent the mean ± SD, Mann–Whitney U (two-tailed) test, *p < 0.05, ****p < 0.0001. (F) Anti-RBD IgG OD (optical density) readings of convalescent patient plasma (n = 19) and HD (n = 9). Data represent the mean ± SD, Mann–Whitney U (two-tailed) test, *p < 0.05, ****p < 0.0001. NonStim, peptide solvent control; Peptide Stim, stimulation with peptide pool; ns, statistically not significant.
Figure 4
Figure 4
Parallel antigen-specific Th1 responses generated by regulatory and effector subsets. PBMCs from convalescent patients (n = 14) were stimulated for 72 h with/without a peptide pool covering the RBD of the SARS-CoV-2 spike glycoprotein and interrogated with COVID panel A. (A) Frequencies of CD3+CD4+CD25+FoxP3+(Treg)CXCR3+Tbet+, CD3+CD4+CD25+FoxP3+(Treg)CXCR3+CD45RO+, CD3+CD4+CD25+FoxP3+(Treg)CXCR3+CD152+ or CD3+CD4+CD25+FoxP3+(Treg)CXCR3+TIGIT+ as a percentage of CD4+ T cells. (B) Frequencies of CD3+CD4+CD25+/-FoxP3-(Teff)CD45RO+CD45RA-GB-CD69+ or CD3+CD4+CD25+/-FoxP3- (Teff)CD45RO+CD45RA-GB-CD69+Tbet+CXCR3+. (C) CD8+CD45RO+CD45RA-GB-CD69+ or CD8+CD45RO+CD45RA-GB-CD69+Tbet+CXCR3+, as a percentage of CD4+ or CD8+ parent T cell lineages. Data represent the mean ± SD, Mann–Whitney U (two-tailed) test, *p < 0.05, ***p < 0.001, ****p < 0.0001. NonStim, peptide solvent control; Peptide Stim, stimulation with peptide pool.

References

    1. Zhang YZ, Holmes EC. A Genomic Perspective on the Origin and Emergence of SARS-Cov-2. Cell (2020) 181(2):223–7. 10.1016/j.cell.2020.03.035 - DOI - PMC - PubMed
    1. Chakraborty I, Maity P. Covid-19 Outbreak: Migration, Effects on Society, Global Environment and Prevention. Sci Total Environ (2020) 728:138882. 10.1016/j.scitotenv.2020.138882 - DOI - PMC - PubMed
    1. Guan WJ, Ni ZY, Hu Y, Liang WH, Ou CQ, He JX, et al. . Clinical Characteristics of Coronavirus Disease 2019 in China. N Engl J Med (2020) 382(18):1708–20. 10.1056/NEJMoa2002032 - DOI - PMC - PubMed
    1. Wölfel R, Corman VM, Guggemos W, Seilmaier M, Zange S, Müller MA, et al. . Virological Assessment of Hospitalized Patients With Covid-2019. Nature (2020) 581(7809):465–9. 10.1038/s41586-020-2196-x - DOI - PubMed
    1. Wu Z, McGoogan JM. Characteristics of and Important Lessons From the Coronavirus Disease 2019 (Covid-19) Outbreak in China: Summary of a Report of 72 314 Cases From the Chinese Center for Disease Control and Prevention. JAMA (2020) 323(13):1239–42. 10.1001/jama.2020.2648 - DOI - PubMed

Publication types

Substances