

Biotin-streptavidin-guided two-step pretargeting approach using PLGA for molecular ultrasound imaging and chemotherapy for ovarian cancer
- PMID: 34113492
- PMCID: PMC8162236
- DOI: 10.7717/peerj.11486
Biotin-streptavidin-guided two-step pretargeting approach using PLGA for molecular ultrasound imaging and chemotherapy for ovarian cancer
Abstract
Background: Ovarian cancer seriously threatens the lives and health of women, and early diagnosis and treatment are still challenging. Pre-targeting is a promising strategy to improve the treatment efficacy of ovarian cancer and the results of ultrasound imaging.
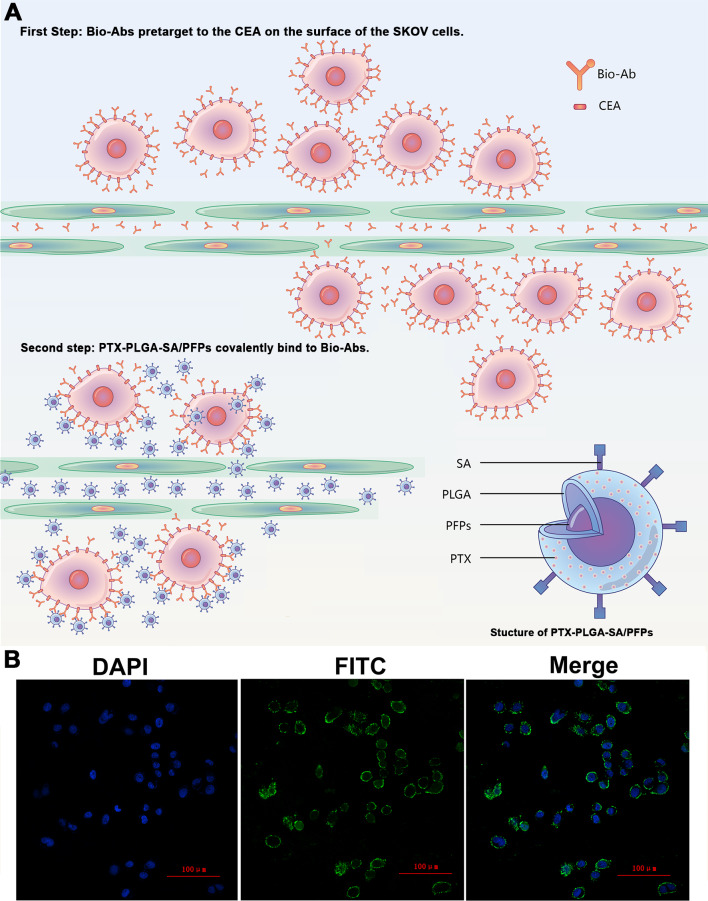
Purpose: To explore the effects of a pre-targeting strategy using streptavidin (SA) and paclitaxel (PTX)-loaded phase-shifting poly lactic-co-glycolic acid (PLGA) nanoparticles with perfluoro-n-pentane (PTX-PLGA-SA/PFPs) on the treatment and ultrasound imaging of ovarian cancer.
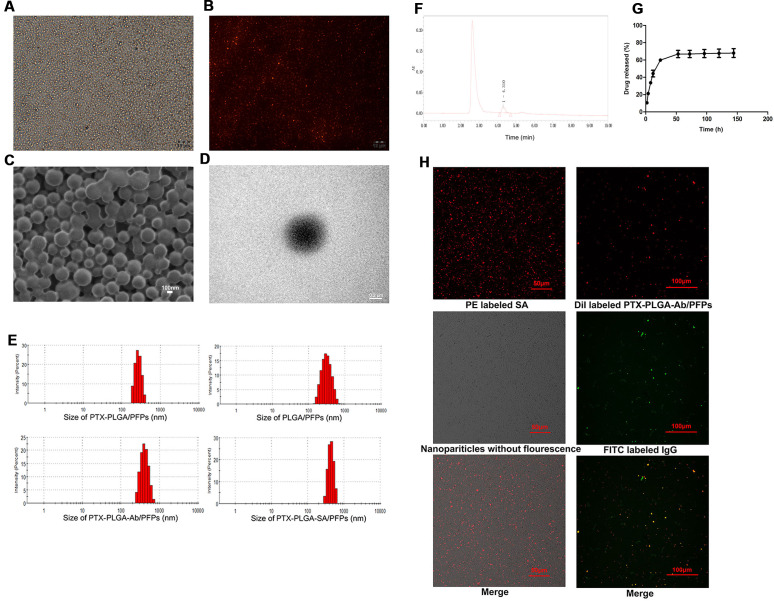
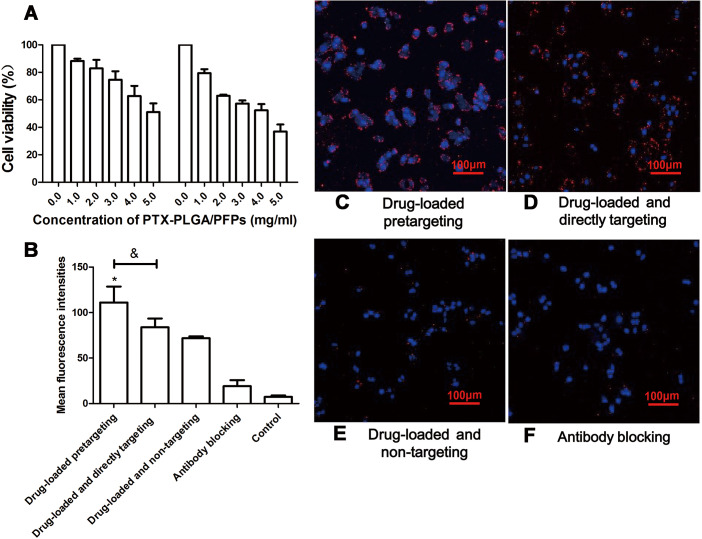
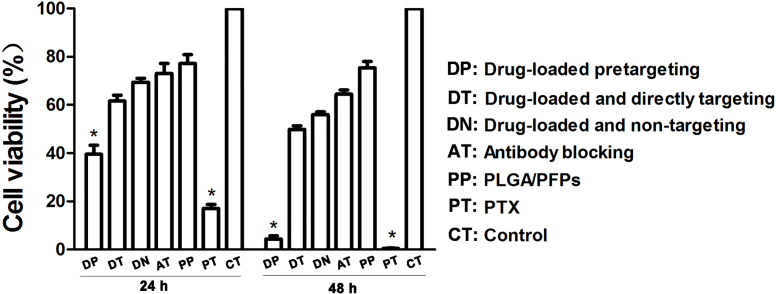
Methods: PTX-PLGA/PFPs were prepared with a single emulsion (O/W) solvent evaporation method and SA was attached using carbodiimide. The encapsulation efficiency of PTX and the release characteristics were assessed with high performance liquid chromatography. The phase-change characteristics of the PTX-PLGA-SA/PFPs were investigated. The anti-carcinoembryonic antigen (CEA) antibody (Ab) was covalently attached to PTX-PLGA/PFPs via carbodiimide to create PTX-PLGA-Ab/PFPs. The targeting efficiency of the nanoparticles and the viability of ovarian cancer SKOV3 cells were evaluated in each group using a microscope, flow cytometry, and cell counting kit 8 assays.
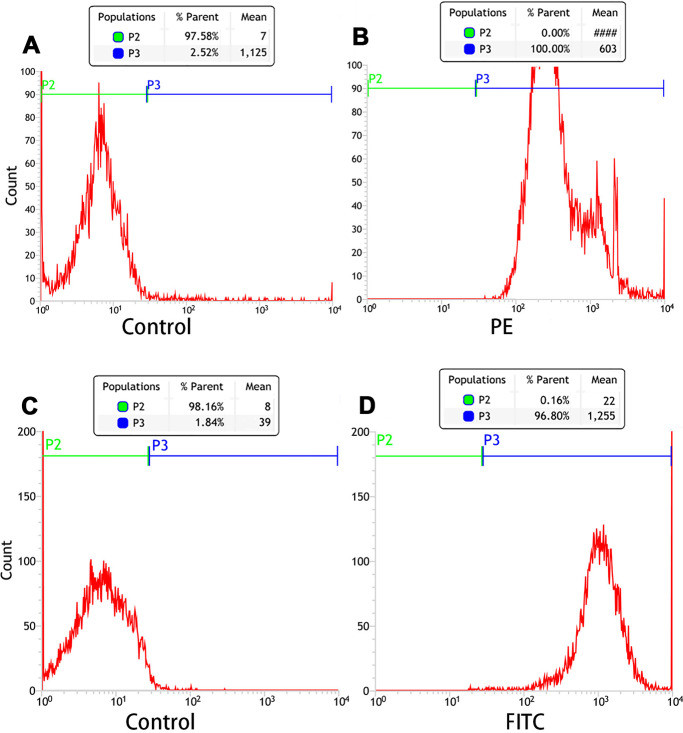
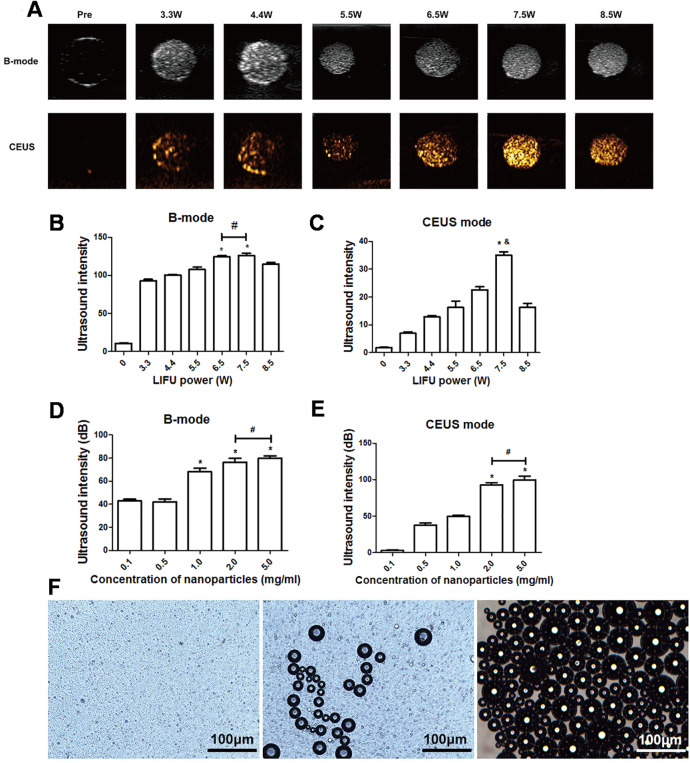
Results: THE PTX-PLGA-SA/PFPs were spheres with a size of 383.0 ± 75.59 nm. The encapsulation efficiency and loading capability of the nanoparticles for PTX were 71.56 ± 6.51% and 6.57 ± 0.61%, respectively. PTX was burst-released up to 70% in 2-3 d. When irradiated at 7.5 W for 3 min, the PTX-PLGA-SA/PFPs visibly enhanced the ultrasonography images (P < 0.05). At temperatures of 45°C and 60°C the nanoparticles phase-shifted into micro-bubbles and the sizes increased. The binding efficiencies of SA and Ab to the PTX-PLGA/PFPs were 97.16 ± 1.20% and 92.74 ± 5.75%, respectively. Pre-targeting resulted in a high binding efficacy and killing effect on SKOV3 cells (P < 0.05).
Conclusions: The two-step pre-targeting process can significantly enhance the targeting ability of PTX-loaded PLGA nanoparticles for ovarian cancer cells and substantially improve the therapeutic efficacy. This technique provides a new method for ultrasonic imaging and precise chemotherapy for ovarian cancer.
Keywords: Liquid-gas Phase-shift; Molecular imaging; PLGA; Paclitaxel; Pre-targeting technology.
©2021 Zhou et al.
Conflict of interest statement
The authors declare there are no competing interests.
Figures
Similar articles
-
[Preliminary study of mesothelin-loaded paclitaxel nanoparticles for ultrasound molecular imaging and treatment of ovarian cancer].Zhonghua Zhong Liu Za Zhi. 2025 May 23;47(5):395-403. doi: 10.3760/cma.j.cn112152-20240701-00270. Zhonghua Zhong Liu Za Zhi. 2025. PMID: 40375590 Chinese.
-
Synthesis, characterization, and evaluation of paclitaxel loaded in six-arm star-shaped poly(lactic-co-glycolic acid).Int J Nanomedicine. 2013;8:4315-26. doi: 10.2147/IJN.S51629. Epub 2013 Nov 7. Int J Nanomedicine. 2013. PMID: 24235829 Free PMC article.
-
Paclitaxel-loaded and A10-3.2 aptamer-targeted poly(lactide-co-glycolic acid) nanobubbles for ultrasound imaging and therapy of prostate cancer.Int J Nanomedicine. 2017 Jul 26;12:5313-5330. doi: 10.2147/IJN.S136032. eCollection 2017. Int J Nanomedicine. 2017. PMID: 28794625 Free PMC article.
-
Enhanced in vitro antiproliferative effects of EpCAM antibody-functionalized paclitaxel-loaded PLGA nanoparticles in retinoblastoma cells.Mol Vis. 2011;17:2724-37. Epub 2011 Oct 19. Mol Vis. 2011. Retraction in: Mol Vis. 2013 Jun 06;19:1258. PMID: 22065926 Free PMC article. Retracted.
-
Recent advances in PLGA polymer nanocarriers for ovarian cancer therapy.Front Oncol. 2025 Mar 24;15:1526718. doi: 10.3389/fonc.2025.1526718. eCollection 2025. Front Oncol. 2025. PMID: 40196734 Free PMC article. Review.
Cited by
-
The targeting imaging and treatment capacity of gelsolin-targeted and paclitaxel-loaded PLGA nanoparticles in vitro and in vivo.Front Bioeng Biotechnol. 2022 Oct 20;10:933856. doi: 10.3389/fbioe.2022.933856. eCollection 2022. Front Bioeng Biotechnol. 2022. PMID: 36338135 Free PMC article.
-
Evaluation of the potential of ultrasound-mediated drug delivery for the treatment of ovarian cancer through preclinical studies.Front Oncol. 2022 Sep 5;12:978603. doi: 10.3389/fonc.2022.978603. eCollection 2022. Front Oncol. 2022. PMID: 36132133 Free PMC article. Review.
-
Pretargeted Alpha Therapy of Disseminated Cancer Combining Click Chemistry and Astatine-211.Pharmaceuticals (Basel). 2023 Apr 15;16(4):595. doi: 10.3390/ph16040595. Pharmaceuticals (Basel). 2023. PMID: 37111352 Free PMC article.
-
Ultrasound and Nanomedicine for Cancer-Targeted Drug Delivery: Screening, Cellular Mechanisms and Therapeutic Opportunities.Pharmaceutics. 2022 Jun 16;14(6):1282. doi: 10.3390/pharmaceutics14061282. Pharmaceutics. 2022. PMID: 35745854 Free PMC article. Review.
-
Mesothelin-Mediated Paclitaxel Phase-Shifted Nanodelivery System for Molecular Ultrasound Imaging and Targeted Therapy Potential in Ovarian Cancer.Curr Drug Deliv. 2025;22(6):810-820. doi: 10.2174/0115672018300502240530064139. Curr Drug Deliv. 2025. PMID: 38847257
References
LinkOut - more resources
Full Text Sources
