. 2019 Apr:5:e00051.
doi: 10.1016/j.ohx.2018.e00051. Epub 2018 Dec 31.

A simplified LED-driven switch for fast-scan controlled-adsorption voltammetry instrumentation

Affiliations

A simplified LED-driven switch for fast-scan controlled-adsorption voltammetry instrumentation

Rhiannon Robke et al. HardwareX. 2019 Apr.

Abstract

Fast-scan cyclic voltammetry (FSCV) is an analytical tool used to probe neurochemical processes in real-time. A major drawback for specialized applications of FSCV is that instrumentation must be constructed or modified in-house by those with expertise in electronics. One such specialized application is the newly developed fast-scan controlled-adsorption voltammetry (FSCAV) that measures basal (tonic) in vivo dopamine and serotonin concentrations. FSCAV requires additional software and equipment (an operational amplifier coupled to a transistor-transistor logic) allowing the system to switch between applying a FSCV waveform and a constant potential to the working electrode. Herein we describe a novel, simplified switching component to facilitate the integration of FSCAV into existing FSCV instruments, thereby making this method more accessible to the community. Specifically, we employ two light emitting diodes (LEDs) to generate the voltage needed to drive a NPN bipolar junction transistor, substantially streamlining the circuitry and fabrication of the switching component. We performed in vitro and in vivo analyses to compare the new LED circuit vs. the original switch. Our data shows that the novel simplified switching component performs equally well when compared to traditional instrumentation. Thus, we present a new, simplified scheme to perform FSCAV that is cheap, simple, and easy to construct by individuals without a background in engineering and electronics.

Keywords: Basal; Circuit; Component; Dopamine; Fast-scan cyclic voltammetry; Instrumentation.


Conflict of interest statement

Conflict of interest The authors declare no conflict of interest.

Figures

Fig. 1.
Fig. 1.
Novel LED circuitry scheme. R1,2 = Resistors; L1,2 = LEDs. R1 = 10 kOhm, R2 = 40 kOhm, L1 and L2 = 890 nm, 4 V forward voltage. Transistor is NPN BJT.
Fig. 2.
Fig. 2.
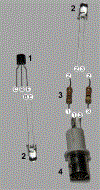
Concise connection diagram. Same letters or numbers indicates soldering between those two connections. Bolded, black numbers correspond to the following: 1 = Transistor, 2 = LED, 3 = Resistor, 4 = BNC connector.
Fig. 3.
Fig. 3.
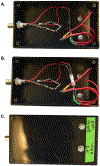
Photographic representation of the LED circuit. (A) LEDs masked in electrical tape. (B) Reveal of LEDs (white component -shrink wrap). (C) Closed project box displaying the working electrode output (top screw) and the –0.4V input (bottom screw). **Notice 4 10 kOhm resistors (to create 40 kOhm) were used here (connected to TTL output; shown in both A and B).
Fig. 4.
Fig. 4.
Measurement and Automation Explorer: Devices and Interfaces.
Fig. 5.
Fig. 5.
NI card selection.
Fig. 6.
Fig. 6.
Test Panel selection.
Fig. 7.
Fig. 7.
Analog Output: change channel name to ao1.
Fig. 8.
Fig. 8.
Set output value to −0.4V.
Fig. 9.
Fig. 9.
In vitro calibration comparison of the LED circuit and original switch. (A) Representative color plots of LED circuit and switch files in vitro. (B) Extracted cyclic voltammograms from lateral color plots at dashed, starred line. Respective integration limits for the quantification of dopamine are shown as dashed, black lines for both the LED circuit (orange) and switch (blue). (C) Calibration curve and electrode response of the LED circuit and switch, showing no significant differences in their measurements (two way repeated measures ANOVA: n = 6 electrodes ± SEM).
Fig. 10.
Fig. 10.
In vivo comparison of novel LED circuit and original switch. (A) Scheme of in vivo experiment set-up in the mouse brain. WE = working electrode, STIM = stimulating electrode, NAcc = nucleus accumbens core, MFB = medial forebrain bundle, VTA = ventral tegmental area. (B) FSCV in vivo recording verifying dopamine release in the NAcc after electrical stimulation of the MFB. (C) LED circuit color plot and extracted cyclic voltammogram from the white, dashed, starred line (3rd scan after waveform is reapplied). Integration limits are shown with cross hairs of the two limits aligned under the peak (black, dashed lines). (D) Switch color plot and extracted cyclic voltammogram from the white, dashed, starred line (2nd scan after waveform is reapplied). Integration limits are shown in black, dashed lines.

References

    1. Robinson DL, Venton BJ, Heien ML, Wightman RM, Detecting subsecond dopamine release with fast-scan cyclic voltammetry in vivo, Clin. Chem 49 (10) (2003) 1763–1773. - PubMed
    1. John CE, Jones SR, Voltammetric characterization of the effect of monoamine uptake inhibitors and releasers on dopamine and serotonin uptake in mouse caudate-putamen and substantia nigra slices, Neuropharmacology 52 (8) (2007) 1596–1605. - PMC - PubMed
    1. Roberts JG, Sombers LA, Fast-scan cyclic voltammetry: chemical sensing in the brain and beyond, Anal. Chem 90 (1) (2017) 490–504. - PMC - PubMed
    1. Phillips PEM, Wightman RM, Critical guidelines for validation of the selectivity of in-vivo chemical microsensors, Trends Anal. Chem 22 (9) (2003) 509–514.
    1. Adams RN, Probing brain chemistry with electroanalytical techniques, Anal. Chem 48 (14) (1976) 1126A–1138A. - PubMed

LinkOut - more resources