. 2021 Apr 6;5(1):263-274.
doi: 10.3233/ADR-210298.

Nasal Extracts from Patients with Alzheimer's Disease Induce Tau Aggregates in a Cellular Model of Tau Propagation

Affiliations

Nasal Extracts from Patients with Alzheimer's Disease Induce Tau Aggregates in a Cellular Model of Tau Propagation

Aslina Pahrudin Arrozi et al. J Alzheimers Dis Rep. .

Abstract

Background: Emerging evidence indicates that the misfolded tau protein can propagate aggregates between cells in a prion-like manner. This prion activity has been typically studied in brain extracts of patients with Alzheimer's disease (AD), but not in the olfactory region that can be a potential biomarker in AD.

Objective: To investigate the prion seeding activity of tau in nasal mucosa tissues using a cell culture model of tau propagation.

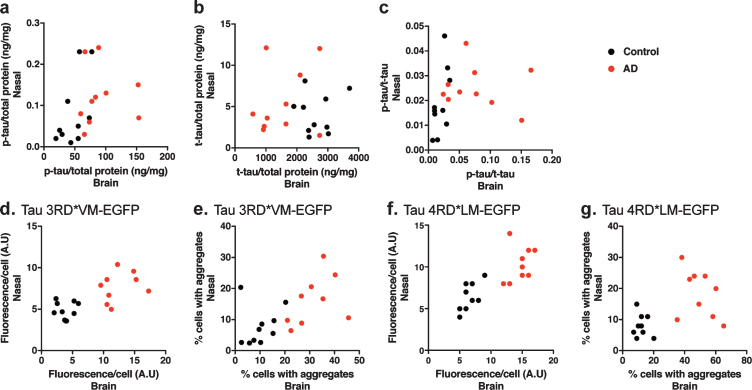
Methods: Brain and nasal mucosa homogenates were added to HEK293T cells expressing three repeat or four-repeat domains of tau with the L266V, V337M (3RD*VM) and P301L and V377M mutations (4RD*LM) fused to the enhanced green fluorescence protein (EGFP) respectively. We also measured the level of phosphorylated tau (p-tau), total tau (t-tau), and p-tau/t-tau ratio and performed correlation analysis between tau prion activity and the level of tau.

Results: We found that brain and nasal tissue homogenates from patients with AD significantly induced tau aggregation in HEK293T cells either expressing tau 3RD*VM-EGFP or 4RD*LM-EGFP compared with control brain and nasal tissue homogenates. The levels of p-tau and p-tau/t-tau ratio were significantly increased in the brain of patients with AD; however, no significant difference was found in nasal tissue compared with their respective control tissue homogenates.

Conclusion: These results suggest that the nasal tissues contain tau seeds, similar to the brain, albeit without changes in the levels of p-tau and t-tau. Therefore, a cellular bioassay using nasal tissues would have great potential as an AD biomarker because of the usefulness of nasal tissue biopsy.

Keywords: Alzheimer’s disease; nasal extracts; tau aggregation; tau propagation.


Conflict of interest statement

This research was supported by Daiichi Sankyo Co. Ltd.

Figures

Fig. 1
Fig. 1
Development of a cellular model of tau propagation. Validation of (a) 3RD*VM-EGFP and (b) 4RD*LM-EGFP expression. Stable cells transfected with vector plasmid (V) and three stable selected clones (clone 2 (C2), clone 3 (C3), and clone 5 (C5) in 3RD*VM-EGFP and C1, C2, and C3 in 4RD*LM-EGFP) were probed with anti-tau three- or four-repeat isoforms (3RD or 4RD), anti-GFP, and anti-β-actin antibodies on separate membranes. A protein ladder (M) was used as a size reference. Representative images of HEK 293T cells expressing (c) 3RD*VM-EGFP and (d) 4RD*LM-EGFP. Scale bar = 20μm.
Fig. 2
Fig. 2
Development of tau seed assay in cellular model of tau propagation. Representative images of HEK 293T cells expressing (a) 3RD*VM-EGFP and (c) 4RD*LM-EGFP incubated with L2000 or seeded with crude brain homogenates from control, AD, and PiD subjects for 4 days. Scale bar = 50μm. Quantification of tau aggregation (fluorescence/cell) in HEK293T cells expressing (b) 3RD*VM-EGFP and (d) 4RD*LM-EGFP. Data are presented as the mean±SEM measured from five replicates for each group (one sample per group). *p < 0.05, **p < 0.001.
Fig. 3
Fig. 3
HEK 293T cells stably expressing tau 3RD*VM-EGFP detect tau prions in the brain and nasal tissue homogenates from patients with AD. Brain and nasal tissue homogenates from control and AD patient samples were diluted in DPBS and incubated for 4 days with 3RD*VM-EGFP-expressing cells. a) Representative images of HEK 293T cells expressing 3RD*VM-EGFP seeded with the brain and nasal tissue homogenates from control individuals and patients with AD. Scale bar = 50μm. Quantification of tau aggregation by (b) fluorescence per cell. Data are presented as the mean±SEM measured from 10 samples per group, with the exception of AD nasal homogenates, for which nine samples were used, and (c) percentage of cells with aggregates. Data are presented as the mean±SEM measured from five images for each sample. *p < 0.05, **p < 0.001, ****p < 0.0001.
Fig. 4
Fig. 4
HEK 293T cells stably expressing tau 4RD*LM-EGFP detect tau prions in the brain and nasal tissue homogenates from patients with AD. The same methods were applied as those described for HEK293T cells stably expressing tau 3RD*VM-EGFP. a) Representative images of HEK 293T cells expressing 4RD*LM-EGFP seeded with the brain and nasal tissue homogenates from control individuals and patients with AD. Scale bar = 50μm. Quantification of tau aggregation by (b) fluorescence per cell. Data are presented as the mean±SEM measured from ten samples per group, with the exception of AD nasal homogenates, for which nine samples were used, and (c) percentage of cells with aggregates. Data are presented as the mean±SEM measured from five images for each sample. **p < 0.001, ****p < 0.0001.
Fig. 5
Fig. 5
Determination of the levels of (a, d) p-tau and (b, e) t-tau and (c, f) the p-tau/t-tau ratio by ELISA in (a–c) the brain homogenates and (d–f) the nasal homogenates. Data are presented as the mean±SEM measured from triplicate experiments for each sample, with 10 samples per group. **p < 0.01, ***p < 0.001.
Fig. 6
Fig. 6
Correlation analysis to determine the dependency of the measured parameters in the brain and nasal samples. a) Correlation analysis of the level of p-tau. b) Correlation analysis of the level of t-tau. c) Correlation analysis of the p-tau/t-tau ratio. d, e) Correlation analysis of the prion seeding activity measured as fluorescence per cell or percentage of cells with aggregates in HEK 293T cells stably expressing tau 3RD*VM-EGFP. f, g) Correlation analysis of the prion seeding activity measured as fluorescence per cell or percentage of cells with aggregates in HEK 293T cells stably expressing tau 4RD*LM-EGFP. There were no correlations in the changes of tau levels and prion seeding activity between the brain and nasal tissue homogenates.
Fig. 7
Fig. 7
Correlation analysis in HEK 293T cells stably expressing tau (a–d) 3RD*VM-EGFP and (e–h) 4RD*LM-EGFP for the determination of the dependency of the prion seeding activity measured as fluorescence per cell or percentage of cells with aggregates and the level of p-tau/t-tau ratio in the (a, b, e, f) brain samples and (c, d, g, h) nasal samples. The prion seeding activity measured as fluorescence per cell was significantly correlated with the p-tau/t-tau ratio only in the brain samples.

References

    1. Collinge J, Sidle KCL, Meads J, Ironside J, Hill AF (1996) Molecular analysis of prion strain variation and the aetiology of “new variant” CJD. Nature 383, 685–690. - PubMed
    1. Borchelt DR, Scott M, Taraboulos A, Stahl N, Prusiner SB (1990) Scrapie and cellular prion proteins differ in their kinetics of synthesis and topology in cultured cells. J Cell Biol 110, 743–752. - PMC - PubMed
    1. Caughey B, Raymond GJ (1991) The scrapie-associated form of PrP is made from a cell surface precursor that is both protease- and phospholipase-sensitive. J Biol Chem 266, 18217–18223. - PubMed
    1. Reiniger L, Lukic A, Linehan J, Rudge P, Collinge J, Mead S, Brandner S (2011) Tau, prions and Aβ: The triad of neurodegeneration. Acta Neuropathol 121, 5–20. - PMC - PubMed
    1. Castilla J, Saá P, Hetz C, Soto C (2005) In vitro generation of infectious scrapie prions. Cell 121, 195–206. - PubMed

LinkOut - more resources