. 2021 Apr 20;24(5):102454.
doi: 10.1016/j.isci.2021.102454. eCollection 2021 May 21.

Mechanisms of typhoid toxin neutralization by antibodies targeting glycan receptor binding and nuclease subunits

Affiliations

Mechanisms of typhoid toxin neutralization by antibodies targeting glycan receptor binding and nuclease subunits

Changhwan Ahn et al. iScience. .

Abstract

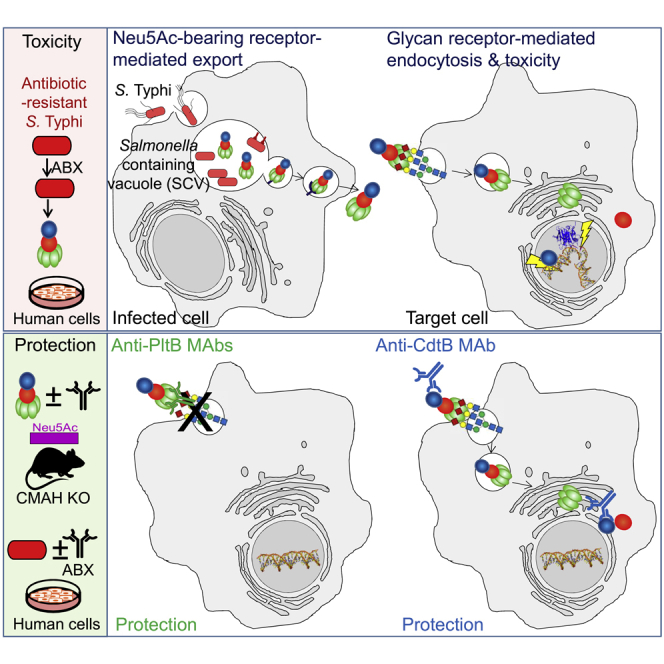
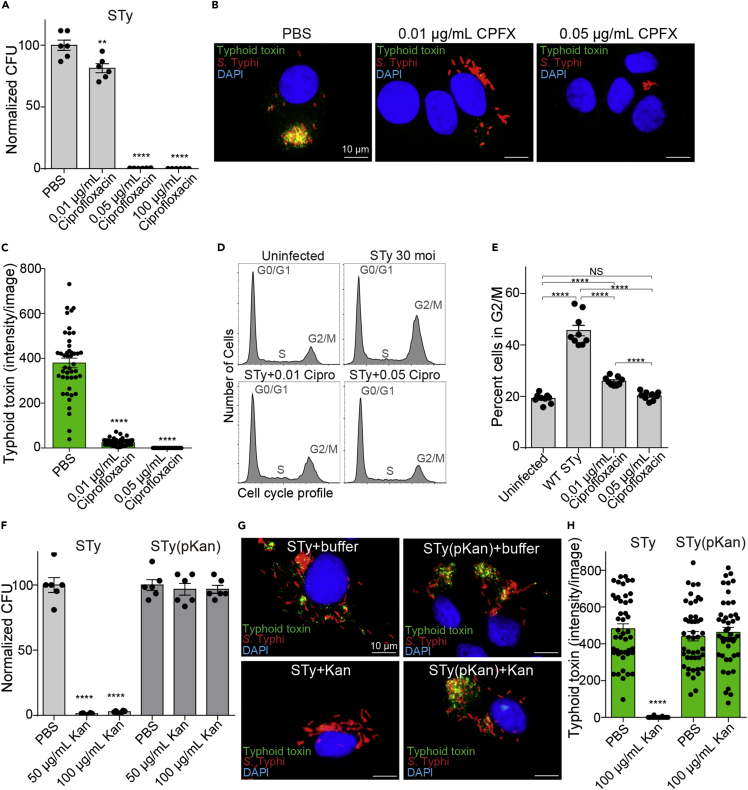
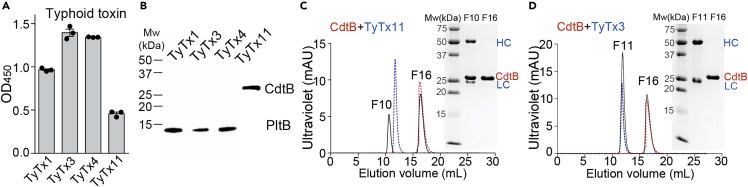
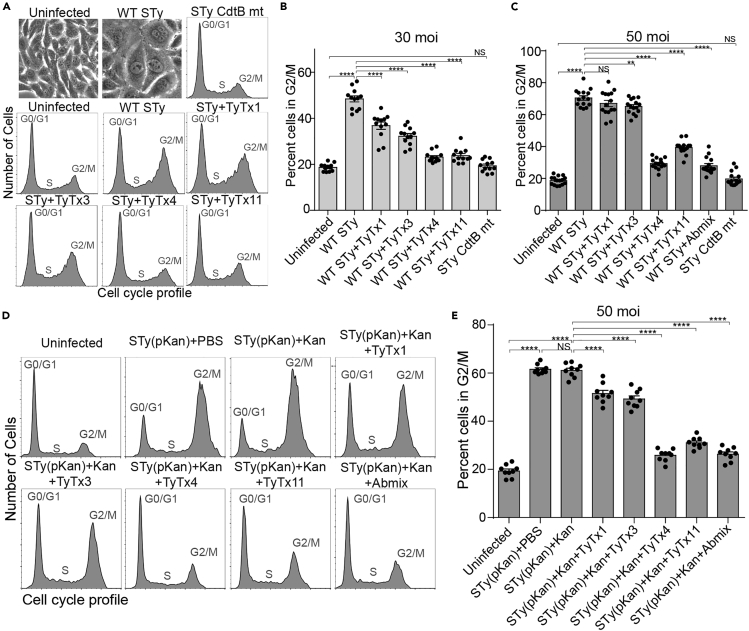
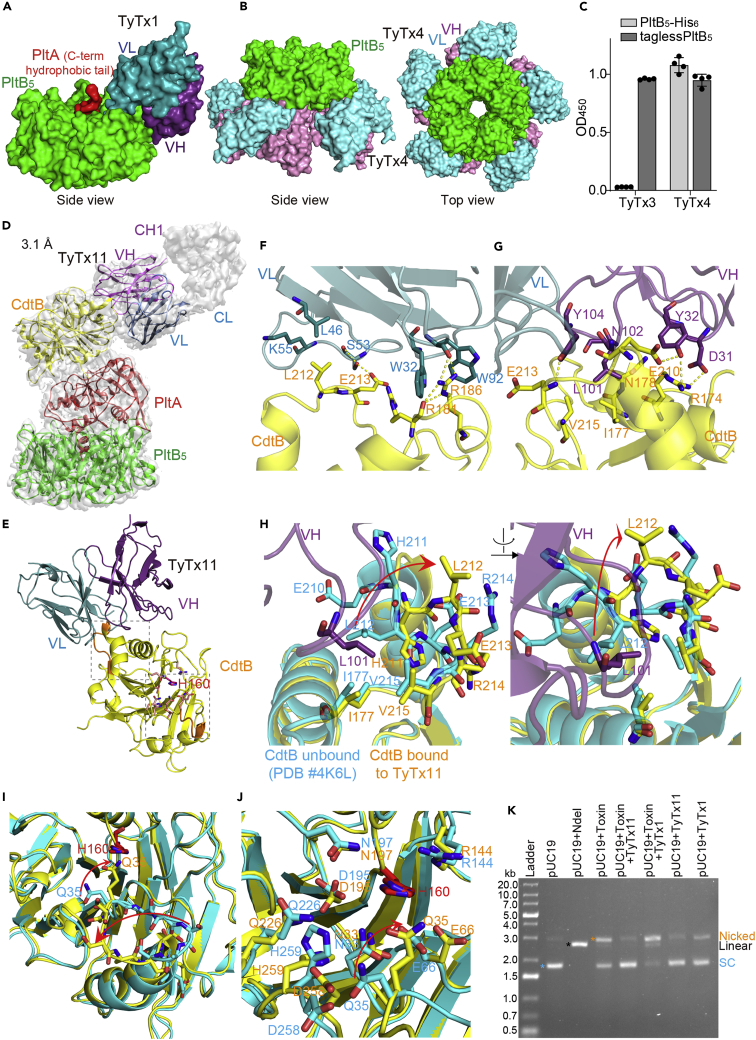
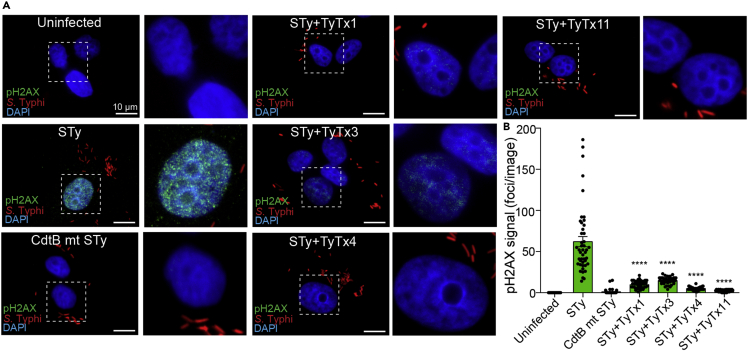
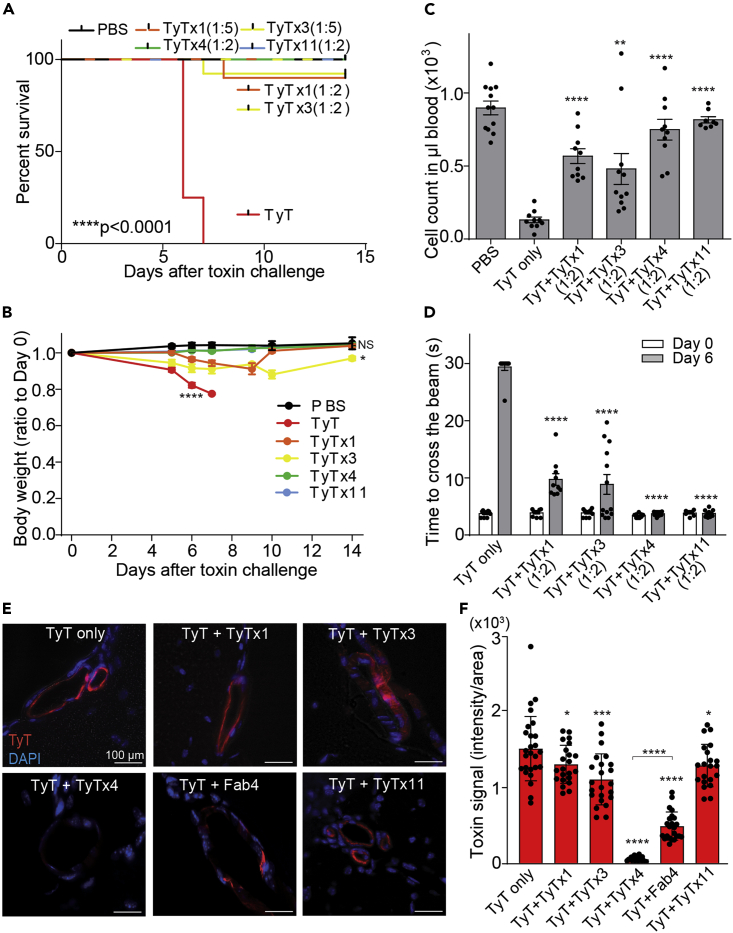
Nearly all clinical isolates of Salmonella Typhi, the cause of typhoid fever, are antibiotic resistant. All S. Typhi isolates secrete an A2B5 exotoxin called typhoid toxin to benefit the pathogen during infection. Here, we demonstrate that antibiotic-resistant S. Typhi secretes typhoid toxin continuously during infection regardless of antibiotic treatment. We characterize typhoid toxin antibodies targeting glycan-receptor-binding PltB or nuclease CdtB, which neutralize typhoid toxin in vitro and in vivo, as demonstrated by using typhoid toxin secreted by antibiotic-resistant S. Typhi during human cell infection and lethal dose typhoid toxin challenge to mice. TyTx11 generated in this study neutralizes typhoid toxin effectively, comparable to TyTx4 that binds to all PltB subunits available per holotoxin. Cryoelectron microscopy explains that the binding of TyTx11 to CdtB makes this subunit inactive through CdtB catalytic-site conformational change. The identified toxin-neutralizing epitopes are conserved across all S. Typhi clinical isolates, offering critical insights into typhoid toxin-neutralizing strategies.


Conflict of interest statement

The authors declare no competing interests.

Figures

None
Graphical abstract
Figure 1
Figure 1
Antibiotic-resistant S. Typhi secretes typhoid toxin continuously during human cell infection regardless of antibiotic treatment (A–C) Evaluation of the ciprofloxacin effects on intracellular S. Typhi colony-forming unit (CFU) (A) and typhoid toxin secretion (B and C). Henle-407 cells were infected with 30 MOI. S. Typhi for 24 h in the presence and absence of indicated ciprofloxacin concentrations. Bars represent average ±standard error of the mean (SEM). ∗∗p < 0.01, ∗∗∗∗p < 0.0001, relative to PBS. n = 6 per group. Two-tailed unpaired t tests. (B) Representative fluorescent microscope images showing typhoid toxin (green), S. Typhi (red), and host cell DNA (blue). Scale bar, 10 μm. (C) All microscopy results reflecting the typhoid toxin signal intensity obtained from three independent experiments. Bars represent average ±SEM. ∗∗∗∗p < 0.0001, relative to the PBS group. n = 45 per group. Two-tailed unpaired t tests. (D and E) Representative flow cytometry histograms reflecting cell cycle profiles of Henle-407 cells left uninfected or infected with 30 MOI S. Typhi for 72 h in the presence and absence of indicated ciprofloxacin concentrations (D) and corresponding percent of cells in the G2/M cell cycle obtained from three independent experiments (E). Bars represent average ±SEM. ∗∗∗∗p < 0.0001, NS, not significant. n = 9 per group. Two-tailed unpaired t tests. (F) Evaluation of the kanamycin effects on intracellular S. Typhi CFU. Henle-407 cells were infected with 30 MOI S. Typhi for 24 h in the presence and absence of indicated kanamycin concentrations. Bars represent average ±SEM. ∗∗p < 0.01,∗∗∗∗p < 0.0001, relative to PBS. n = 6 per group. Two-tailed unpaired t tests. (G) Representative fluorescent microscope images showing typhoid toxin (green), S. Typhi (red), and host cell DNA (blue). STy, antibiotic-susceptible S. Typhi; STy(pKan), S. Typhi carrying the pKan plasmid. Kan, 100 μg/mL kanamycin treatment. Scale bar, 10 μm. (H) Typhoid toxin signal intensity per image obtained from three independent experiments. Bars represent average ±SEM. ∗∗∗∗p < 0.0001, relative to the PBS group. n = 45 per group. Two-tailed unpaired t tests.
Figure 2
Figure 2
Generation and characterization of antibodies targeting the receptor-binding PltB and the nuclease CdtB subunits of typhoid toxin (A) ELISAs were performed to determine their specificities to typhoid toxin. Bars represent the mean values of three independent experiments ±SEM, which were obtained by measuring the absorbance at 450 nm. (B) Typhoid toxin (200 ng) was separated using 15% SDS-PAGE, followed by western blot analysis for each MAb to determine their toxin subunit specificities. Representative blot results from three independent experiments are shown. (C and D) Overlays of Superdex 200 chromatograms of CdtB only (red), MAb only (blue, TyTx3 or TyTx11), and CdtB + MAb together (black). Fractions 10 and 16 for the TyTx11 mixture and fractions 11 and 16 for the TyTx3 mixture were analyzed using 15% SDS-PAGE (insets in C and D, respectively). SEC standards were run on the same Superdex 200 Increase column (Figure S2). See also Figures S1–S4 and Table S1.
Figure 3
Figure 3
All antibodies neutralize typhoid toxin produced by antibiotic-susceptible and -resistant S. Typhi during infection yet with different neutralizing capabilities (A–C) Note that data for TyTx1, 3, and 4 (anti-PltB antibodies) in figure panels (A−C) are adapted from Nguyen et al. (2021) to compare their toxin neutralizing outcomes to TyTx11-mediated toxin neutralization outcomes (anti-CdtB antibody). Measurements of nAb-mediated toxin neutralization against typhoid toxin continuously produced by S. Typhi during human cell infection. Henle-407 cells were left uninfected or infected with S. Typhi (STy) at an MOI 30 (A and B) or 50 (C) for 3 days in the presence and absence of indicated monoclonal antibodies (MAbs) (10 nM). Abmix was prepared by mixing 2.5 nM each of four MAbs. STy CdtB mt, an isogenic S. Typhi carrying CdtB catalytic-mutant CdtBH160Q, was used to demonstrate the specificity of typhoid toxin-induced intoxication. Representative bright-field images of uninfected and WT S. Typhi-infected Henle-407 cells reflecting typhoid toxin-mediated intoxication phenotypes are shown in the first two panels in (A). Representative flow cytometry histograms reflecting cell cycle profiles are shown in the remaining panels in (A), and percent cells in the G2/M cell cycle summarizing all results are shown in (B and C). Bars represent average ±SEM. ∗∗p < 0.01, ∗∗∗∗p < 0.0001, NS, not significant. n = 12–15 per group. Two-tailed unpaired t tests. At least three independent experiments were performed. (D) Representative flow cytometry histograms reflecting cell cycle profiles of Henle-407 cells left uninfected or infected with 50 MOI. STy(pKan) for 3 days ±50 μg/mL Kan ± indicated MAbs (10 nM). Abmix was prepared by mixing 2.5 nM each of four MAbs. (E) Percent of cells in the G2/M cell cycle obtained from three independent experiments using antibiotic-resistant S. Typhi. Bars represent average ±SEM. ∗∗∗∗p < 0.0001, NS, not significant. n = 9 per group. Two-tailed unpaired t tests.
Figure 4
Figure 4
TyTx4 binds to all PltB subunits available per holotoxin, whereas TyTx11 makes CdtB inactive through CdtB catalytic-site conformational change (A) Note that figure (A and B) are adapted from Nguyen et al. (2021) to compare neutralizing epitopes recognized by anti-PltB antibodies to the epitope recognized by TyTx11. Close-up view of the TyTx1 Fab-typhoid toxin complex structure solved via cryo-EM (EMDB-22699, PDB:7K7H). TyTx1 variable region light chain (VL) and heavy chain (VH), dark cyan and dark purple, respectively; PltB pentamer, green; PltA C-term hydrophobic tail, red. PltA and CdtB subunits are not shown. (B) Side and top views of the TyTx4 Fab-typhoid toxin complex structure solved via cryo-EM (EMDB-22700, PDB:7K7I). TyTx4 variable region light chain (VL) and heavy chain (VH), cyan and purple, respectively; PltB pentamer, green. PltA and CdtB subunits are not shown. (C) TyTx3 epitope mapping by modified ELISA. TyTx3 bound to tagless PltB but not to PltB-His6 at the C-terminal end that is located on the lateral side of PltB pentamer in 3-dimensional structure (PDB:4K6L). Binding sites on PltB that are predicted to be recognized by TyTx3 are shown in Figure S5. (D) Sharpened cryo-EM density map (gray) of typhoid toxin complexed with TyTx11 MAb with ribbon diagram of the refined structure of typhoid toxin (CdtB, yellow; PltA, red; PltB pentamer, green) bound to variable regions of the light chain (VL, blue) and the heavy chain (VH, purple). (E) Ribbon diagram of the interface between CdtB subunit (yellow) and TyTx11 VL and VH. The flexible loop recognized by TyTx11 and the CdtB catalytic residue H160 are highlighted in orange and red, respectively. Two locations on CdtB where the conformational changes occurred are highlighted in dotted boxes. The box near the interface is highlighted in Figure 4H, and the box on the bottom is zoomed in in Figures 4I and 4J). (F and G) Close-up views of the interactions between CdtB subunit (yellow) and TyTx11 VL (blue) and VH (purple) (F and G, respectively). Arg174, Arg174, Ile177, Asn178∗, Arg181, Arg186, Arg186, Glu210, Leu212, Leu212, Glu213, Glu213, and Val215 in the CdtB subunit interact with Asp31 (VH, H-bond), Tyr32 (VH, H-bond), Leu101 (VH, hydrophobic), Asn102 (VH, H-bond), Trp32 (VL, π stacks), Trp32 (VL, π stacks), Trp92 (VL, H-bond and π stacks), Tyr32 (VH, H-bond), Leu46 (VL, hydrophobic), Lys55 (VL, hydrophobic), Tyr104 (VH, H-bond), Ser53 (VL, H-bond), and Leu101 (VH, hydrophobic), respectively. Asterisk indicates H-bond via their main chains. (H) Structure alignment of CdtB bound to TyTx11 (CdtB, yellow; TyTx11 VH, purple) and CdtB unbound (PDB:4K6L, cyan). (I and J) Two different close-up views of the region near CdtB H160. (I) Close-up view of residues in the catalytic site. (J) Further close-up view of residues near CdtB H160. (K) DNA agarose gel image assessing antibody-mediated protection of typhoid toxin (toxin)-induced cleavage of pUC19 plasmid. SC, supercoiled. See also Figures S5–S7 and Table S2.
Figure 5
Figure 5
The CdtB catalytic-site conformational change induced by TyTx11 makes CdtB an inactive form (A) Henle-407 cells were left uninfected or infected with 30 MOI S. Typhi(pKan) for 24 h. Host cells were incubated with 30 MOI bacteria for 1 h, followed by 100 μg/mL gentamicin treatment for 30 min to eliminate extracellular bacteria, washing, and incubation in complete culture media containing 10 μg/mL gentamicin for 24 hr. S. Typhi CdtB catalytic mutant (pKan) was included as a control. When indicated, 10 nM antibody was added to cell culture media during the 24-h incubation period. Representative fluorescent microscope images showing pH2AX (green, reflecting host cell DNA damage repair response), S. Typhi (red), and host cell DNA (blue). Zoom-in images (right panels) corresponding to the dotted boxes in the overall images (left panels) are also shown. Scale bar, 10 μm. (B) pH2AX signal quantification in microscopic images obtained from three independent experiments. Bars represent average ±SEM. ∗∗∗∗p < 0.0001, relative to the STy group. n = 45 per group. Two-tailed unpaired t tests.
Figure 6
Figure 6
All nAbs neutralize typhoid toxin in vivo (A–D) Groups of Cmah null mice were administered with LD100 of typhoid toxin with or without nAbs (1:2 molar ratio between toxin and nAb; when indicated, 1:5 mixtures for TyTx1 and TyTx3). Survival (A), body weight changes of mice (B), circulating neutrophil counts in mouse peripheral blood on Day 6 (C), and balance beam walking results of the mice on Day 0 and Day 6 (D) after receiving toxin with or without indicated nAbs. Bars represent the mean ± SEM. n = 8–12. ∗p < 0.05; ∗∗p < 0.01; ∗∗∗∗p < 0.0001, NS, not significant, relative to the PBS group for (B) and the TyT only group for (C and D). The low-rank test was performed for (A) and two-tailed unpaired t tests for (B, C, and D). (E) Representative images of brain tissue sections showing toxin signals in brain endothelial cells that were evaluated 2 h after administration of AF555-conjugated typhoid toxin (red) and nAbs (1:2) into Cmah null mice. Scale bar, 100 µm. (F) Quantification of the toxin signals in brain tissue sections. See also Figure S8 and Tables S3 and S4.

Similar articles

Cited by

References

    1. Abrahams G.L., Hensel M. Manipulating cellular transport and immune responses: dynamic interactions between intracellular Salmonella enterica and its host cells. Cell Microbiol. 2006;8:728–737. - PubMed
    1. Baker S., Holt K.E., Clements A.C., Karkey A., Arjyal A., Boni M.F., Dongol S., Hammond N., Koirala S., Duy P.T. Combined high-resolution genotyping and geospatial analysis reveals modes of endemic urban typhoid fever transmission. Open Biol. 2011;1:110008. - PMC - PubMed
    1. CDC . Oxford University Press; 2017. CDC Yellow Book 2020: Health Information for International Travel. Chapter 4. Travel-related infectious diseases.
    1. Chong A., Lee S., Yang Y.A., Song J. The role of typhoid toxin in Salmonella typhi virulence. Yale J. Biol. Med. 2017;90:283–290. - PMC - PubMed
    1. Crump J.A., Mintz E.D. Global trends in typhoid and paratyphoid Fever. Clin. Infect. Dis. 2010;50:241–246. - PMC - PubMed

LinkOut - more resources