. 2021 May 2;24(5):102509.
doi: 10.1016/j.isci.2021.102509. eCollection 2021 May 21.

Human colorectal cancer-on-chip model to study the microenvironmental influence on early metastatic spread

Affiliations

Human colorectal cancer-on-chip model to study the microenvironmental influence on early metastatic spread

Carly Strelez et al. iScience. .

Abstract

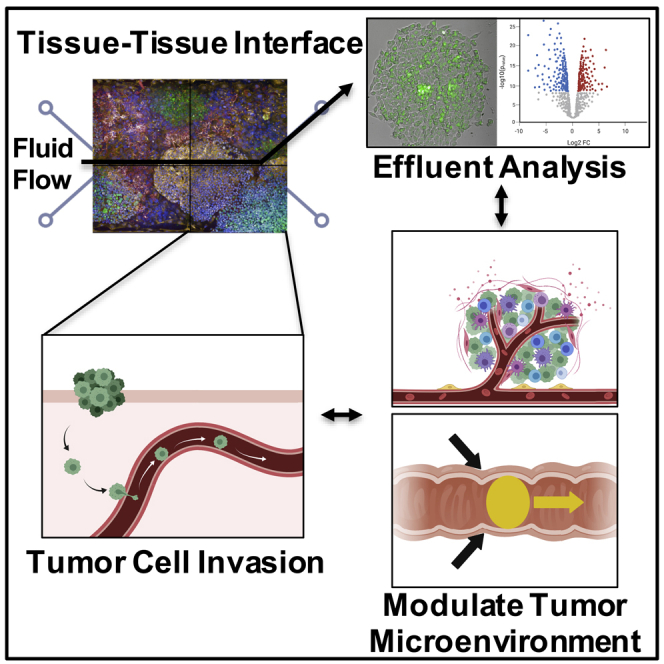
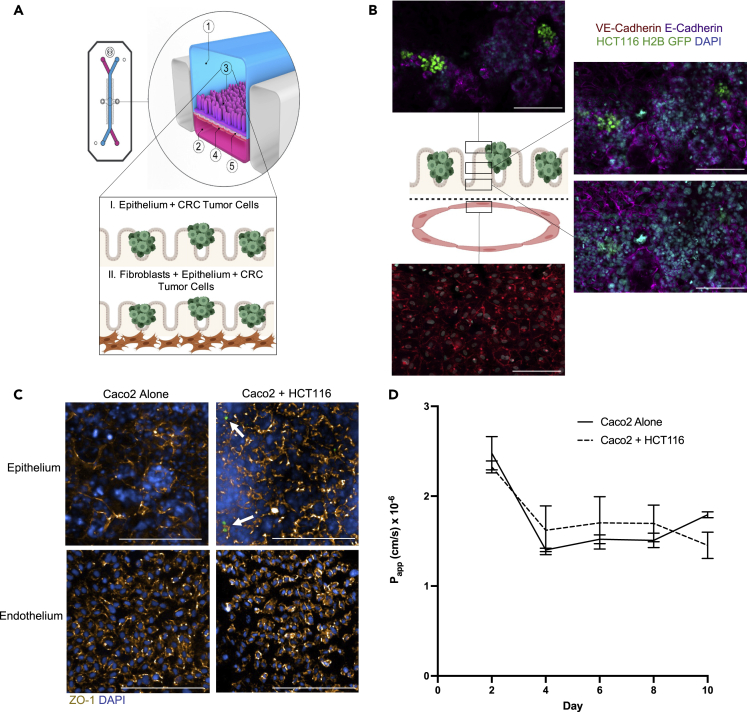
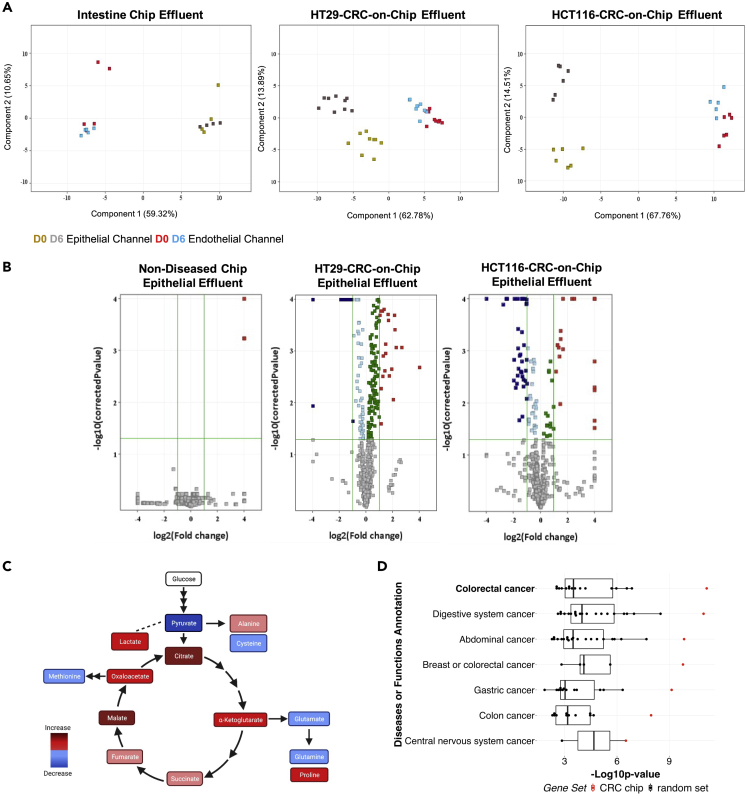
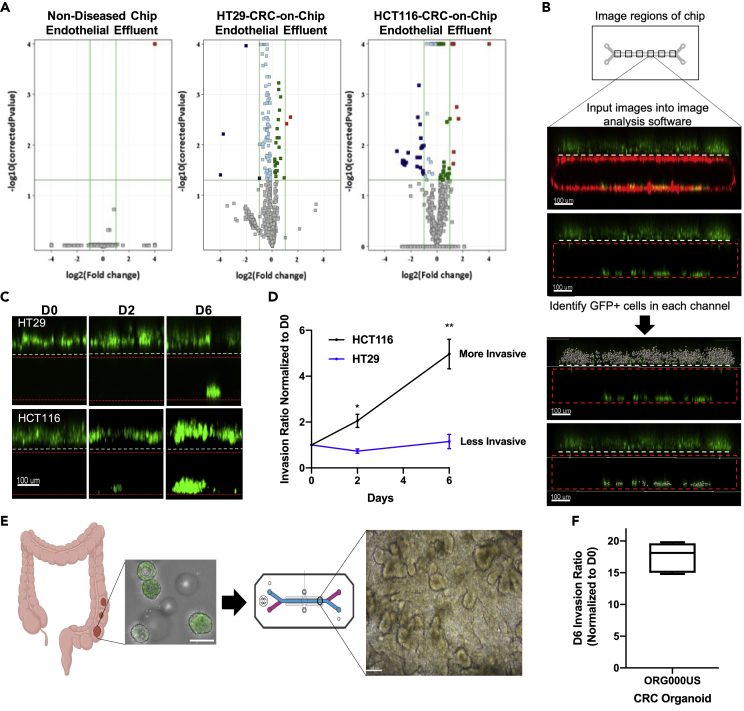
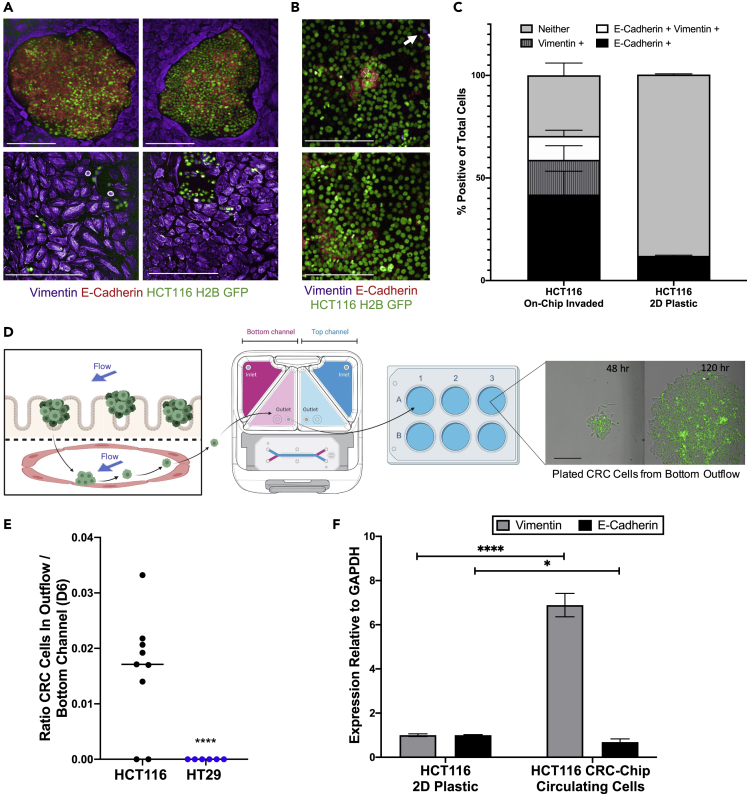
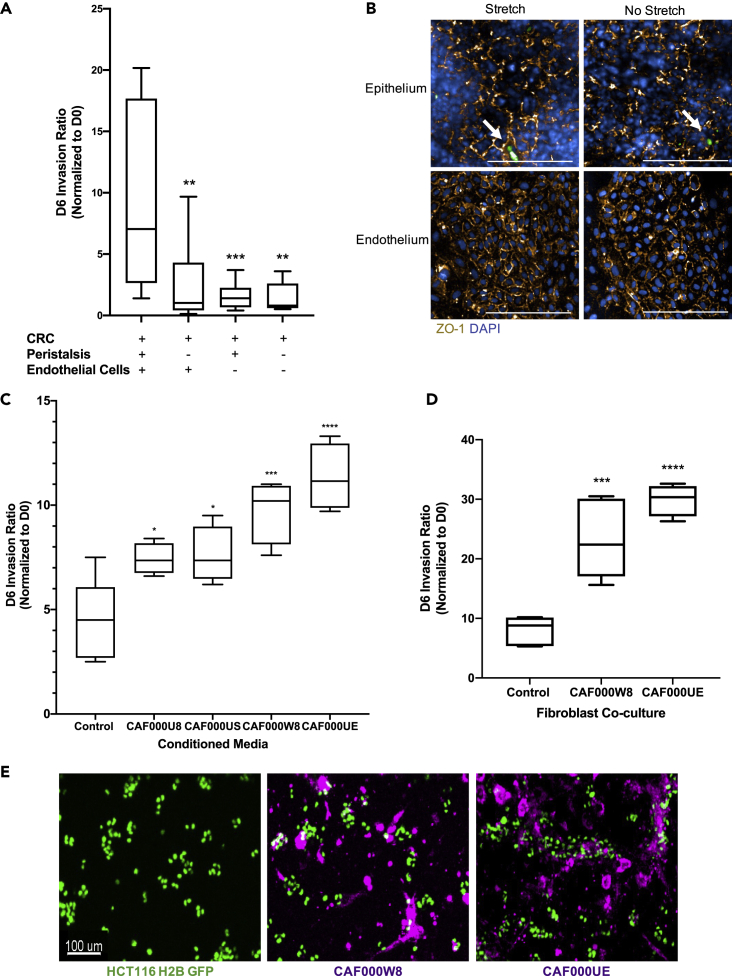
Colorectal cancer (CRC) progression is a complex process that is not well understood. We describe an in vitro organ-on-chip model that emulates in vivo tissue structure and the tumor microenvironment (TME) to better understand intravasation, an early step in metastasis. The CRC-on-chip incorporates fluid flow and peristalsis-like cyclic stretching and consists of endothelial and epithelial compartments, separated by a porous membrane. On-chip imaging and effluent analyses are used to interrogate CRC progression and the resulting cellular heterogeneity. Mass spectrometry-based metabolite profiles are indicative of a CRC disease state. Tumor cells intravasate from the epithelial channel to the endothelial channel, revealing differences in invasion between aggressive and non-aggressive tumor cells. Tuning the TME by peristalsis-like mechanical forces, the epithelial:endothelial interface, and the addition of fibroblasts influences the invasive capabilities of tumor cells. The CRC-on-chip is a tunable human-relevant model system and a valuable tool to study early invasive events in cancer.

Keywords: Bioengineering; Biomedical materials; Cancer; Classification Description; Tissue engineering.


Conflict of interest statement

The authors declare no competing interest.

Figures

None
Graphical abstract
Figure 1
Figure 1
CRC-on-Chip tissue structure (A) The organ-on-chip platform (schematic courtesy of Emulate, Inc.) consists of an epithelial channel (1) comprising epithelial and cancerous cells (3) and an endothelial channel (2) comprising HUVEC cells (4) separated by a porous membrane (5). To model cell-cell interactions in the TME, the CRC-on-Chip was modified to include layers of different cell types in the epithelial channel. CRC tumor cells were seeded on top of the epithelial cells. A stromal layer, comprised of CAFs, can be incorporated into the epithelial channel. (B) Confocal fluorescence images of a chip cross-section spanning 106 μm from the top of the endothelial channel into the epithelial channel, highlighting the endothelial:epithelial tissue:tissue interface. HUVEC cells are labeled with anti-VE cadherin (red). Caco2 C2BBe1 cells labeled with anti-E-Cadherin (purple) form 3D-like structures in the top epithelial channel. HCT116 H2B-GFP cells grow in clusters on top of the Caco2 cells. Nuclei are labeled with DAPI (blue). Scale bar is 100 μm. (C) Representative confocal immunofluorescent images of the epithelial (top) and endothelial (bottom) channels of an Intestine Chip (left) and CRC-on-Chip (right) stained for ZO-1 (gold) on day 6. DAPI (blue) labels the nuclei of the Caco2 C2BBe1 cells in the epithelial channel and HUVECs in the endothelial channel. White arrows designate HCT116 (green) in the epithelial channel of the CRC-on-Chip. Scale bars represent 200 μm. Images are maximum projections that span a 15 μm Z-height in the epithelial channel and a 10 μm Z-height in the endothelial channel with a 5 μm step size. (D) The apparent permeability (Papp) of the intestinal epithelial cells in the top channel was not changed when HCT116 tumor cells were added to the CRC Chips. The concentration of inulin-FITC that diffused from the epithelial channel to the endothelial channel was used to calculate Papp (N = 3 Chips). Data are represented as mean ± SEM and analyzed using a two-way ANOVA; p > 0.05.
Figure 2
Figure 2
Metabolic analyses validate use of CRC-on-Chip to model CRC progression (A) Epithelial and endothelial effluent was collected from the Intestine Chip and the HT29-and HCT116-CRC-on-Chips on days 0 and 6 of the experiment and mass spectrometry-based metabolomics was performed. The principal component analysis (PCA) on the differential metabolites demonstrates the clustering of samples corresponding to the effluent compartment (epithelium or endothelium) and the different time points. (B) Volcano plots comparing the metabolites from the top epithelial channel on day 0 and day 6 for the Intestine Chip and the HT29-and HCT116-CRC-on-Chips. Each point represents a metabolite. Analytes with p values <0.05 and fold change >2 were regarded as statistically significant (colored red and blue upregulated and downregulated, respectively). (C) Differential metabolites between the Intestine Chip and the HCT116-CRC-on-Chip from the epithelial effluent showed altered TCA cycle and amino acid metabolism via Ingenuity Pathway Analysis (IPA). (D) The 50 differential metabolites that matched to our internal database from the epithelial channel of the HCT116-CRC-on-Chip mapped to colorectal cancer with the highest significance (highest –Log10p value) using IPA. Each group is ranked by p value and colored based on the 50 differentially expressed metabolites from our dataset, termed “CRC Chip” (red; asterisk denotes significant outliers) or 20 permutations of 50 randomly selected metabolites, termed “random set” (black box plots).Wilcoxon signed rank test compared the CRC Chips to the random selection sets for the “colorectal cancer” disease state, p = 0.0005.
Figure 3
Figure 3
Validation of CRC tumor cell invasion from an epithelial to endothelial compartment, mimicking intravasation (A) Volcano plots comparing the metabolites from the bottom endothelial channel on day 0 and day 6 for the Intestine Chip and the HT29-and HCT116-CRC-on-Chips. Each point represents a metabolite. Analytes with p values < 0.05 and fold change >2 were regarded as statistically significant (colored red and blue). (B) 6 regions of the chip were imaged via confocal microscopy and input into 3-D reconstruction software for GFP + cell quantification. An invasion ratio was calculated based on the number of GFP + cells in the bottom channel compared to the top channel and normalized by the day 0 counts. Scale bars represent 100 μm. (C and D) Tumor cell (HCT116 or HT29) invasion was monitored over time by imaging the same chip regions at various time points, days 0, 2, 6. Representative images show different invasion behavior for each tumor cell (C) and quantification is also depicted (D). N = 6 Chips. Data are represented as mean ± SEM and analyzed using a two-way ANOVA; ∗p < 0.05; ∗∗p < 0.01). Scale bars represent 100 μm. (E) CRC organoids (H2B GFP labeled) from patient 000US were dissociated and fragments were seeded onto the ECM-coated epithelial channel. Brightfield image of the 000US organoids seeded in the epithelial channel of the chip showing the CRC tissue architecture on day 6 (D6). Scale bars represent 100 μm. Chip schematic courtesy of Emulate, Inc. (F) Invasion of ORG000US was measured on D6 of the experiment (N = 6 Chips). An invasion ratio was calculated based on the number of GFP + cells in the bottom channel compared to the top channel and normalized by the day 0 counts. Data are represented using a boxplot.
Figure 4
Figure 4
CRC cell heterogeneity during intravasation on-chip (A) Representative images depict the phenotypic heterogeneity of invaded HCT116 cells adhered to endothelial cells in the bottom chip channel. HUVECs uniformly express vimentin (purple), while clusters of HCT116 cells (green) grow in tight aggregates and highly express E-Cadherin (red) (top panels) or grow in more disperse colonies with higher vimentin (purple) expression (bottom panels). Scale bar represents 200 μm and images are from day 6 of the experiment. (B) Representative images depict the heterogeneity of HCT116 cells cultured on plastic. HCT116 cells (green) show moderate expression of E-Cadherin (red), with relatively few vimentin-positive cells (purple) (white arrow). Cells were grown to 70% confluency before fixation, immunofluorescent staining, and imaging. Scale bar represents 200 μm. (C) HCT116 heterogeneity from (A) and (B) was quantitated using PerkinElmer Harmony software. GFP + tumor cells were segmented and classified as E-Cadherin + or vimentin + based on intensity thresholds (N = 5 Chips for chip experiments, N = 4 replicates for 2D plastic experiments). Data are represented as mean ± SEM. (D) Invaded CTCs are found in the endothelial effluent where they are collected and cultured for down-stream analyses. Scale bar represents 200 μm. (E) Viable tumor cells were collected from the effluent of the bottom endothelial channel reservoir on day 6. Cells were plated and counted via HCS imaging system once the cells had attached to the plate (6-10 hr later) (N = 6 Chips for HT29 experiments, N = 9 Chips for HCT116 experiments; ∗∗∗∗p < 0.0001). (F) RT-qPCR results show invaded HCT116 cells have reduced E-Cadherin and increased vimentin expression compared to HCT116 cells grown on plastic tissue culture dishes (N = 6 replicates). Data are represented as mean ± SEM and analyzed using multiple unpaired t-tests; ∗∗∗∗p < 0.0001, ∗p < 0.05).
Figure 5
Figure 5
The TME influences tumor cell invasion (A) CRC-on-Chips were cultured in the presence of cyclic peristalsis-like mechanical strain and HUVECs (N = 12 Chips), without cyclic strain and with HUVECs (N = 12 Chips), with cyclic strain and without HUVEC cells (N = 12 Chips) or without cyclic strain or HUVECs (N = 9 Chips). The invasion ratio of the HCT116 cells was determined via microscopy. Data are represented as boxplots and analyzed using a 1-way ANOVA with multiple comparisons; ∗∗p < 0.01, ∗∗∗p < 0.001. (B) Representative confocal immunofluorescent images of the epithelial (top) and endothelial (bottom) channels of the CRC-on-Chips in the presence (left) or absence (right) of peristalsis stained for ZO-1 (gold) on day 6. DAPI (blue) labels the nuclei of Caco2 C2BBe1 cells in the epithelial channel and HUVECs in the endothelial channel. White arrows indicate HCT116 cells. Scale bars represent 200 μm. Images are maximum projections that span a 15 μm Z-height in the epithelial channel and a 10 μm Z-height in the endothelial channel with a 5 μm step size. (C) Conditioned media from CAFs derived from four patients (N = 4 Chips for each patient-derived CAF) was flowed through the epithelial channel for the duration of the experiment. Differences in HCT116 cell invasion ratio quantification is depicted. Data are represented as boxplots and analyzed using 1-way ANOVA with multiple comparisons; ∗p < 0.05; ∗∗∗p < 0.001; ∗∗∗∗p < 0.0001. (D) Representative CAFs derived from two patients were labeled with Cell Tracker Deep Red and seeded in the top channel prior to epithelial cell and HCT116 cell seeding (N = 4 replicates for each patient-derived CAF) and the invasion ratio was quantified on day 6. Data are represented as boxplots and analyzed using a 1-way ANOVA with multiple comparisons; ∗∗∗p < 0.001; ∗∗∗∗p < 0.0001. (E) Representative images of CAF000W8 and CAF000UE on day 0 (one day after tumor cell seeding) illustrate heterocellular interactions on chip. Scale bar represents 100 μm.

References

    1. Aleman J., Skardal A. A multi-site metastasis-on-a-chip microphysiological system for assessing metastatic preference of cancer cells. Biotechnol. Bioeng. 2019;116:936–944. - PMC - PubMed
    1. Amos S.E., Choi Y.S. The cancer microenvironment: mechanical challenges of the metastatic cascade. Front. Bioeng. Biotechnol. 2021;9:625859. - PMC - PubMed
    1. Armistead F.J., Gala De Pablo J., Gadêlha H., Peyman S.A., Evans S.D. Physical biomarkers of disease progression: on-chip monitoring of changes in mechanobiology of colorectal cancer cells. Sci. Rep. 2020;10:3254. - PMC - PubMed
    1. Bai J., Tu T.Y., Kim C., Thiery J.P., Kamm R.D. Identification of drugs as single agents or in combination to prevent carcinoma dissemination in a microfluidic 3D environment. Oncotarget. 2015;6:36603–36614. - PMC - PubMed
    1. Basson M.D. Effects of repetitive deformation on intestinal epithelial cells. Inflammopharmacology. 2007;15:109–114. - PubMed

LinkOut - more resources