Cancer Incidence Projections in the United States Between 2015 and 2050
- PMID: 34114543
- PMCID: PMC8220959
- DOI: 10.5888/pcd18.210006
Cancer Incidence Projections in the United States Between 2015 and 2050
Abstract
Introduction: The number of adults entering the age groups at greatest risk for being diagnosed with cancer is increasing. Projecting cancer incidence can help the cancer control community plan and evaluate prevention strategies aimed at reducing the growing number of cancer cases.
Methods: We used data from the Surveillance, Epidemiology, and End Results Program and the US Census Bureau to estimate average, annual, age-standardized cancer incidence rates and case counts (for all sites combined and top 22 invasive cancers) in the US for 2015 and to project cancer rates and counts to 2050. We used age, period, and cohort models to inform projections.
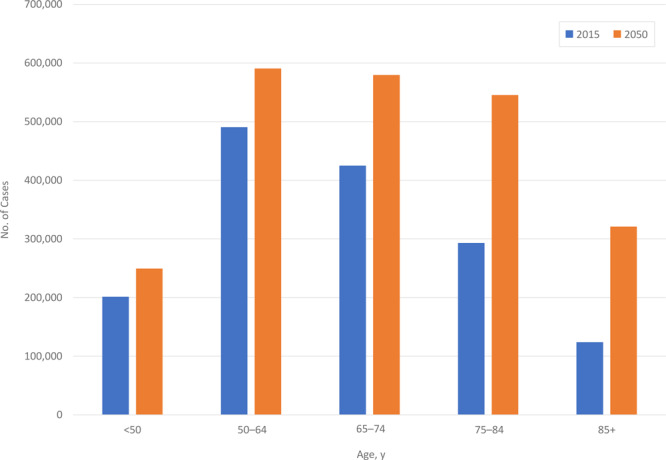
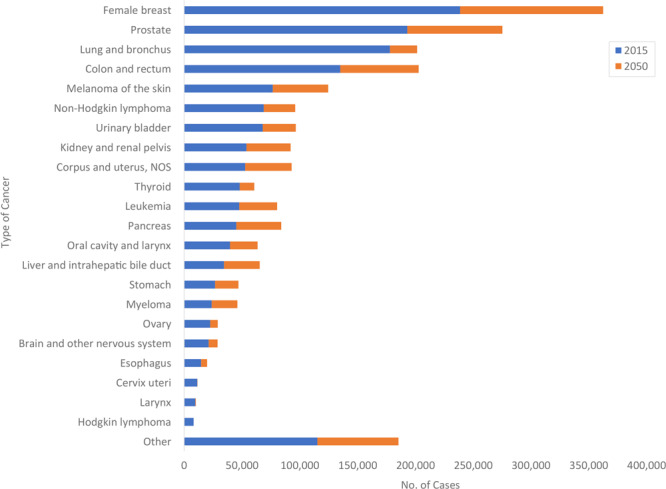
Results: Between 2015 and 2050, we predict the overall age-standardized incidence rate (proxy for population risk for being diagnosed with cancer) to stabilize in women (1%) and decrease in men (-9%). Cancers with the largest change in risk include a 34% reduction for lung and bronchus and a 32% increase for corpus uterine (32%). Because of the growth and aging of the US population, we predict that the annual number of cancer cases will increase 49%, from 1,534,500 in 2015 to 2,286,300 in 2050, with the largest percentage increase among adults aged ≥75 years. Cancers with the largest projected absolute increase include female breast, colon and rectum, and prostate.
Discussion: By 2050, we predict the total number of incident cases to increase by almost 50% as a result of the growth and aging of the US population. A greater emphasis on cancer risk reduction is needed to counter these trends.
Figures
References
-
- US Cancer Statistics Working Group. US Cancer Statistics Data Visualizations Tool, based on 2019. submission data (1999–2017). https://www.cdc.gov/cancer/uscs/dataviz/index.htm. Accessed April 28, 2021.
-
- Ortman JM, Velkoff VA, Hogan H. An aging nation: the older population in the United States. https://www.census.gov/content/dam/Census/library/publications/2014/demo.... Accessed April 28, 2021.
MeSH terms
LinkOut - more resources
Full Text Sources
Medical