. 2021 Jun 11:10:e58903.
doi: 10.7554/eLife.58903.

Microtubule reorganization during female meiosis in C. elegans

Affiliations

Microtubule reorganization during female meiosis in C. elegans

Ina Lantzsch et al. Elife. .

Erratum in

Abstract

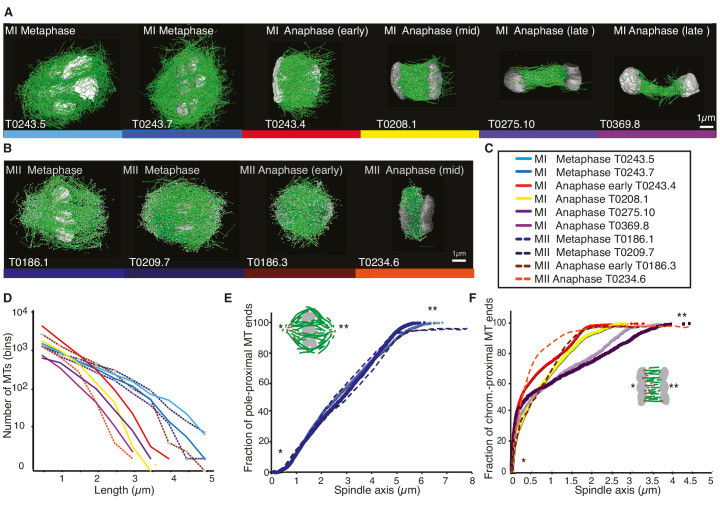
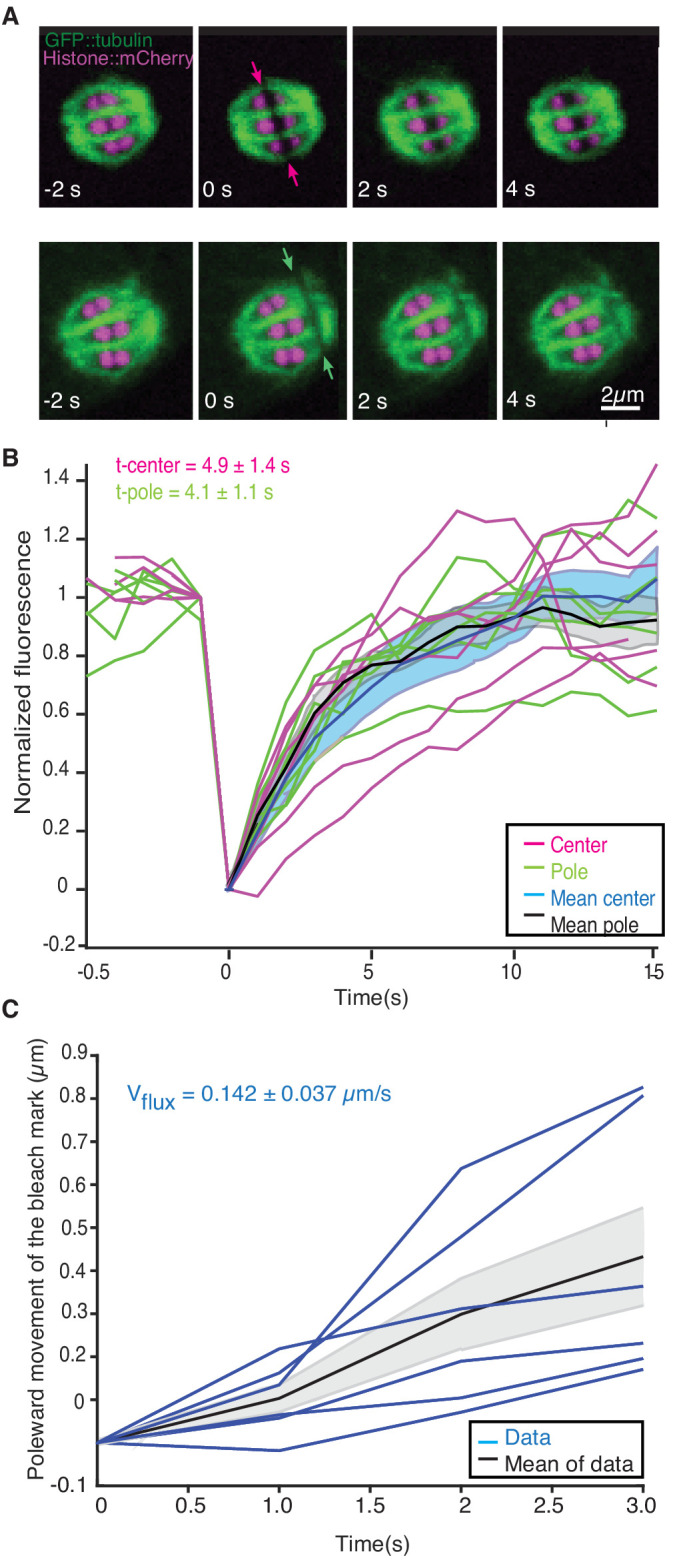
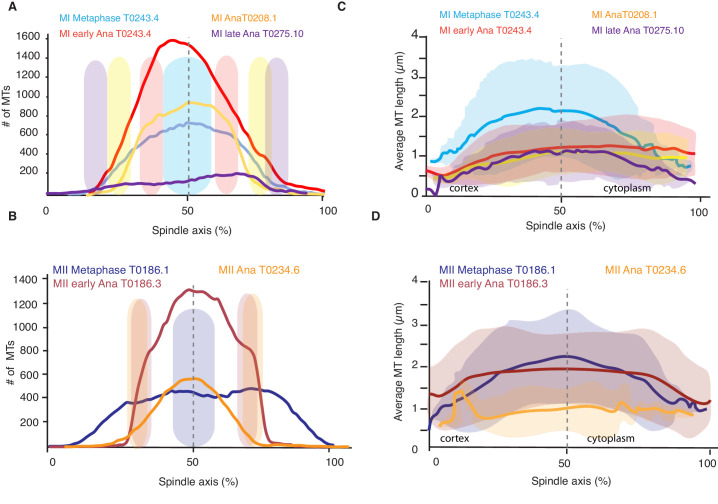
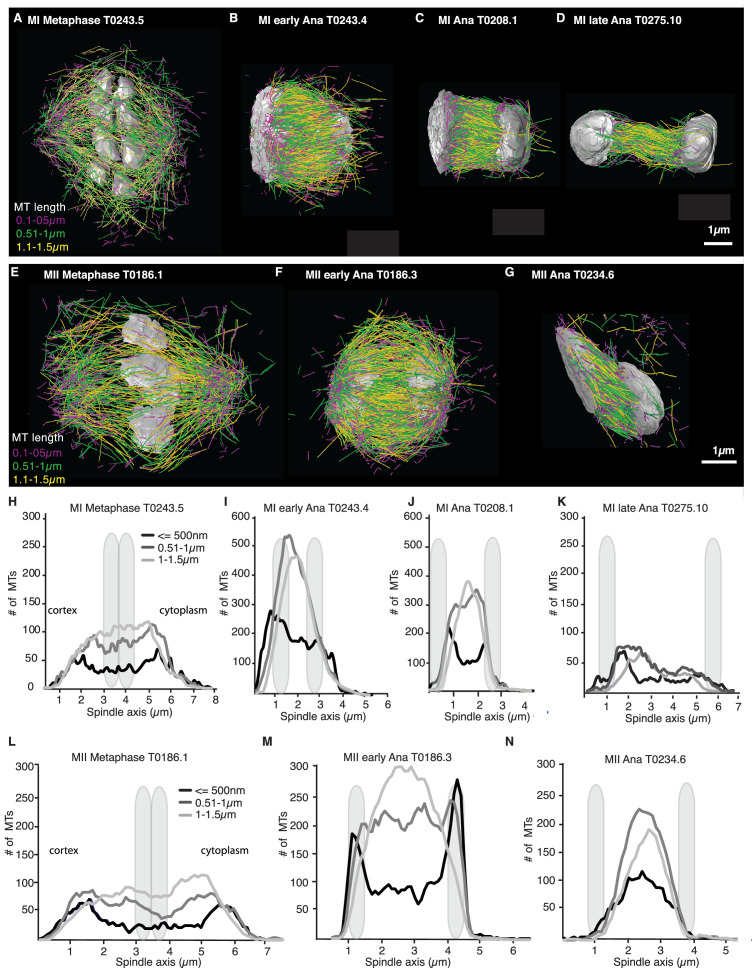
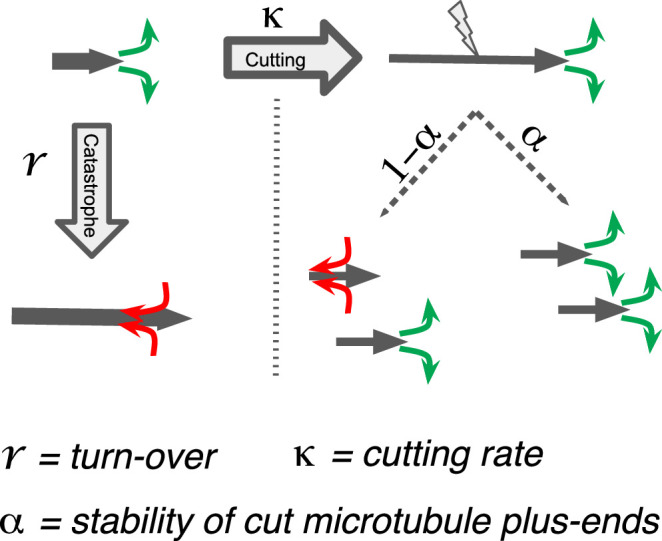
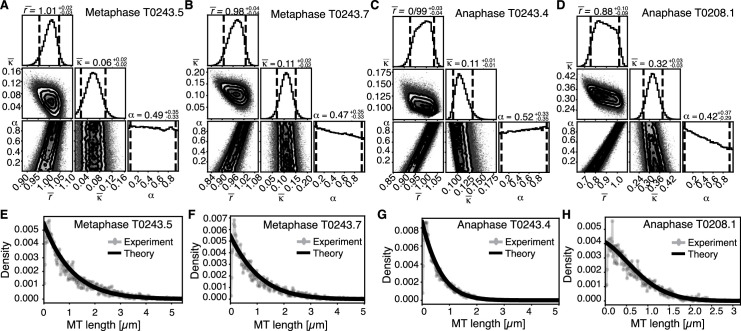
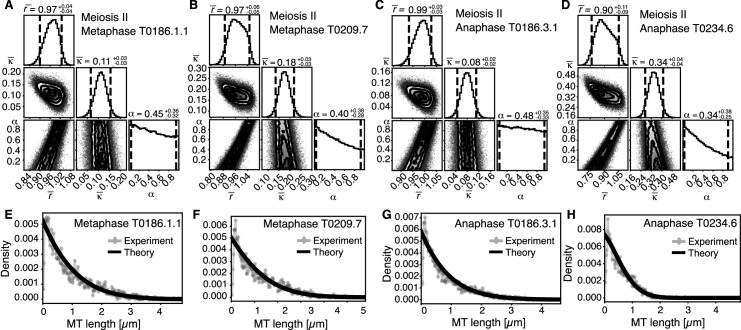
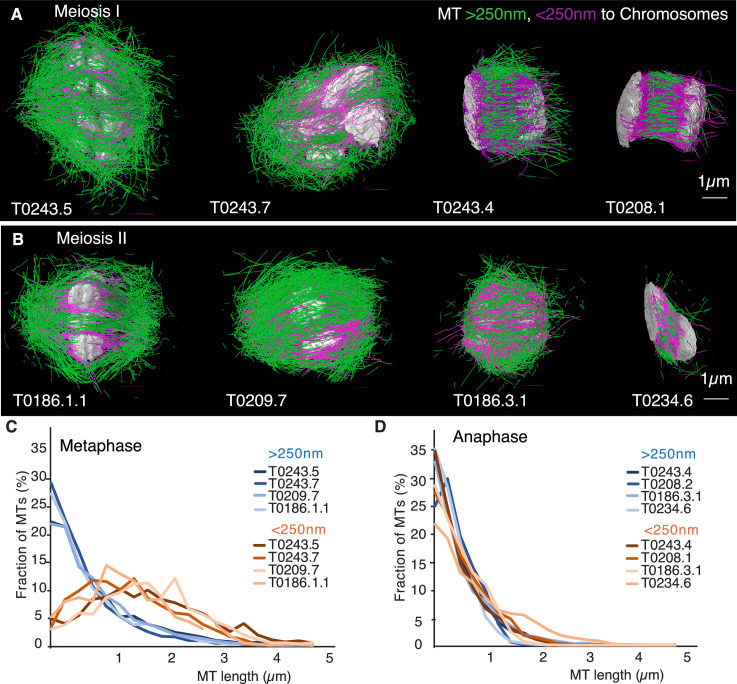
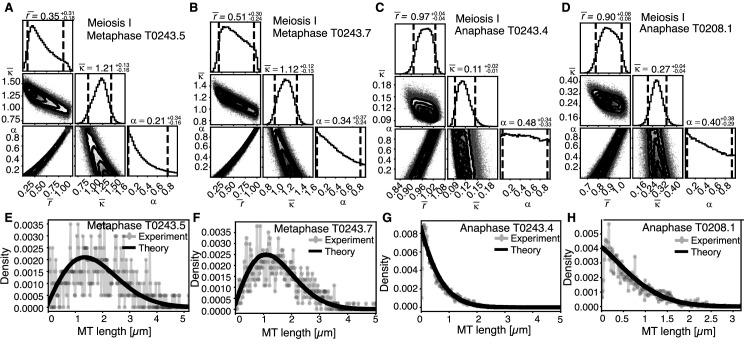
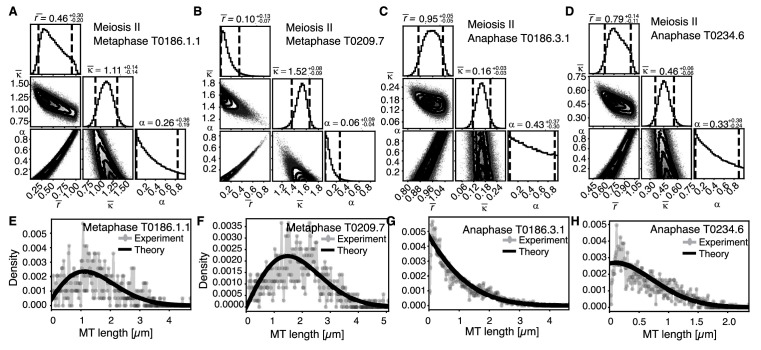
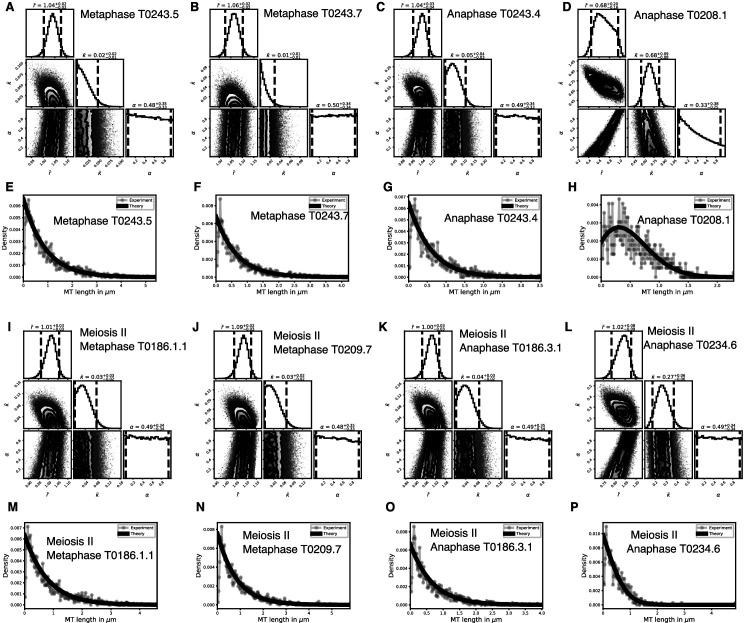
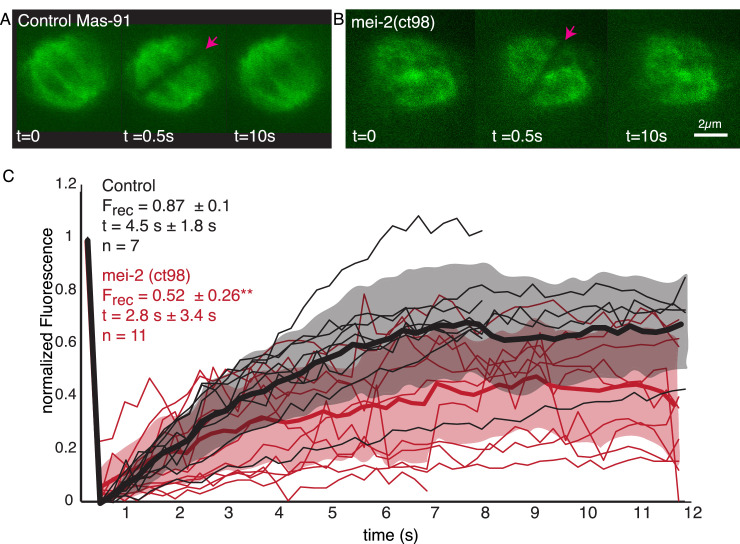
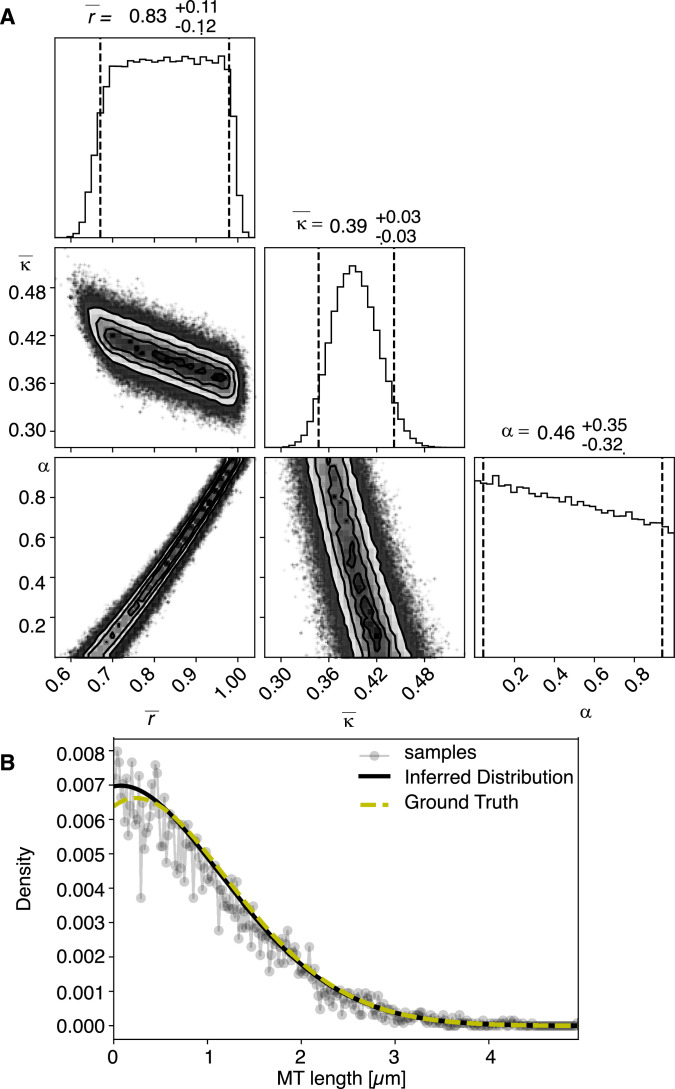
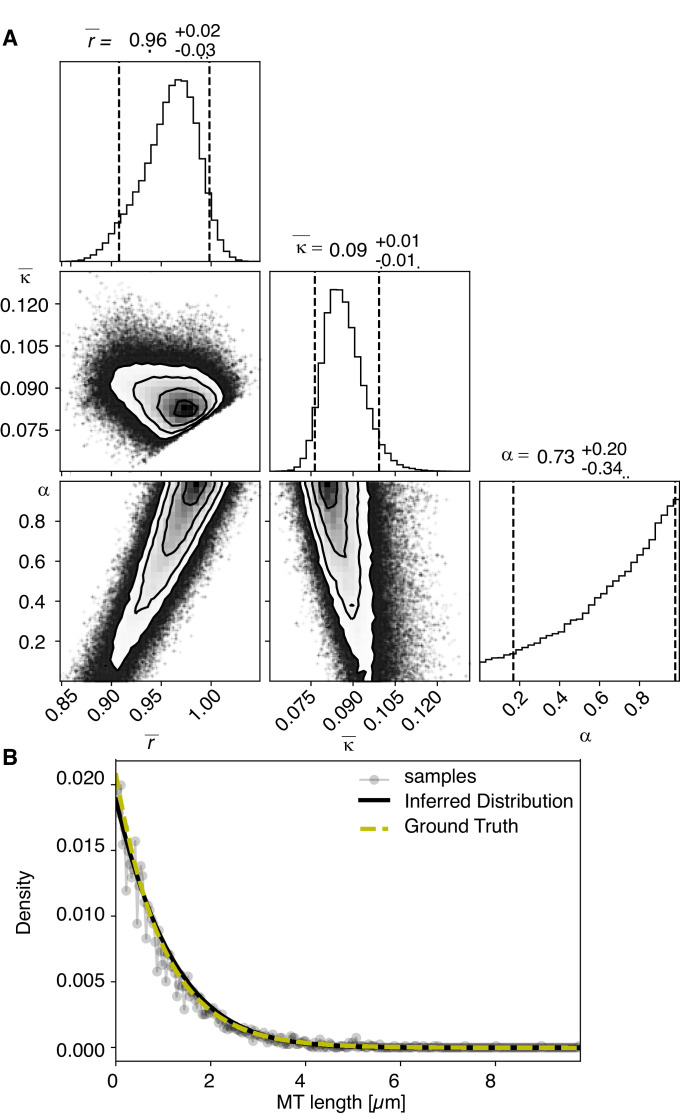
Most female meiotic spindles undergo striking morphological changes while transitioning from metaphase to anaphase. The ultra-structure of meiotic spindles, and how changes to this structure correlate with such dramatic spindle rearrangements remains largely unknown. To address this, we applied light microscopy, large-scale electron tomography and mathematical modeling of female meiotic Caenorhabditis elegans spindles. Combining these approaches, we find that meiotic spindles are dynamic arrays of short microtubules that turn over within seconds. The results show that the metaphase to anaphase transition correlates with an increase in microtubule numbers and a decrease in their average length. Detailed analysis of the tomographic data revealed that the microtubule length changes significantly during the metaphase-to-anaphase transition. This effect is most pronounced for microtubules located within 150 nm of the chromosome surface. To understand the mechanisms that drive this transition, we developed a mathematical model for the microtubule length distribution that considers microtubule growth, catastrophe, and severing. Using Bayesian inference to compare model predictions and data, we find that microtubule turn-over is the major driver of the spindle reorganizations. Our data suggest that in metaphase only a minor fraction of microtubules, those closest to the chromosomes, are severed. The large majority of microtubules, which are not in close contact with chromosomes, do not undergo severing. Instead, their length distribution is fully explained by growth and catastrophe. This suggests that the most prominent drivers of spindle rearrangements are changes in nucleation and catastrophe rate. In addition, we provide evidence that microtubule severing is dependent on katanin.

Keywords: C. elegans; Meiosis; cell biology; computational biology; mathematical modelling; microtubules; systems biology; tomography.


Conflict of interest statement

IL, CY, YC, VZ, HY, NL, ES, AP, SP, MS, SF, SR No competing interests declared

Figures

Figure 1.
Figure 1.. Three-dimensional organization of microtubules in meiosis I and II.
(A) Three-dimensional models showing full reconstruction of microtubules at different stages of wild-type meiosis I. The different stages from metaphase to late anaphase are indicated. Microtubules are shown in green, chromosomes in gray. An individual color is assigned to each dataset. The anaphase datasets are oriented with the cortical side being left, cytoplasmic right. (B) Like (A) but three-dimensional models showing full reconstruction of microtubules at different stages of wild-type meiosis II. (C) Legend for the different datasets plotted in (D–F). (D) Length distribution of microtubules composing the different spindles. Bin size 250 nm. (E) Cumulative distance function of the pole-proximal microtubule endpoints in metaphase of meiosis I and II. The position of the spindle poles in the schematic drawing and the datasets is indicated (stars). (F) Cumulative distance function of the chromosome-proximal microtubule endpoints in anaphase. The position of the poles is indicated (stars).
Figure 2.
Figure 2.. Microtubule dynamics during metaphase of meiosis I.
(A) Light microscope images of spindles in meiosis I prior to and after photobleaching at the spindle center (top row, red arrows) and close to the spindle pole (bottom row, green arrows). The bleaching of the sample (t = 0) and the frame rate is indicated. (B) Plot of the recovery of the bleach mark over time at the center (magenta, mean values given in blue) and pole (green, mean values given in black) for different datasets. The recovery times for the datasets are shown in the plot. (C) Plot showing the poleward motion of the bleach mark at the spindle pole over time for different datasets (blue). The mean is indicated in black.
Figure 3.
Figure 3.. Analysis of microtubule number and length along the spindle axis.
(A) Plot of the number of microtubules at different positions (100 nm steps) along the spindle axis for four different datasets in metaphase, early anaphase, and mid and late anaphase in meiosis I. The approximate position of chromosomes for each dataset is indicated by the colored ovals. The datasets are oriented with ‘0’ being at the cortical side. Datasets are aligned with the center of the spindle located at 50%. (B) Same plot as in (A) but for meiosis II. (C) Plot of the average microtubule length at different positions (100 nm steps) along the spindle axis for four different datasets in metaphase, early anaphase, and mid and late anaphase. Shaded color indicates the standard deviation, datasets are oriented with ‘0’ being at the cortical side. Datasets are aligned with the center of the spindle located at 50%. (D) Same plot as in (C) but for meiosis II.
Figure 4.
Figure 4.. Analysis of microtubule number according to their length along the spindle axis.
(A–G) Tomographic reconstructions of meiotic spindles in meiosis I and II showing microtubules of different length. Microtubules with length ≤ 500 nm are magenta, microtubules between 0.51 and 1 µm are green, and microtubules between 1.1 and 1.5 µm are yellow. Chromosomes are gray, spindles are oriented with the cortical site to the left. Scale bar 1 µm. (H–N) Plots showing the number of microtubules according to their length along the spindle axis for the datasets shown in (A–G). Dark line shows the number of microtubules ≤ 500 nm, medium gray line microtubules between 0.5 and 1 µm, and light gray lines microtubules between 1 and 1.5 µm. The approximate position of chromosomes is indicated by gray outlines.
Figure 5.
Figure 5.. Processes determining microtubule (MT) length distributions.
Our model considers MT turnover with a rate r and cutting with a rate κ. α is the stability of cutting-generated MT plus ends.
Figure 6.
Figure 6.. Inference of model parameters in metaphase and anaphase spindles of meiosis I.
(A) Likelihood distribution of model parameters determined by Markov Chain Monte Carlo (MCMC) for metaphase T0243.5. The top boxes show the totally marginalized distribution of parameters, with dashed lines delimiting the 95% confidence interval. Surface plots show cuts through the likelihood distributions, marginalized onto 2D subspaces. Lines are contour lines, dots indicate MCMC samples. (B) Same as in (A) but for the metaphase T0243.7 dataset. (C) Same as in (A) but for the early anaphase T0243.4 dataset. (D) Same as in (A) but for the mid anaphase T0208.1 dataset. (E–H) Comparison of experimentally determined length distribution of microtubules (dots) to the prediction of the highest likelihood model (solid line) for metaphase T0243.5 (E), metaphase T0243.7 (F), early anaphase T0243.4 (G), and mid anaphase T0208.1 (H). Plots for meiosis II can be found in Figure 6—figure supplement 1.
Figure 6—figure supplement 1.
Figure 6—figure supplement 1.. Inference of model parameters in metaphase and anaphase spindles of meiosis II.
(A) Likelihood distribution of model parameters determined by Markov Chain Monte Carlo (MCMC) for meiosis II metaphase T0186.1.1. The top boxes show the totally marginalized distribution of parameters, with dashed lines delimiting the 95% confidence interval. Surface plots show cuts through the likelihood distributions, marginalized onto 2D subspaces. Lines are contour lines, dots indicate MCMC samples. (B) Same as in (A) but for the metaphase T0209.7 dataset. (C) Same as in (A) but for the early anaphase T0186.3.1 dataset. (D) Same as in (A) but for the mid anaphase T0234.6 dataset. (E–H) Comparison of experimentally determined length distribution of microtubules (dots) to the prediction of the highest likelihood model (solid line) for metaphase T0186.1.1 (E), metaphase T0209.7 (F), early anaphase 186.3.1 (G), and mid anaphase T0234.6 (H).
Figure 7.
Figure 7.. Analysis of microtubule length distributions within 150 nm of the chromosomes.
(A) Tomographic reconstructions of meiotic spindles in meiosis I from metaphase to anaphase. The reconstructions show microtubules located with and end or lattice point within 150 nm from the chromosome surface in magenta and microtubules located further away in green. Chromosomes are gray. Scale bar 1 µm. (B) Same as (A) but for spindles in meiosis II. (C) Plot of the length distribution of microtubules in respect to their distance from the chromosomes for metaphase spindles in meiosis I and II. Red lines show microtubules located within 150 nm from the chromosomes, blue lines show microtubules further away. Bin size 250 nm. (D) Similar to the plot in (C) but for anaphase spindles in meiosis I and II.
Figure 8.
Figure 8.. Selective inference model parameters in metaphase and anaphase spindles in meiosis I for microtubules located within 150 nm of the chromosomes.
(A) Likelihood distribution of model parameters determined by Markov Chain Monte Carlo (MCMC) for microtubules within 150 nm distance from the chromosomes in metaphase T0243.5 meiosis I. The top boxes show the totally marginalized distribution of parameters, with dashed lines delimiting the 95% confidence interval. Surface plots show cuts through the likelihood distributions, marginalized onto 2D subspaces. Lines are contour lines, dots indicate MCMC samples. (B) Same as in (A) but for meiosis I metaphase T0243.7 dataset. (C) Same as in (A) but for meiosis I T0243.3 early anaphase dataset. (D) Same as in (A) but for the meiosis I mid anaphase T0208.1 dataset (E–H) Comparison of experimentally determined length distributions of microtubules located within 150 nm from the chromosome surface (dots) to the prediction of the highest likelihood model (solid line) for meiosis I metaphase T0243.5 (E), meiosis I metaphase T0243.7 (F), meiosis I early anaphase T0234.4 (G), and meiosis I mid anaphase T0208.1 (H). Plots for meiosis II can be found in Figure 8—figure supplement 1, and plots for microtubules further away than 150 nm can be found in Figure 8—figure supplement 2.
Figure 8—figure supplement 1.
Figure 8—figure supplement 1.. Selective inference model parameters in meiosis II metaphase and anaphase spindles for microtubules located within 150 nm of the chromosomes.
(A) Likelihood distribution of model parameters determined by Markov Chain Monte Carlo (MCMC) for microtubules within 150 nm distance from the chromosomes in meiosis II metaphase T0186.1.1. The top boxes show the totally marginalized distribution of parameters, with dashed lines delimiting the 95% confidence interval. Surface plots show cuts through the likelihood distributions, marginalized onto 2D subspaces. Lines are contour lines, dots indicate MCMC samples. (B) Same as in (A) but for the metaphase T0209.7 dataset. (C) Same as in (A) but for the early anaphase T0186.3.1 dataset. (D) Same as in (A) but for the mid anaphase T0234.6 dataset. (E–H) Comparison of experimentally determined length distribution of microtubules (dots) to the prediction of the highest likelihood model (solid line) for metaphase T0186.1.1 (E), metaphase T0209.7 (F), early anaphase T0186.3.1 (G), and mid anaphase T0234.6 (H).
Figure 8—figure supplement 2.
Figure 8—figure supplement 2.. Selective inference model parameters in metaphase and anaphase spindles for microtubules located further than 150 nm from the chromosomes in meiosis I and II.
(A) Likelihood distribution of model parameters determined by Markov Chain Monte Carlo (MCMC) for meiosis II metaphase T0186.1.1. The top boxes show the totally marginalized distribution of parameters, with dashed lines delimiting the 95% confidence interval. Surface plots show cuts through the likelihood distributions, marginalized onto 2D subspaces. Lines are contour lines, dots indicate MCMC samples. (B) Same as in (A) but for the metaphase T0209.7 dataset. (C) Same as in (A) but for the early anaphase T0186.3.1 dataset. (D) Same as in (A) but for the mid anaphase T0234.6 dataset. (E–H) Comparison of experimentally determined length distribution of microtubules (dots) to the prediction of the highest likelihood model (solid line) for metaphase T0186.1.1 (E), metaphase T0209.7 (F), early 50 nm distance from the chromosomes in meiosis II metaphase T0186.1.1. The top boxes show the totally marginalized distribution of parameters, with dashed lines delimiting the 95% confidence interval. Surface plots show cuts through the likelihood distributions, marginalized onto 2D subspaces. Lines are contour lines, dots indicate MCMC samples. (J) Same as in (I) but for the metaphase T0209.7 dataset. (K) Same as in (I) but for the early anaphase T0186.3.1 dataset. (L) Same as in (I) but for the mid anaphase T0234.6 dataset. (M–P) Comparison of experimentally determined length distribution of microtubules (dots) to the prediction of the highest likelihood model (solid line) for metaphase T0186.1.1 (M), metaphase T0209.7 (N), early anaphase T0186.3.1 (O), and mid anaphase T0234.6 (P).
Figure 9.
Figure 9.. Microtubule turnover during metaphase of meiosis I in mei-2(ct98) embryos.
(A) Light microscope images of spindles in control embryos in meiosis I prior to and after photobleaching at the spindle center (red arrow). The time points are indicated. (B) Light microscope images of spindles in meiosis I in the katanin mei-2(ct98) mutant prior to and after photobleaching at the spindle center (red arrow). The time points are indicated. Scale bar 2 µm. (C) Plot of the recovery of the bleach mark over time in control embryos (black) and mei-2 (ct98) (red) for different datasets. Mean values are indicated by thick lines, the shaded region corresponds to the standard deviation. The fraction of recovery (Frec) and recovery times for the datasets are shown in the plot.
Figure 10.
Figure 10.. Results of inference versus ground truths on artificial data: case with cutting.
(A) Likelihood distribution of model parameters determined by Markov Chain Monte Carlo (MCMC) for microtubules assuming cutting of microtubules. The top boxes show the totally marginalized distribution of parameters, with dashed lines delimiting the 95% confidence interval. Surface plots show cuts through the likelihood distributions, marginalized onto 2D subspaces. Lines are contour lines, dots indicate MCMC samples. (B) Comparison of experimentally determined length distribution of microtubules (gray) to the prediction of the highest likelihood model (black) and the ground truth (green).
Figure 11.
Figure 11.. Results of inference versus ground truths on artificial data: case without cutting.
(A) Likelihood distribution of model parameters determined by Markov Chain Monte Carlo (MCMC) for microtubules assuming microtubules are not cut. The top boxes show the totally marginalized distribution of parameters, with dashed lines delimiting the 95% confidence interval. Surface plots show cuts through the likelihood distributions, marginalized onto 2D subspaces. Lines are contour lines, dots indicate MCMC samples. (B) Comparison of experimentally determined length distribution of microtubules (gray) to the prediction of the highest likelihood model (black) and the ground truth (green).

Similar articles

Cited by

References

    1. Albertson DG, Thomson JN. Segregation of holocentric chromosomes at meiosis in the nematode, Caenorhabditis elegans. Chromosome Research. 1993;1:15–26. doi: 10.1007/BF00710603. - DOI - PubMed
    1. Bakhoum SF, Genovese G, Compton DA. Deviant kinetochore microtubule dynamics underlie chromosomal instability. Current Biology. 2009;19:1937–1942. doi: 10.1016/j.cub.2009.09.055. - DOI - PMC - PubMed
    1. Brenner S. The genetics of Caenorhabditis elegans. Genetics. 1974;77:71–94. doi: 10.1093/genetics/77.1.71. - DOI - PMC - PubMed
    1. Brinkley BR, Cartwright J. Cold-labile and cold-stable microtubules in the mitotic spindle of mammalian cells. Annals of the New York Academy of Sciences. 1975;253:428–439. doi: 10.1111/j.1749-6632.1975.tb19218.x. - DOI - PubMed
    1. Brugués J, Nuzzo V, Mazur E, Needleman DJ. Nucleation and transport organize microtubules in metaphase spindles. Cell. 2012;149:554–564. doi: 10.1016/j.cell.2012.03.027. - DOI - PubMed

Publication types