. 2021 Oct 1;31(11):4986-5005.
doi: 10.1093/cercor/bhab136.

Attentional Modulation of Hierarchical Speech Representations in a Multitalker Environment

Affiliations

Attentional Modulation of Hierarchical Speech Representations in a Multitalker Environment

Ibrahim Kiremitçi et al. Cereb Cortex. .

Abstract

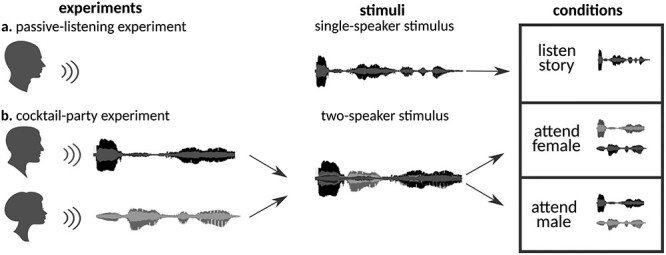
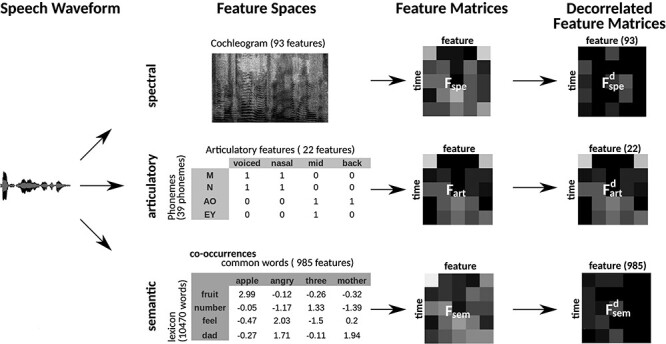
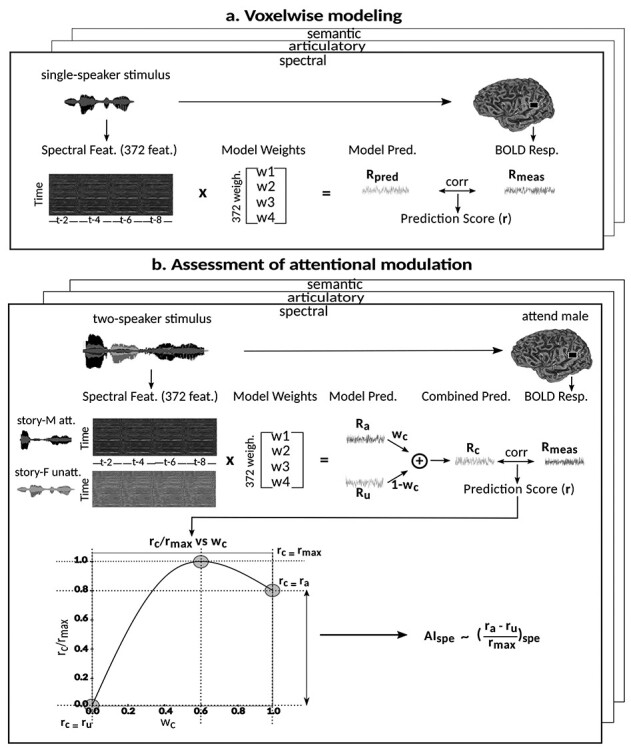
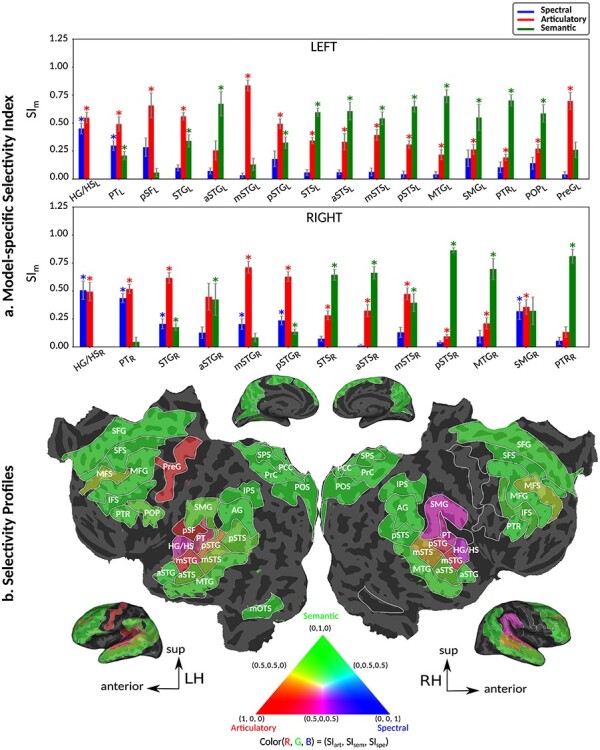
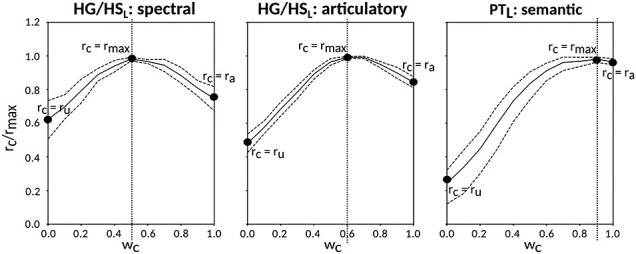
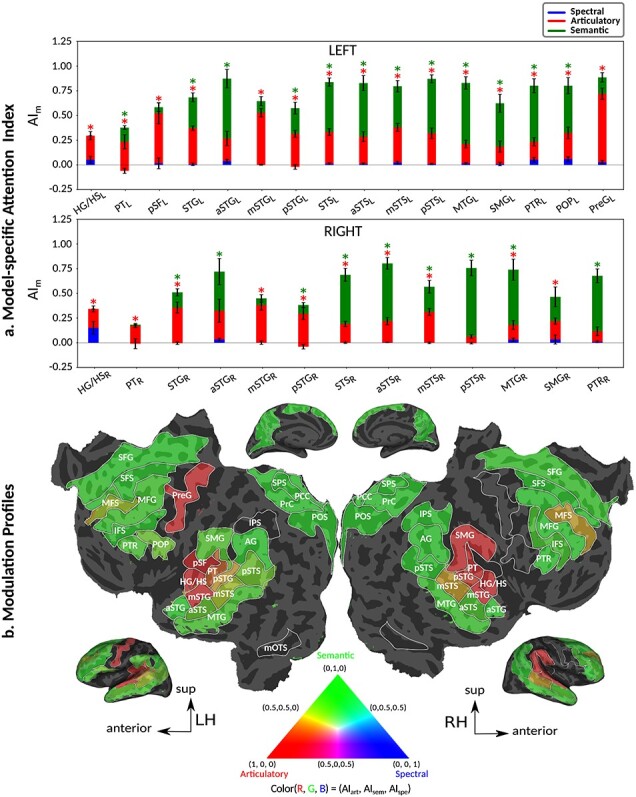
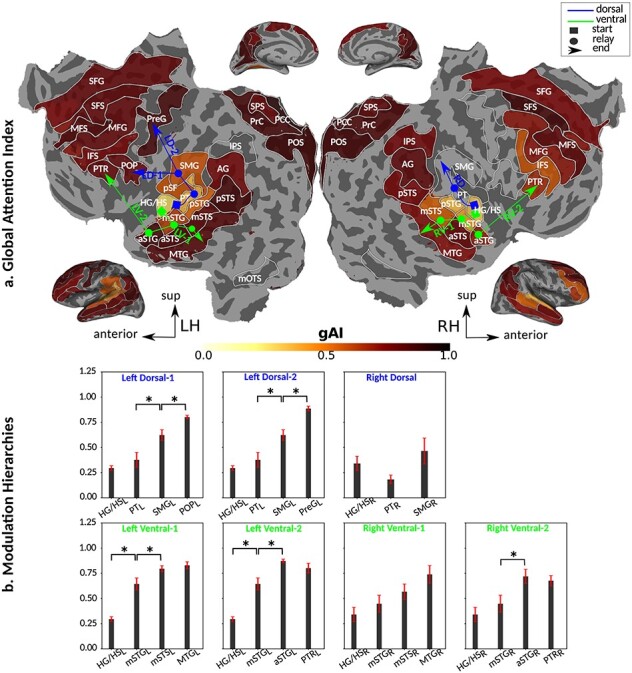
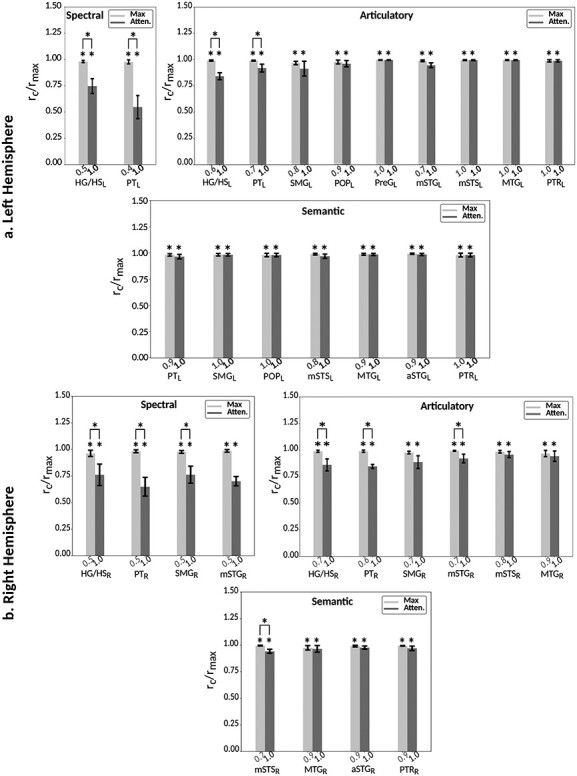
Humans are remarkably adept in listening to a desired speaker in a crowded environment, while filtering out nontarget speakers in the background. Attention is key to solving this difficult cocktail-party task, yet a detailed characterization of attentional effects on speech representations is lacking. It remains unclear across what levels of speech features and how much attentional modulation occurs in each brain area during the cocktail-party task. To address these questions, we recorded whole-brain blood-oxygen-level-dependent (BOLD) responses while subjects either passively listened to single-speaker stories, or selectively attended to a male or a female speaker in temporally overlaid stories in separate experiments. Spectral, articulatory, and semantic models of the natural stories were constructed. Intrinsic selectivity profiles were identified via voxelwise models fit to passive listening responses. Attentional modulations were then quantified based on model predictions for attended and unattended stories in the cocktail-party task. We find that attention causes broad modulations at multiple levels of speech representations while growing stronger toward later stages of processing, and that unattended speech is represented up to the semantic level in parabelt auditory cortex. These results provide insights on attentional mechanisms that underlie the ability to selectively listen to a desired speaker in noisy multispeaker environments.

Keywords: cocktail-party; dorsal and ventral stream; encoding model; fMRI; natural speech.


Figures

Figure 1
Figure 1
Experimental design. (a) “Passive-listening experiment.” 10 stories from Moth Radio Hour were used to compile a single-speaker stimulus set. Subjects were instructed to listen to the stimulus vigilantly without any explicit task in the passive-listening experiment. (b) “Cocktail-party experiment.” A pair of stories told by individuals of different genders were selected from the single-speaker stimulus set and overlaid temporally to generate a 2-speaker stimulus set. Subjects were instructed to attend either to the male or female speaker in the cocktail-party experiment. The same 2-speaker story was presented twice in separate runs while the target speaker was varied. Attention condition was fixed within runs and it alternated across runs.
Figure 2
Figure 2
Multilevel speech features. Three distinct feature spaces were constructed to represent natural speech at multiple levels: spectral, articulatory, and semantic spaces. Speech waveforms were projected separately on these spaces to form stimulus matrices. The spectral feature matrix captured the cochleogram features of the stimulus in 93 channels having center frequencies between 115 and 9920 Hz. The articulatory feature matrix captured the mapping of each phoneme in the stimulus to 22 binary articulation features. The semantic feature matrix captured the statistical co-occurrences of each word in the stimulus with 985 common words in English. Each feature matrix was Lanczos-filtered at a cutoff frequency of 0.25 Hz and downsampled to 0.5 Hz to match the sampling rate of fMRI. Natural speech might contain intrinsic stimulus correlations among spectral, articulatory, and semantic features. To prevent potential biases due to stimulus correlations, we decorrelated the 3 feature matrices examined here via Gram–Schmidt orthogonalization (see Materials and Methods). The decorrelated feature matrices were used for modeling BOLD responses.
Figure 3
Figure 3
Modeling procedures. (a) “Voxelwise modeling.” Voxelwise models were fit in individual subjects using passive-listening data. To account for hemodynamic response, a linearized 4-tap FIR filter spanning delayed effects at 2–8 s was used. Models were fit via L2-regularized linear regression. BOLD responses were predicted based on fit voxelwise models on held-out passive-listening data. Prediction scores were taken as the Pearson’s correlation between predicted and measured BOLD responses. For a given subject, speech-selective voxels were taken as the union of voxels significantly predicted by spectral, articulatory, or semantic models (q(FDR) < 10−5, t-test). (b) “Assessment of attentional modulation.” Passive-listening models for single voxels were tested on cocktail-party data to quantify attentional modulations in selectivity. In a given run, one of the speakers in a 2-speaker story was attended while the other speaker was ignored. Separate response predictions were obtained using the isolated story stimuli for the attended speaker and for the unattended speaker. Since a voxel can represent information from both attended and unattended stimuli, a linear combination of these predicted responses was considered with varying combination weights (wc in [0 1]). BOLD responses were predicted based on each combination weight separately. Three separate prediction scores were calculated based on only the attended stimulus (wc = 1), based on only the unattended stimulus (wc = 0), and based on the optimal combination of the 2 stimuli. A model-specific attention index, (formula image) was then computed as the ratio of the difference in prediction scores for attended versus unattended stories to the prediction score for their optimal combination (see Materials and Methods).
Figure 4
Figure 4
Selectivity for multilevel speech features. (a) “Model-specific selectivity indices.” Single-voxel prediction scores on passive-listening data were used to quantify the selectivity of each ROI to underlying model features. Model-specific prediction scores were averaged across speech-selective voxels within each ROI and normalized such that the cumulative score from all models was 1. The resultant measure was taken as a model-specific selectivity index, (formula image). formula image is in the range of [0, 1], where higher values indicate stronger selectivity for the underlying model. Bar plots display formula image for spectral, articulatory, and semantic models (mean ± standard error of mean (SEM) across subjects). Significant indices are marked with * (P < 0.05; see Supplementary Fig. 3ae for selectivity indices of individual subjects). ROIs in perisylvian cortex are displayed (see Supplementary Fig. 2 for nonperisylvian ROIs; see Materials and Methods for ROI abbreviations). ROIs in LH and RH are shown in the top and bottom panels, respectively. POPR and PreGR that did not have consistent speech selectivity in individual subjects were excluded (see Materials and Methods). (b) “Intrinsic selectivity profiles.” Selectivity profiles of cortical ROIs averaged across subjects are shown on the cortical flatmap of a representative subject (S4). Significant articulatory, semantic, and spectral selectivity indices of each ROI are projected to the red, green, and blue channels of the RGB colormap (see Materials and Methods). This analysis only included ROIs with consistent selectivity for speech features in each individual subject. Medial and lateral views of the inflated hemispheres are also shown. A progression from low–intermediate to high-level speech representations are apparent across bilateral temporal cortex in the superior–inferior direction; consistently in all subjects (see Supplementary Fig. 4 for selectivity profiles of individual subjects). Meanwhile, semantic selectivity is dominant in many higher-order regions within the parietal and frontal cortices (bilateral AG, IPS, SPS, PrC, PCC, POS, PTR, IFS, SFS, SFG, MFG, and left POP) (P < 0.05; see Supplementary Fig. 3ae). These results support the view that speech representations are hierarchically organized across cortex with partial overlap between spectral, articulatory, and semantic representations in early to intermediate stages of auditory processing.
Figure 5
Figure 5
Predicting cocktail-party responses. Passive-listening models were tested during the cocktail-party task by predicting BOLD responses in the cocktail-party data. Since a voxel might represent information from both attended and unattended stimuli, response predictions were expressed as a convex combination of individual predictions for the attended and unattended story within each 2-speaker story. Prediction scores were computed as the combination weights (formula image) were varied in [0 1] (see Materials and Methods). Prediction scores for a given model were averaged across speech-selective voxels within each ROI (formula image). The normalized scores of spectral, articulatory, and semantic models are displayed in several representative ROIs (HG/HS, HG/HS, and PT). Solid and dashed lines indicate mean and 95% confidence intervals across subjects. Scores based on only the attended story (formula image), based on only the unattended story (formula image), and based on the optimal combination of the two (formula image) are marked with circles. For the “spectral model” in left HG/HS, formula image is larger than formula image (P < 10−4); and the optimal combination equally weighs attended and unattended stories. For the “articulatory model” in left HG/HS, formula image is larger than formula image (P < 10−4), whereas formula image is greater than formula image (P < 10−2). Besides, the optimal combination puts slightly higher weight to attended story than unattended story. For the “semantic model” in left PT, formula image is much higher than formula image (P < 10−4), and the optimal combination puts much greater weight to attended story than unattended one. These representative results imply that attention may have divergent effects at various levels of speech representations across cortex.
Figure 6
Figure 6
Attentional modulation of multilevel speech representations. (a) “Model-specific attention indices.” A model-specific attention index (formula image) was computed based on the difference in model prediction scores when the stories were attended versus unattended (see Materials and Methods). formula image is in the range of [−1,1], where a positive index indicates modulation in favor of the attended stimulus and a negative index indicates modulation in favor of the unattended stimulus. For each ROI in perisylvian cortex, spectral, articulatory, and semantic attention indices are given (mean ± SEM across subjects), and their sum yields the overall modulation (see Supplementary Fig. 7 for nonperisylvian ROIs). Significantly positive indices are marked with * (P < 0.05, bootstrap test; see Supplementary Fig. 8ae for attention indices of individual subjects). ROIs in the LH and RH are shown in top and bottom panels, respectively. These results show that selectivity modulations distribute broadly across cortex at the linguistic level (articulatory and semantic). (b) “Attentional modulation profiles.” Modulation profiles averaged across subjects are displayed on the flattened cortical surface of a representative subject (S4). Significantly positive articulatory, semantic, and spectral attention indices are projected onto the red, green and blue channels of the colormap (see Materials and Methods). A progression in the level of speech representations dominantly modulated is apparent from HG/HS to MTG across bilateral temporal cortex (see Supplementary Fig. 9 for modulation profiles of individual subjects). Articulatory modulation is dominant in one end of the dorsal stream (left PreG), whereas semantic modulation becomes dominant in both ends of the ventral stream (bilateral PTR and MTG) (P < 0.05; see Supplementary Figs. 8ae and 9). On the other hand, semantic modulation is dominant in most of the higher-order regions in the parietal and frontal cortices consistently in all subjects (bilateral AG, SPS, PrC, PCC, POS, SFG, SFS, and PTR; left MFG; and right IPS) (P < 0.05; see Supplementary Fig. 8ae).
Figure 7
Figure 7
Global attentional modulation. (a) “Global attention index.” To quantify overall modulatory effects on selectivity across all examined feature levels, global attentional modulation (formula image) was computed by summing spectral, articulatory, and semantic attention indices (see Materials and Methods). formula image is in the range of [−1,1] and a value of zero indicates no modulation. Colors indicate significantly positive formula image averaged across subjects (see legend; see Supplementary Fig. 10 for bar plots of formula image across cortex). Dorsal and ventral pathways are shown with blue and green lines, respectively: left dorsal-1 (LD-1), left dorsal-2 (LD-2) and right dorsal (RD), left ventral-1 (LV-1), left ventral-2 (LV-2), right ventral-1 (RV-1) and right ventral-2 (RV-2). Squares mark regions where pathways begin; arrows mark regions where pathways end; and circles mark relay regions in between. (b) “Modulation hierarchies.” Bar plots display formula image (mean ± SEM across subjects) along LD-1, LD-2, RD, LV-1, LV-2, RV-1 and RV-2, shown in separate panels. Significant differences in formula image between consecutive ROIs are marked with brackets (P < 0.05, bootstrap test; see Supplementary Fig. 11 for single-subject results). Significant gradients in formula image are formula image in LD-1, formula image in LD-2, formula image in LV-1, formula image in LV-2, and formula image in RV-2. In the LH, formula image gradually increases from early auditory regions to higher-order regions across the dorsal and ventral pathways. Similar patterns are also observed in the right hemisphere, although the gradients in formula image are less consistent across subjects.
Figure 8
Figure 8
Representation of unattended speech. Passive-listening models were tested on cocktail-party data to assess representation of unattended speech during the cocktail-party task. Prediction scores were calculated separately for a combination model comprising features of both attended and unattended stories (formula image: optimal convex combination) and an individual model only comprising features of the attended story (formula image). Significant difference in prediction between the 2 models is an indication that BOLD responses carry significant information on unattended speech. Bar plots display normalized prediction scores (mean ± SEM across subjects; combination model in light gray and individual model in gray). Significant scores are marked with * (P < 10−4, bootstrap test; see Supplementary Fig. 12ae for single-subject results), and significant differences are marked with brackets (P < 0.05). Prediction scores are displayed for ROIs in the dorsal and ventral streams, with significant selectivity for given model features. (a) “LH.” “Spectral representations” of unattended speech extend up to PT across the dorsal stream (formula image) and are constrained to HG/HS across the ventral stream (formula image and formula image). “Articulatory representations” of unattended speech extend up to PT across the dorsal stream and are constrained to HG/HS across the ventral stream. No “significant semantic representation” is apparent. (b) Right hemisphere.” “Spectral representations” of unattended speech extend up to SMG across the dorsal stream and are constrained to HG/HS across the ventral stream. “Articulatory representations” of unattended speech extend up to PT across the dorsal stream, and up to mSTG across the ventral stream. “Semantic representations” are found only in mSTS. These results suggest that processing of unattended speech is not constrained at spectral level but extends to articulatory and semantic level.

References

    1. Alho K, Medvedev SV, Pakhomov SV, Roudas MS, Tervaniemi M, Reinikainen K, Zeffirio T, Näätänen R. 1999. Selective tuning of the left and right auditory cortices during spatially directed attention. Cogn Brain Res. 7:335–341. - PubMed
    1. Alho K, Vorobyev VA, Medvedev SV, Pakhomov SV, Roudas MS, Tervaniemi M, Näätänen R. 2003. Hemispheric lateralization of cerebral blood-flow changes during selective listening to dichotically presented continuous speech. Cogn Brain Res. 17:201–211. - PubMed
    1. Alho K, Vorobyev VA, Medvedev SV, Pakhomov SV, Starchenko MG, Tervaniemi M, Näätänen R. 2006. Selective attention to human voice enhances brain activity bilaterally in the superior temporal sulcus. Brain Res. 1075:142–150. - PubMed
    1. Alho K, Rinne T, Herron TJ, Woods DL. 2014. Stimulus-dependent activations and attention-related modulations in the auditory cortex: a meta-analysis of fMRI studies. Hear Res. 307:29–41. - PubMed
    1. Benjamini Y, Hochberg Y. 1995. Controlling the false discovery rate: a practical and powerful approach to multiple testing. J R Statist Soc. 57:289–300.

Publication types