

Pulmonary function with expiratory resistive loading in healthy volunteers
- PMID: 34115812
- PMCID: PMC8195373
- DOI: 10.1371/journal.pone.0252916
Pulmonary function with expiratory resistive loading in healthy volunteers
Abstract
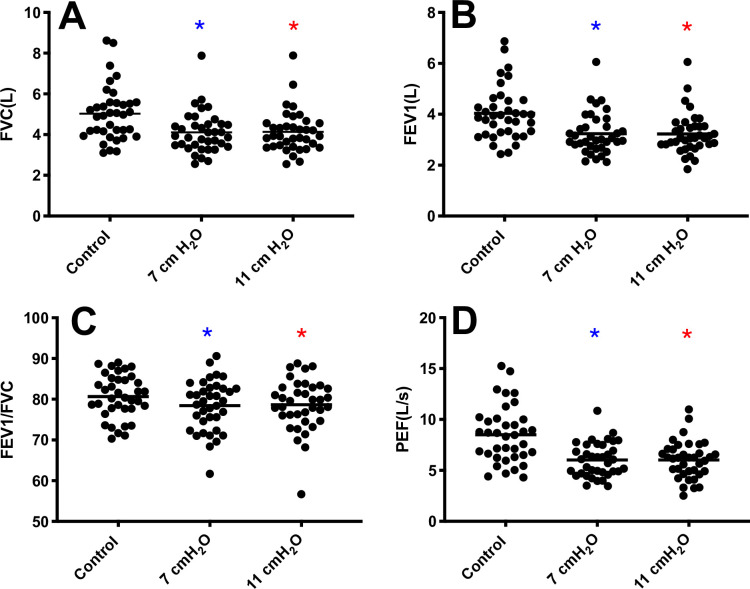
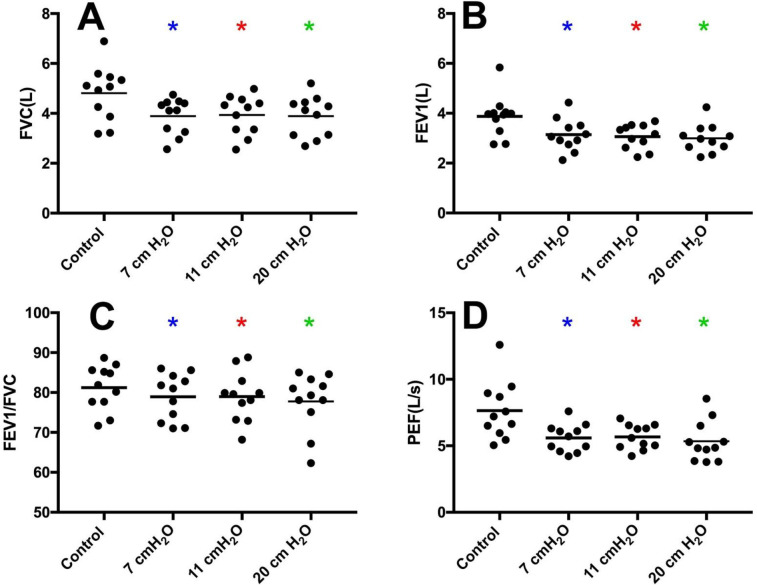
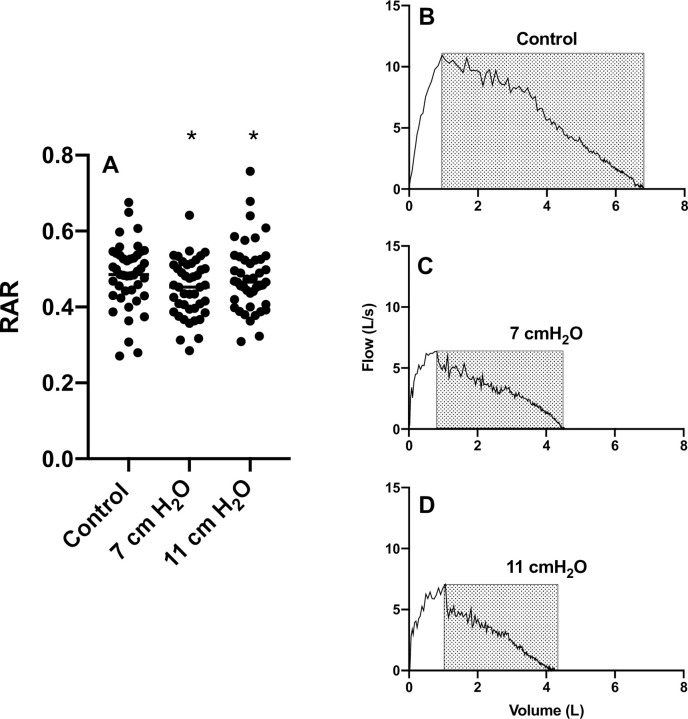
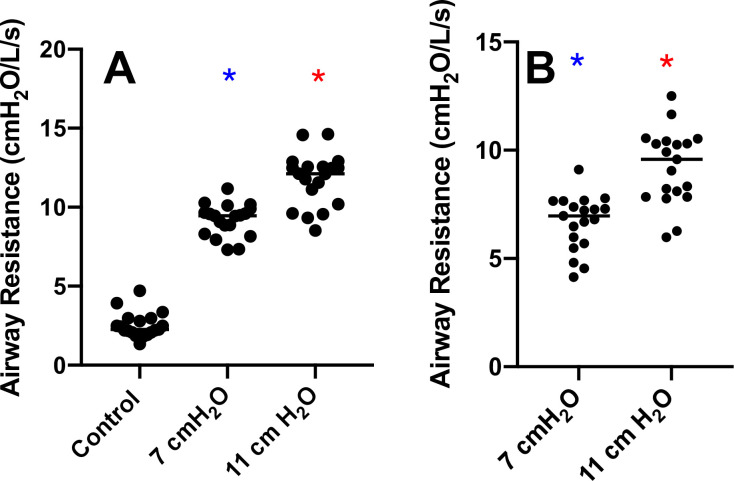
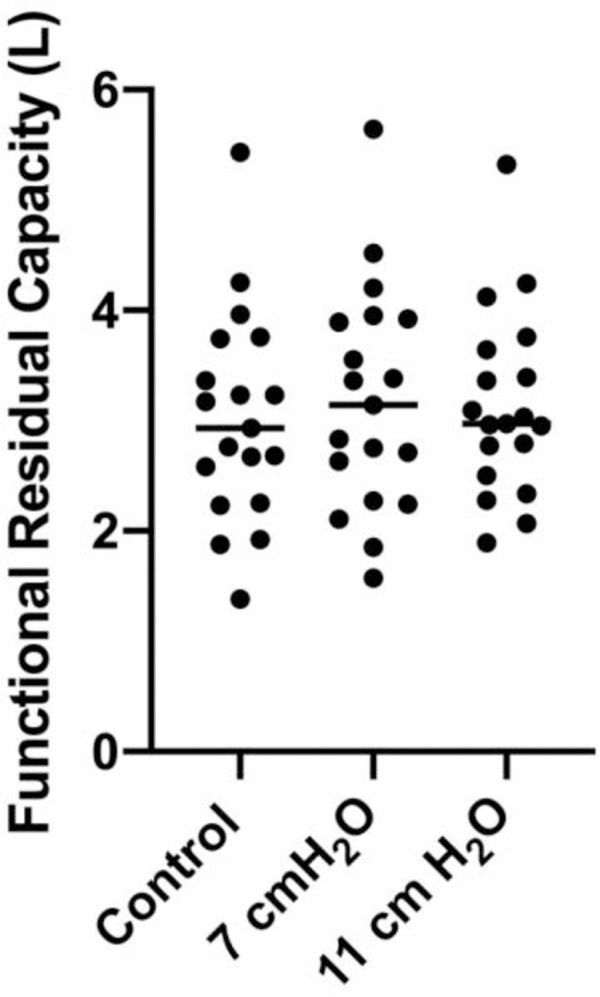
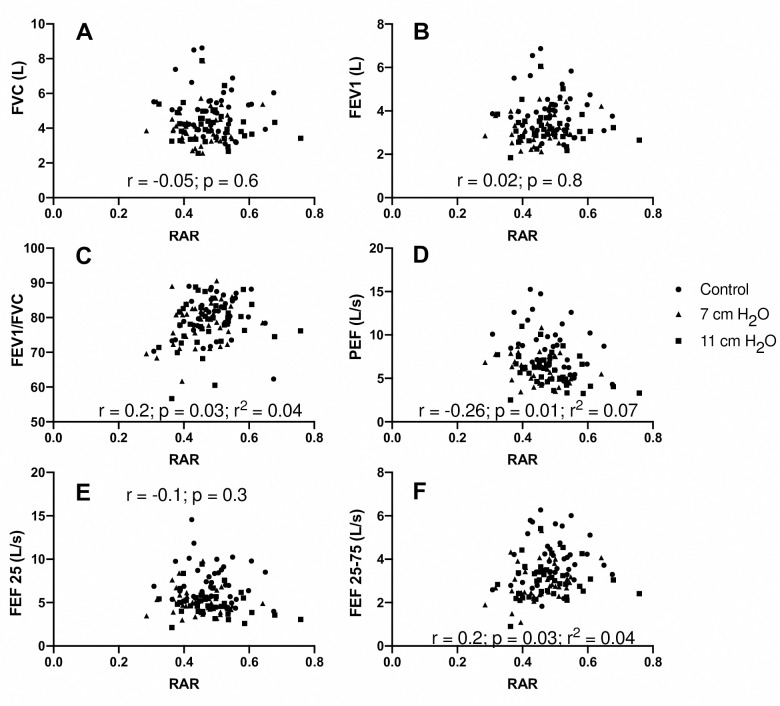
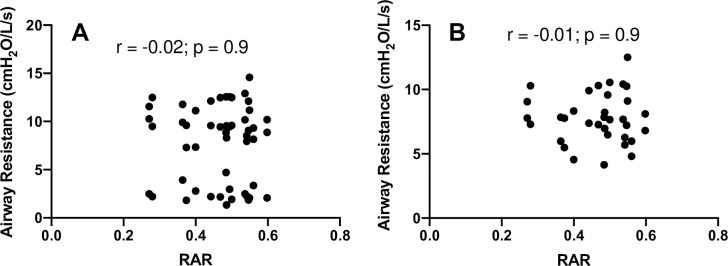
Expiratory flow limitation is a key characteristic in obstructive pulmonary diseases. To study abnormal lung mechanics isolated from heterogeneities of obstructive disease, we measured pulmonary function in healthy adults with expiratory loading. Thirty-seven volunteers (25±5 yr) completed spirometry and body plethysmography under control and threshold expiratory loading of 7, 11 cmH2O, and a subset at 20 cmH2O (n = 11). We analyzed the shape of the flow-volume relationship with rectangular area ratio (RAR; Ma et al., Respir Med 2010). Airway resistance was increased (p<0.0001) with 7 and 11 cmH2O loading vs control (9.20±1.02 and 11.76±1.68 vs. 2.53± 0.80 cmH2O/L/s). RAR was reduced (p = 0.0319) in loading vs control (0.45±0.07 and 0.47±0.09L vs. 0.48±0.08). FEV1 was reduced (p<0.0001) in loading vs control (3.24±0.81 and 3.23±0.80 vs. 4.04±1.05 L). FVC was reduced (p<0.0001) in loading vs control (4.11±1.01 and 4.14±1.03 vs. 5.03±1.34 L). Peak expiratory flow (PEF) was reduced (p<0.0001) in loading vs control (6.03±1.67 and 6.02±1.84 vs. 8.50±2.81 L/s). FEV1/FVC (p<0.0068) was not clinically significant and FRC (p = 0.4) was not different in loading vs control. Supra-physiologic loading at 20 cmH2O did not result in further limitation. Expiratory loading reduced FEV1, FVC, PEF, but there were no clinically meaningful differences in FEV1/FVC, FRC, or RAR. Imposed expiratory loading likely leads to high airway pressures that resist dynamic airway compression. Thus, a concave expiratory flow-volume relationship was consistently absent-a key limitation for model comparison with pulmonary function in COPD. Threshold loading may be a useful strategy to increase work of breathing or induce dynamic hyperinflation.
Conflict of interest statement
The authors have declared that no competing interests exist.
Figures
Similar articles
-
A model-based quantification of nonlinear expiratory resistance in Plethysmographic data of COPD patients.Comput Methods Programs Biomed. 2025 Mar;260:108520. doi: 10.1016/j.cmpb.2024.108520. Epub 2024 Nov 30. Comput Methods Programs Biomed. 2025. PMID: 39644782
-
The Concave Shape of the Forced Expiratory Flow-Volume Curve in 3 Seconds Is a Practical Surrogate of FEV1/FVC for the Diagnosis of Airway Limitation in Inadequate Spirometry.Respir Care. 2017 Mar;62(3):363-369. doi: 10.4187/respcare.05016. Epub 2016 Dec 20. Respir Care. 2017. PMID: 27999150
-
An identifiable model of lung mechanics to diagnose and monitor COPD.Comput Biol Med. 2023 Jan;152:106430. doi: 10.1016/j.compbiomed.2022.106430. Epub 2022 Dec 16. Comput Biol Med. 2023. PMID: 36543001
-
What does airway resistance tell us about lung function?Respir Care. 2012 Jan;57(1):85-96; discussion 96-9. doi: 10.4187/respcare.01411. Respir Care. 2012. PMID: 22222128 Review.
-
[Spirometry and other pulmonary function tests for the screening and evaluation of patients with chronic obstructive pulmonary disease (COPD)].Nihon Rinsho. 2007 Apr;65(4):664-9. Nihon Rinsho. 2007. PMID: 17419385 Review. Japanese.
References
MeSH terms
LinkOut - more resources
Full Text Sources
