. 2021 Oct 28;138(17):1603-1614.
doi: 10.1182/blood.2019004638.

Dual role of EZH2 in megakaryocyte differentiation

Affiliations

Dual role of EZH2 in megakaryocyte differentiation

Stefania Mazzi et al. Blood. .

Abstract

EZH2, the enzymatic component of PRC2, has been identified as a key factor in hematopoiesis. EZH2 loss-of-function mutations have been found in myeloproliferative neoplasms, particularly in myelofibrosis, but the precise function of EZH2 in megakaryopoiesis is not fully delineated. Here, we show that EZH2 inhibition by small molecules and short hairpin RNA induces megakaryocyte (MK) commitment by accelerating lineage marker acquisition without change in proliferation. Later in differentiation, EZH2 inhibition blocks proliferation and polyploidization and decreases proplatelet formation. EZH2 inhibitors similarly reduce MK polyploidization and proplatelet formation in vitro and platelet levels in vivo in a JAK2V617F background. In transcriptome profiling, the defect in proplatelet formation was associated with an aberrant actin cytoskeleton regulation pathway, whereas polyploidization was associated with an inhibition of expression of genes involved in DNA replication and repair and an upregulation of cyclin-dependent kinase inhibitors, particularly CDKN1A and CDKN2D. The knockdown of CDKN1A and to a lesser extent CDKN2D could partially rescue the percentage of polyploid MKs. Moreover, H3K27me3 and EZH2 chromatin immunoprecipitation assays revealed that CDKN1A is a direct EZH2 target and CDKN2D expression is not directly regulated by EZH2, suggesting that EZH2 controls MK polyploidization directly through CDKN1A and indirectly through CDKN2D.


Figures

None
Graphical abstract
Figure 1.
Figure 1.
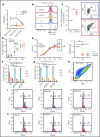
PRC2 expression and H3K27me3 during megakaryopoiesis. (A) Gene expression of EZH1 and EZH2 during MK differentiation (n = 3). Data were compared using a t test with Mann-Whitney correction and are shown as mean ± SEM. *P < .05. (B) Protein expression of EZH1 and EZH2 at different days of MK differentiation (i). Actin was used as loading control. Quantification of EZH1 and EZH2 relative to actin using ImageJ software (ii). (C) Three different cell populations (CD41+CD42+, n = 4; CD41+CD42, n = 5; and CD41CD42, n = 4) were sorted at day 9 of culture (top). Microrarrays were performed on each population. Heatmaps showing gene expression of PRC2 components in each population (n = 4) (bottom). (D) H3K27me3 mean fluorescence intensity relative to immunoglobulin G control for each MK population at day 9 of culture (n = 5) (left). Flow cytometry histograms representative of one experiment (right). Data were compared using a Student t test with Mann-Whitney correction. D, day; MFI , mean fluorescence intensity; PPIA, peptidyl-prolyl cis-trans isomerase. All data represent means ± SEM. *P < .05; **P < .005.
Figure 2.
Figure 2.
Inhibition of EZH2 accelerates acquisition of the MK surface markers, blocks MK proliferation at later stages, and decreases the mean ploidy of MKs. (A) H3K27me3 mean fluorescence intensity relative to immunoglobulin G control in different MK populations in the presence of GSK343 or GSK126 (n = 5). Data were compared using a Kruskal-Wallis test. (B) Representative flow cytometry plots of a violet dye experiment at day 4 of culture. Blue, dimethyl sulfoxide control (CTL); orange, GSK126; red, GSK343. The number of mitoses is indicated at the top of the figure. (C) Fold increase in the percentage of CD41+CD42+ cells in presence of EZH2 inhibitors. One representative experiment out of 3 experiments of flow cytometry analysis is shown. (D) Percentages of CD41+CD42+ cells at different days of culture. Data were compared using a Student t test with Mann-Whitney correction. CTL, n = 8; GSK126, n = 4; and GSK343, n = 8. (E) Proliferation curve of cord blood cells cultured in presence of TPO, SCF, and GSK343 or GSK126 or dimethyl sulfoxide (CTL) (n = 3) (left). Proliferation of GSK126- and GSK343-treated cells relative to the control at day 12 (right). Data were compared using 1-way analysis of variance with multiple comparison correction. All data represent means ± SEM. *P < .05. Ploidy of MKs treated with inhibitors (n = 5) (F) and transduced by 2 different shRNAs (n = 4) (G). Data were compared using a Student t test with Mann-Whitney correction. (H) Ploidy analyzed in a CD41highCD42high cell population. Flow cytometry of 1 representative experiment for MKs treated with inhibitors (i) and MKs transduced with 2 different shRNAs (ii). All data represent means ± SEM. *P < .05; **P < .005.
Figure 3.
Figure 3.
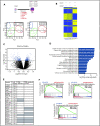
EZH2 inhibition alters cell-cycle regulation in mature MKs. (A) Schematic diagram representing microarray analysis performed at day 9 of culture in presence of 2 different shEZH2 and GSK343 inhibitor (i). Principal-component (PC) analysis of microarrays performed at day 9 of culture (ii). Circles indicate the different cell populations; CD41+CD42+ cells are grouped in the red circle, CD41+CD42 cells are grouped in the green circle; and CD41CD42 cells are grouped in the blue circle. (B) Heatmap showing genes up- or downregulated during MK differentiation. CD41CD42, CD41CD42+, and CD41+CD42+ cell populations are shown. Missing values are in gray. (C) Volcano plot showing differentially expressed genes in the CD41+CD42+ cell population in CTL vs treated cells. (D) GO terms (biological process) differentially expressed in control cells (untreated and treated with a shCTL vs GSK343 and shEZH2, respectively). Corrected P values were calculated using a modified Fisher’s exact test followed by Bonferroni’s multiple comparison test. (E) List of the most downregulated genes (fold change 1.5) in presence of EZH2 inhibition (GSK343 or shRNA). Gray squares indicate genes that belong to DNA replication pathway or DNA metabolic process according to MSigDB (Broad Institute). (F) GSEA of the CD41+CD42+ cells in presence of GSK343 and 2 shEZH2. FDR, false discovery rate; NES, normalized enrichment score.
Figure 4.
Figure 4.
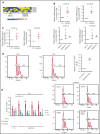
Inhibition of EZH2 alters MK polyploidization though CDKi regulation. (A) Heatmap showing differentially expressed CDKi’s in mature MKs (CD41+CD42+). (B) mRNA expression of CDKN2D (p19) and CDKN1A (p21) in cord blood–derived CD41+CD42+ cells in the presence of GSK343 (n = 5) and shEZH2 (n = 3 for shEZH2.1 and n = 2 for shEZH2.2). Data were compared using a Student t test with Mann-Whitney correction. (C) mRNA expression of CDKN2D (p19) and CDKN1A (p21) in leukapheresis-derived CD41+CD42+ cells in the presence of GSK343 (n = 3) at day 9 of culture. Data were compared using a Student t test with Mann-Whitney correction. (D-E) Ploidy analysis in CD41+CD42+ cells derived from leukapheresis CD34+ cells in the presence of GSK343 (n = 4) (D) and shCDKN1A, shCDKN2D, and shCDKN1A+shCDKN2D (n = 4) (E). Data were compared using a Student t test with Mann-Whitney correction. All data represent means ± SEM. *P < .05; **P < .005; ns, not significant.
Figure 5.
Figure 5.
ChIP-seq analyses in the presence of EZH2 inhibition during MK differentiation. (A) Peak distribution along the gene regions as indicated on the right side. (B) ChIP-seq profiles of the 3 histone marks (H3K4me3, H3K27me3, and H3K27ac) across CDKN1A (p21) (blue, control; red, GSK343 treated at day 12 of culture) are shown in the upper panel and ChIP-EZH2 qPCR in the lower panel. (C) ChIP-seq profiles of the 3 histone marks (H3K4me3, H3K27me3, and H3K27ac) across CDKN2D (p19) (blue, control; red, treated with GSK343 at day 12 of culture) are shown in the upper panel and ChIP-EZH2 qPCR in the lower panel. (B-C) In the lower panel, 1 representative ChIP experiment of 3 experiments is shown in duplicate on the left, and the statistical analysis of 3 independent ChIP experiments is shown on the right. Data were compared using a Student t test with Mann-Whitney correction. All data represent means ± SEM. *P < .05.
Figure 6.
Figure 6.
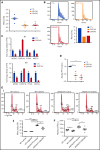
EZH2 inhibition alters proplatelet formation. (A) Proplatelet formation analysis in cells treated with GSK343 or shEZH2 on day 13 of culture. Means of 3 independent experiments are shown. Data were compared using a t test with Mann-Whitney correction. PPT, proplatelet. All data are shown as mean ± SEM. *P < .05. (B-C) Transcriptome analysis performed on CD41+CD42+ MKs cultured either in the presence GSK inhibitors (GSK126 or GSK343) or in their absence (CTL) and sorted on day 13 of culture. (B) Volcano plot showing differentially expressed genes in the CD41+CD42+ cell population in CTL vs treated cells (P < .001). (C) GO analysis of cellular component on the 59 genes common to both inhibitors. Corrected P values were calculated using a modified Fisher’s exact test (P < .001, fold change >2). (D) ChIP-seq profiles of the 3 histone marks (H3K4me3, H3K27me3, and H3K27ac) across FSCN1 on day 12 of MK culture (blue, control; red, GSK343 treated) are shown in the upper panel and ChIP-EZH2 qPCR in the lower panel. One representative ChIP-qPCR experiment of 3 experiments is shown in duplicate on the left, and the statistical analysis of 3 independent ChIP experiments is shown on the right. Data were compared using a Student t test with Mann-Whitney correction. All data represent means ± SEM. *P < .05. (E) Immunofluorescence staining of F-actin (green) and nucleus (blue) in control (CTL) and GSK126-treated MKs on day 13 of culture after adhesion on poly-L-lysine. Scale bars, 30 μm.
Figure 7.
Figure 7.
EZH2 inhibition alters differentiation of JAK2V617F MKs. (A-D) Effects of EZH2 inhibition on MK differentiation from JAK2 V617F CD34+ cells. (A) Decrease on day 9 of culture in the mean ploidy of JAK2 V617F MKs derived from patient CD34+ cells treated with 2 EZH2 inhibitors. Data were compared using a t test with Mann-Whitney correction. GSK126, n = 3; GSK343, n = 6. (B) Decrease on day 5 of culture of the mean ploidy of JAK2 V617F MKs derived from CD34+CD41+ cells from 1 patient with a JAK2 V617F variant allele frequency of ∼100%. (C) Gene expression analysis of CD41+CD42+ patient cells on day 10 of culture. Two patients were studied (#1, #2). Error bars represent duplicates of one experiment. (D) Proplatelet (PPT) formation analysis in cells treated with GSK343 or GSK126 inhibitors relative to nontreated samples (n = 3). Data were compared using a t test with Mann-Whitney correction. All data represent means ± SEM. *P < .05; **P < .01. (E-F) Effects of EZH2 inhibition on MK differentiation in vivo in the Jak2V617F context. (E) Representative histograms of ploidy level in mice engrafted with WT or Jak2V617 total bone marrow cells and treated with vehicle or GSK343 (i). Mean ploidy level ≥8N was calculated based on the percentage of MKs (ii). (F) Platelet count. (E-F) Data were compared using an unpaired Student t test. All data represent means ± SEM. ***P < .001; **P < .01; *P < .05.

References

    1. Margueron R, Reinberg D. The Polycomb complex PRC2 and its mark in life. Nature. 2011;469(7330):343-349. - PMC - PubMed
    1. Sauvageau M, Sauvageau G. Polycomb group proteins: multi-faceted regulators of somatic stem cells and cancer. Cell Stem Cell. 2010;7(3):299-313. - PMC - PubMed
    1. Ernst T, Chase AJ, Score J, et al. . Inactivating mutations of the histone methyltransferase gene EZH2 in myeloid disorders. Nat Genet. 2010;42 (8):722-726. - PubMed
    1. Morin RD, Johnson NA, Severson TM, et al. . Somatic mutations altering EZH2 (Tyr641) in follicular and diffuse large B-cell lymphomas of germinal-center origin. Nat Genet. 2010;42(2):181-185. - PMC - PubMed
    1. Chase A, Cross NC. Aberrations of EZH2 in cancer. Clin Cancer Res. 2011;17(9):2613-2618. - PubMed

Publication types

Substances