. 2021 Jul 13;54(7):1463-1477.e11.
doi: 10.1016/j.immuni.2021.05.004. Epub 2021 Jun 10.

Metformin inhibition of mitochondrial ATP and DNA synthesis abrogates NLRP3 inflammasome activation and pulmonary inflammation

Affiliations

Metformin inhibition of mitochondrial ATP and DNA synthesis abrogates NLRP3 inflammasome activation and pulmonary inflammation

Hongxu Xian et al. Immunity. .

Abstract

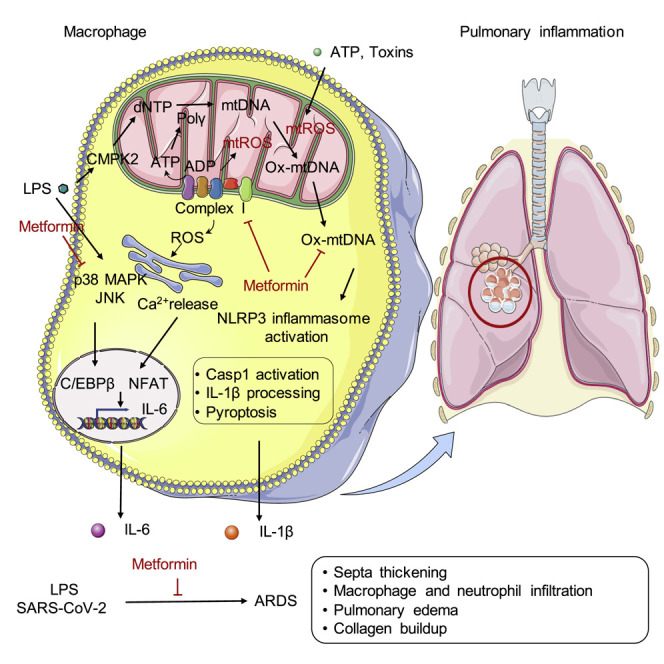
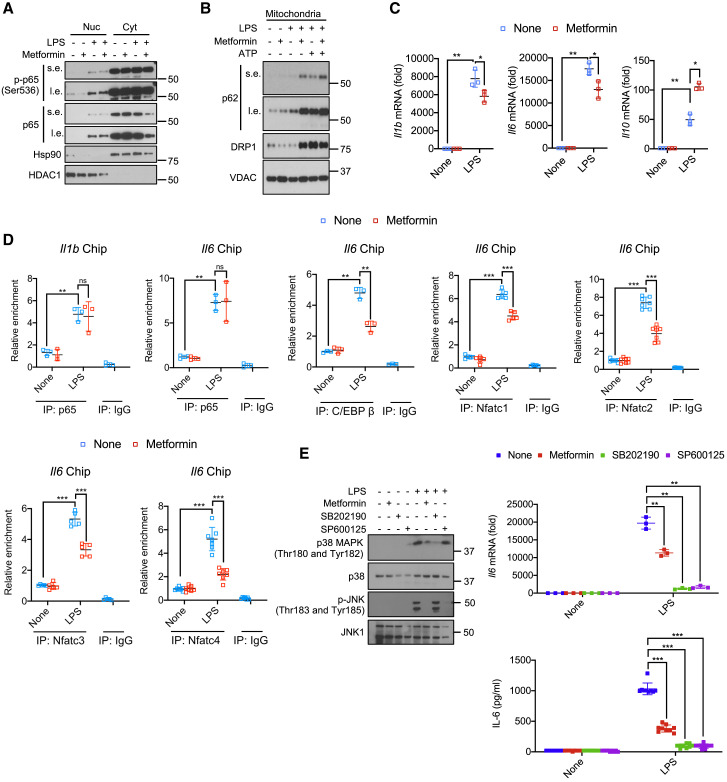
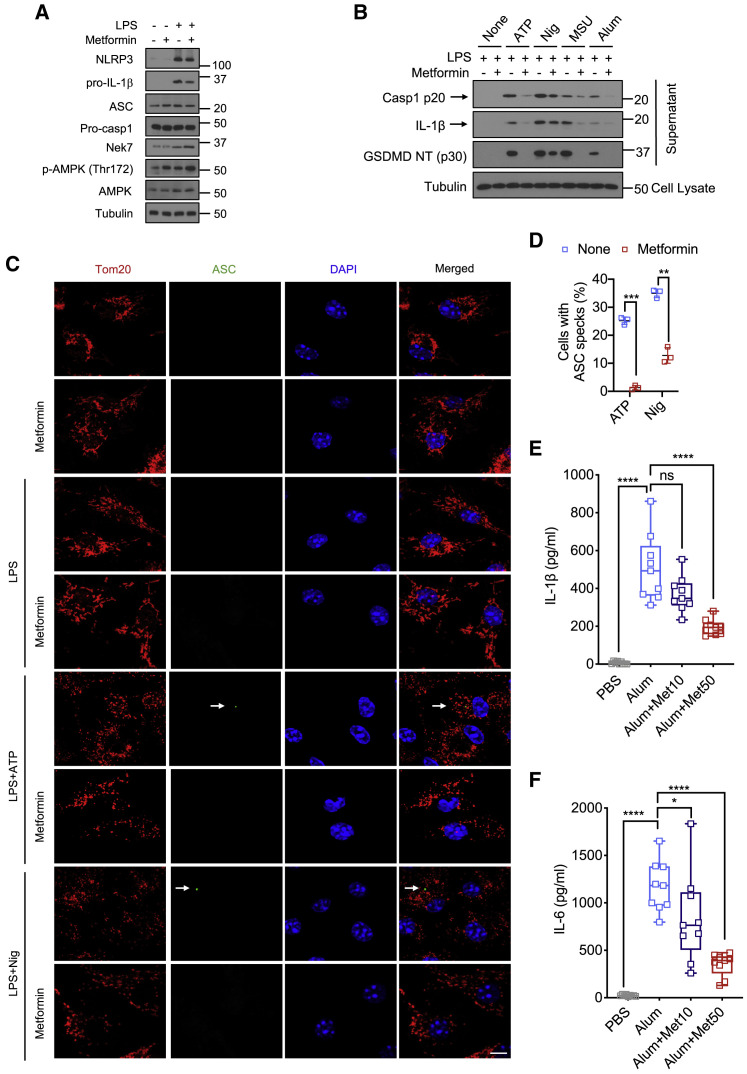
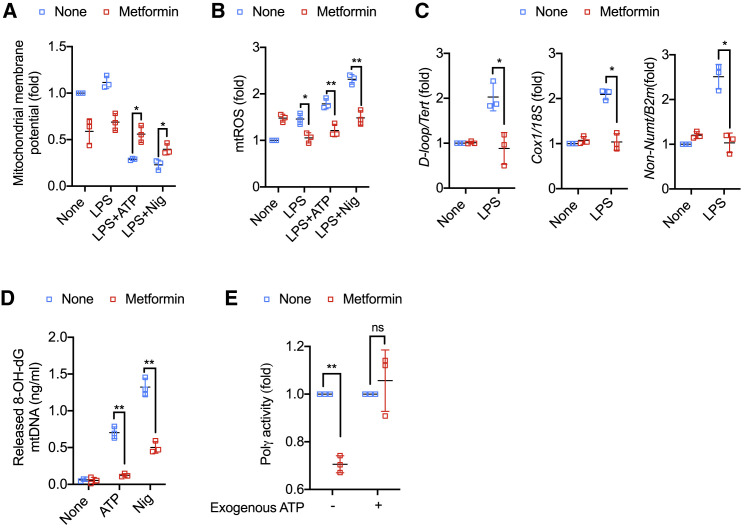
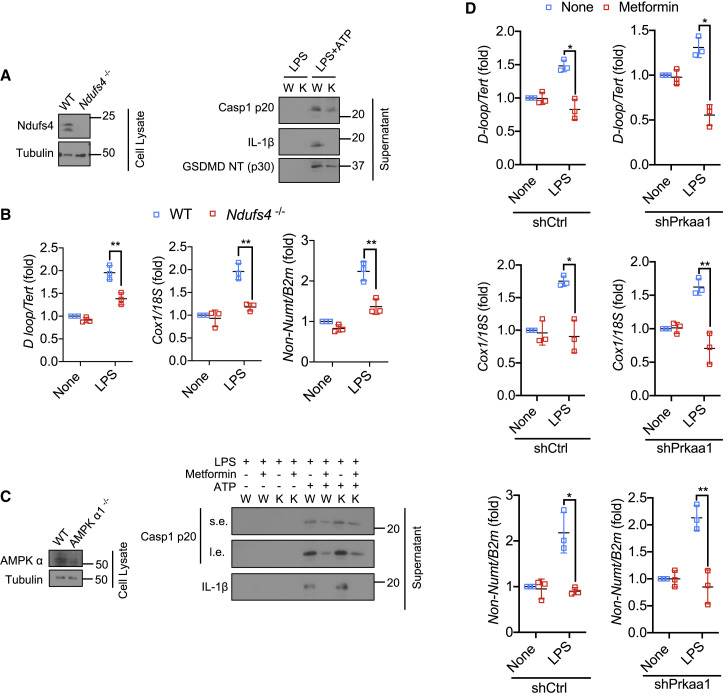
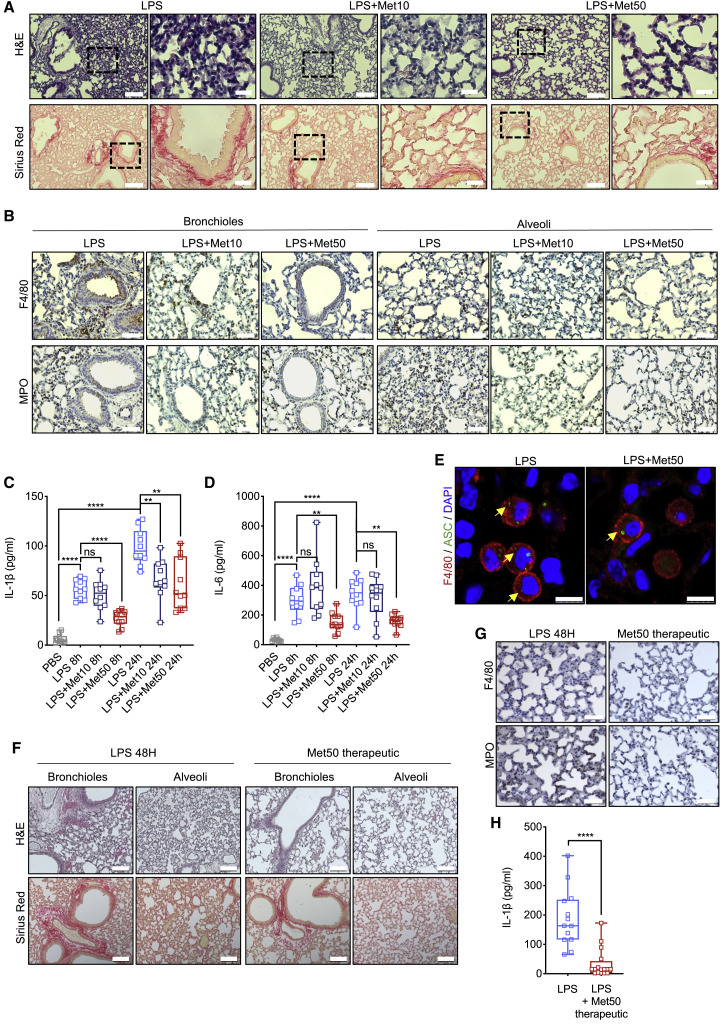
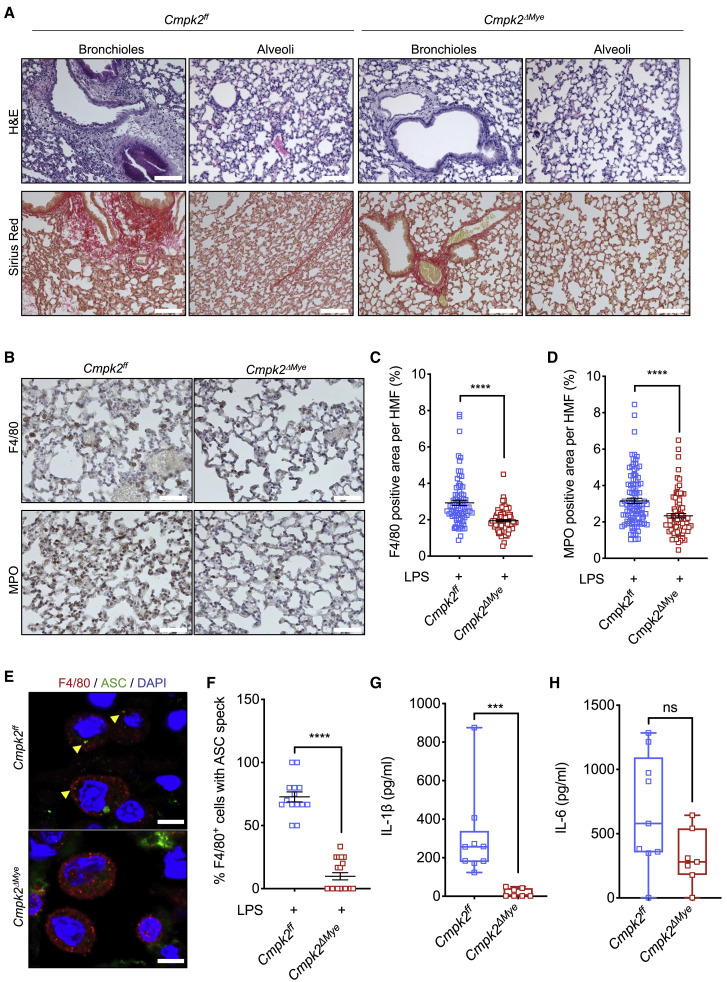
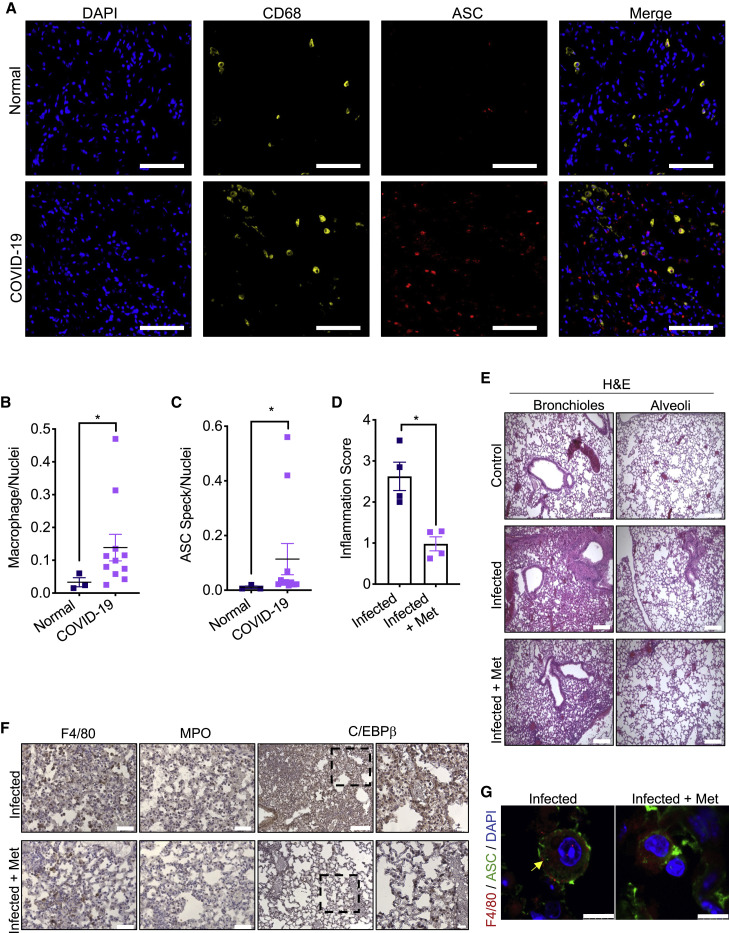
Acute respiratory distress syndrome (ARDS), an inflammatory condition with high mortality rates, is common in severe COVID-19, whose risk is reduced by metformin rather than other anti-diabetic medications. Detecting of inflammasome assembly in post-mortem COVID-19 lungs, we asked whether and how metformin inhibits inflammasome activation while exerting its anti-inflammatory effect. We show that metformin inhibited NLRP3 inflammasome activation and interleukin (IL)-1β production in cultured and alveolar macrophages along with inflammasome-independent IL-6 secretion, thus attenuating lipopolysaccharide (LPS)- and SARS-CoV-2-induced ARDS. By targeting electron transport chain complex 1 and independently of AMP-activated protein kinase (AMPK) or NF-κB, metformin blocked LPS-induced and ATP-dependent mitochondrial (mt) DNA synthesis and generation of oxidized mtDNA, an NLRP3 ligand. Myeloid-specific ablation of LPS-induced cytidine monophosphate kinase 2 (CMPK2), which is rate limiting for mtDNA synthesis, reduced ARDS severity without a direct effect on IL-6. Thus, inhibition of ATP and mtDNA synthesis is sufficient for ARDS amelioration.

Keywords: ARDS; CMPK2; COVID-19; IL-1β; IL-6; NLRP3 inflammasome; SARS-CoV-2; inflammation; metformin; mitochondrial DNA.


Conflict of interest statement

Declaration of interests M.K. is a founder of Elgia Pharmaceuticals and receives research support from Gossamer Bio, Jansen Pharmaceuticals and Merck. G.R.A.-M., G.L., and P.S. are employees of Jansen Pharmaceuticals. The University of California San Diego is in the process of applying for a patent covering the generation and use of novel anti-inflammatory therapy for ARDS listing H.X., E.S.-L., and M.K. as inventors. All other authors declare no competing interests.

Figures

None
Graphical abstract
Figure 1
Figure 1
Metformin attenuates Il1b and Il6 mRNA induction but does not inhibit NF-κB activation (A) BMDM pretreated -/+ metformin (0.5 mM, 16 h) were harvested 30 min after LPS (100 ng/mL) addition. Nuclear (Nuc) and cytosolic (Cyt) fractions were analyzed for the indicated proteins. s.e., short exposure; l.e., long exposure. One representative immunoblot (IB) out of 2. (B) IB analysis of p62, DRP1, and VDAC in mitochondria from BMDM pretreated -/+ metformin, primed with LPS, and challenged with ATP (4 mM, 1 h). (C) Q-PCR quantitation of Il1b, Il6 and Il10 mRNAs before or after LPS stimulation -/+ metformin pre-treatment (n = 3). (D) p65, C/EBPβ or NFATc1-4 recruitments to the Il1 and Il6 promoters in BMDM before or after LPS stimulation was analyzed by ChIP-qPCR assay (n = 3–7). (E) IB analysis of p38 MAPK and JNK phosphorylation (left) and quantitation of Il6 mRNA (top) and IL-6 secretion (bottom) from BMDM pretreated with metformin, SB202190 (10 μM) or SP600125 (40 μM) for 16 h and stimulated with LPS for 30 min. All IB show one representative out of 3. Results in (C–E) are averages ±SD. p < 0.05; ∗∗p < 0.01; ∗∗∗p < 0.001. Two-sided unpaired t test. See also Figure S1. Figure S1
Figure 2
Figure 2
Metformin inhibits NLRP3 inflammasome activation (A) IB analysis of NLRP3, pro-IL-1β, ASC, pro-caspase-1, NEK7, phosphorylated AMPK, and total AMPK in BMDM pre-treated -/+ metformin (0.5 mM, 16 h) before or after 4 h of LPS (100 ng/mL) stimulation. Tubulin shows loading control. (B) IB analysis of cleaved caspase-1 (Casp1 p20), mature IL-1β and cleaved GSDMD (GSDMD NT [p30]) in culture supernatants, and tubulin in lysates of BMDM that were pretreated -/+ metformin, primed with LPS, and challenged with inflammasome activators (Nig-nigericin, 10 μM, 1 h; MSU, 600 μg/mL, 6 h). (C) Representative fluorescent microscopy images of BMDM co-stained for Tom20 and ASC before or after LPS (100 ng/mL, 4 h) priming followed by ATP (4 mM, 1 h) or nigericin (10 μM, 1 h), -/+ metformin (0.5 mM, 16 h) pre-treatment. DAPI stains nuclei. Arrows indicate ASC specks. Scale bars, 10 μm (n = 3). (D) Percentages of cells shown in (C) with ASC specks. n = 150 cells per group from 3 independent experiments, magnification × 100. (E and F) Peritoneal IL-1β (E) and IL-6 (F) in mice treated with different doses of metformin (0, 10, and 50 mg/kg) 30 min prior to i.p. alum (700 mg) injection (n = 9 mice per group). All blots show one representative IB out of 3. Results in (D) are averages ± SD and in (E) averages ±SEM.p < 0.05; ∗∗p < 0.01; ∗∗∗p < 0.001; ∗∗∗∗p < 0.0001; ns, not significant. Two- sided unpaired t test. See also Figure S2.
Figure 3
Figure 3
Metformin inhibits mtDNA synthesis and cytosolic Ox-mtDNA release (A) Mitochondrial membrane potential of untreated and LPS (100 ng/mL, 4 h)-primed BMDM challenged with ATP (4 mM, 1 h) or nigericin (10 μM, 1 h), -/+ metformin (0.5 mM, 16 h) pretreatment, was measured by TMRM staining. (B) Relative mtROS amounts measured by MitoSOX staining of BMDM treated as above. (C) Relative total mtDNA amounts in LPS-primed BMDM -/+ metformin pre-treatment. Shown are the ratio of D-loop mtDNA to Tert nuclear (n) DNA, Cox1 mtDNA to 18S nDNA or mtDNA that is not inserted into nuclear DNA (non-NUMT) to B2m nDNA. (D) 8-OH-dG amounts in cytosolic mtDNA of LPS-primed BMDM stimulated with ATP or nigericin (Nig) -/+ metformin pre-treatment were measured by ELISA. (E) Lysates of LPS-primed BMDM -/+ metformin pretreatment, were divided into two aliquots. One aliquot was used to measure POLγ activity without exogenous ATP and the other was supplemented with 10 mM ATP prior to measuring POLγ activity. Results are averages ± SD (n = 3). p < 0.05; ∗∗p < 0.01; ns, not significant. Two-sided unpaired t test. See also Figure S3.
Figure 4
Figure 4
Metformin inhibits NLRP3 inflammasome activation via ETCCI, independently of AMPK (A) IB analysis of Ndufs4 (left), Casp1 p20, mature IL-1β, and cleaved GSDMD (right) in culture supernatants and cell lysates of LPS (100 ng/mL, 4 h)-primed wild type (W) or Ndufs4−/− (K) BMDM stimulated −/+ ATP (4 mM, 1 h). (B) Relative total mtDNA amounts in LPS (200 ng/mL, 4 h)-primed wild type (WT) or Ndufs4−/− BMDM. The ratio of D-loop mtDNA to Tert nDNA, Cox1 mtDNA to 18S nDNA, or mtDNA that is not inserted into nuclear DNA (non-NUMT) to B2m nDNA is shown. (C) IB analysis of AMPKα (left), Casp1 p20 and mature IL-1β (right) in culture supernatants and lysates of LPS-primed wild type (W) or Ampkα1−/− (K) BMDM stimulated -/+ ATP. (D) Relative total mtDNA amounts in LPS-primed shCtrl- and shPrkaa1-transfected BMDM. The ratio of D-loop mtDNA to Tert nDNA, Cox1 mtDNA to 18S nDNA, or mtDNA that is not inserted into nuclear DNA (non-NUMT) to B2m nDNA is shown. All IB show one representative out of 3. Results are averages ± SD (n = 3). p < 0.05; ∗∗p < 0.01. Two-sided unpaired t test. See also Figure S4.
Figure 5
Figure 5
Metformin inhibits LPS-induced ARDS (A) H&E and Sirius red staining of lung tissue from mice that were left untreated or pretreated with 10 or 50 mg/kg metformin and challenged with 5 mg/kg LPS 24 h prior tissue collection. Scale bar, 100 μm and 20 μm. n = 10 mice per group. 10–12 images per mouse were analyzed. (B) Lung sections from above mice were stained with F4/80 and MPO antibodies. Scale bar, 50 μm. n = 4 mice per group. 10–12 images per mouse were evaluated. (C and D) IL-1β (C) and IL-6 (D) concentrations in BALF from above mice were measured by ELISA. n = 10 mice per group. (E) F4/80 and ASC immunostaining of paraffin-embedded lung tissue from above mice. DAPI stains nuclei. Scale bar, 7.5 μm. n = 4 mice per group. (F) H&E and Sirius red staining of lung tissue from mice that were left untreated or treated with 50 mg/kg metformin daily starting 30 min after 5 mg/kg LPS challenge. Tissue was collected 48 h after LPS administration. Scale bar, 100 μm; n = 5 mice per group. 10–12 images per mouse were evaluated. (G) F4/80 and MPO staining in lung sections from mice in (F). Scale bar, 50 μm. n = 5 mice per group. 10–12 images per mouse were evaluated. (H) IL-1β concentration in BALF from mice in (F) were measured by ELISA. n = 5 mice per group. ∗∗p < 0.01; ∗∗∗∗p < 0.001; ns, not significant. Unpaired t test; Mann-Whitney test. See also Figure S5. Figure S5
Figure 6
Figure 6
Myeloid-specific Cmpk2 ablation recapitulates metformin protective effects in LPS-induced ARDS (A) H&E and Sirius red staining of lung tissue from Cmpk2ff and Cmpk2ΔMye mice challenged with 5 mg/kg LPS for 24 h. Scale bar, 100 μm. n = 7–9 mice per group. 10–12 images per mouse were evaluated. (B) F4/80 and MPO staining in lung sections from mice in (A). Scale bar, 50 μm. n = 5 mice per group. 10–12 images per mouse were evaluated. (C and D) Area (in %) occupied by F4/80 (C), and MPO (D) staining, in lung sections from (B). Averages ± SEM; n = 5 mice per group. 10–12 HMF per group evaluated. (E) F4/80 and ASC immunostaining of lung tissue from mice in (A). DAPI stains nuclei. Scale bar, 7.5 μm. n = 4–5 mice per group. (F) Percentage of F4/80+ cells with ASC specks in lung sections from mice in (E). Cells were quantified in 15 HMF from 4–5 mice per group. Averages ± SEM. (G and H) IL-1β (G) and IL-6 (H) concentrations in BALF from above mice were measured by ELISA. n = 7–9 mice per group. ∗∗∗p < 0.005; ∗∗∗∗p < 0.001; ns, not significant. Unpaired t test; Mann-Whitney test. See also Figure S6.
Figure 7
Figure 7
Metformin attenuates ARDS caused by SARS-CoV-2 infection (A) Representative images from healthy (n = 3) and COVID-19 post-mortem (n = 11) tissue stained for CD68 (yellow) and ASC (red) taken at 20x. (B and C) Quantification of macrophages (B) (CD68+) and cells with ASC specks (C) normalized to nuclei in above lung sections. p < 0.05. Unpaired t test; Mann-Whitney test. (D) Lung inflammation score in SARS-CoV-2-infected hACE2 Tg mice infected as indicated in STAR Methods. The scores were averaged and are shown as average ± SEM n = 4 mice. p < 0.05. All groups were compared to each other using ANOVA Kruskal-Wallis test. (E) H&E staining of lung tissue from hACE2 Tg mice treated as in (D). Scale bar, 200 μm. n = 4 mice per group. 10–12 images per mouse were evaluated. (F) Lung sections from mice in (E) were stained with F4/80, MPO and C/EBPβ antibodies. Scale bar, 100 μm for F4/80, MPO, and C/EBPβ, and 50 μm for highlighted areas. n = 4 mice per group. 10–12 images per mouse were evaluated. (G) F4/80 and ASC immunostaining in lungs from mice in (E). Nuclei were counterstained with DAPI and the images were captured by fluorescent confocal microscopy focusing on areas containing alveolar macrophages. Scale bar, 7.5 μm. n = 4 mice per group. All images are representative for each group. See also Figure S7.

References

    1. Akira S., Isshiki H., Sugita T., Tanabe O., Kinoshita S., Nishio Y., Nakajima T., Hirano T., Kishimoto T. A nuclear factor for IL-6 expression (NF-IL6) is a member of a C/EBP family. EMBO J. 1990;9:1897–1906. - PMC - PubMed
    1. Bankhead P., Loughrey M.B., Fernández J.A., Dombrowski Y., McArt D.G., Dunne P.D., McQuaid S., Gray R.T., Murray L.J., Coleman H.G., et al. QuPath: Open source software for digital pathology image analysis. Sci. Rep. 2017;7:16878. - PMC - PubMed
    1. Bao L., Deng W., Huang B., Gao H., Liu J., Ren L., Wei Q., Yu P., Xu Y., Qi F., et al. The pathogenicity of SARS-CoV-2 in hACE2 transgenic mice. Nature. 2020;583:830–833. - PubMed
    1. Barzilai N., Crandall J.P., Kritchevsky S.B., Espeland M.A. Metformin as a Tool to Target Aging. Cell Metab. 2016;23:1060–1065. - PMC - PubMed
    1. Boyle K.A., Van Wickle J., Hill R.B., Marchese A., Kalyanaraman B., Dwinell M.B. Mitochondria-targeted drugs stimulate mitophagy and abrogate colon cancer cell proliferation. J. Biol. Chem. 2018;293:14891–14904. - PMC - PubMed

Publication types

MeSH terms