. 2021 Jun 24;184(13):3559-3572.e22.
doi: 10.1016/j.cell.2021.05.010. Epub 2021 Jun 10.

Microscopic examination of spatial transcriptome using Seq-Scope

Affiliations

Microscopic examination of spatial transcriptome using Seq-Scope

Chun-Seok Cho et al. Cell. .

Abstract

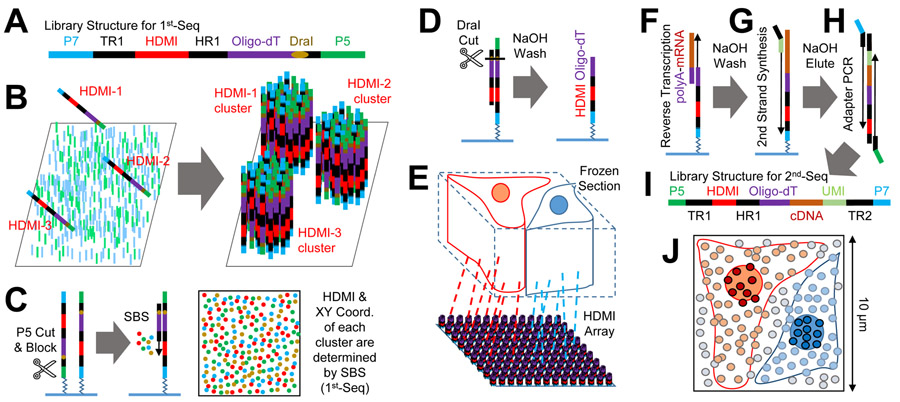
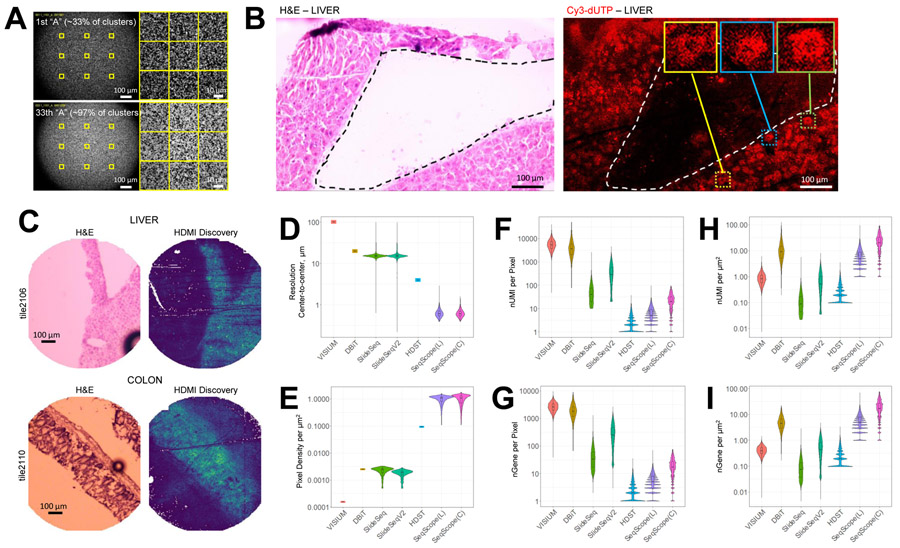
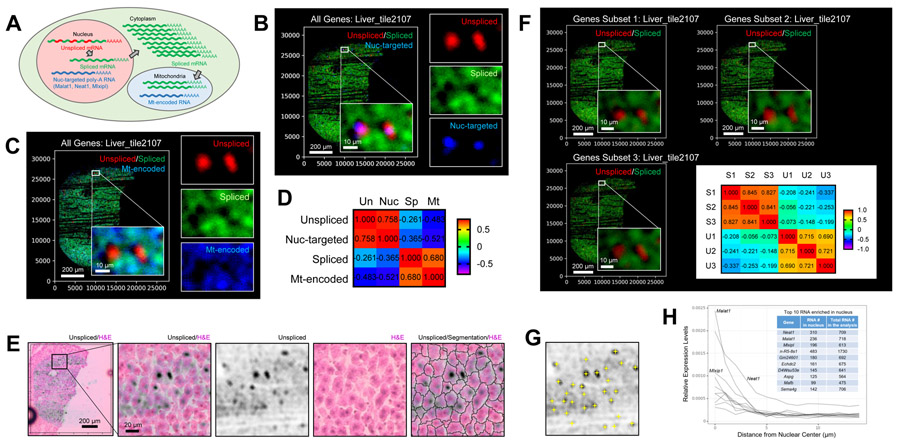
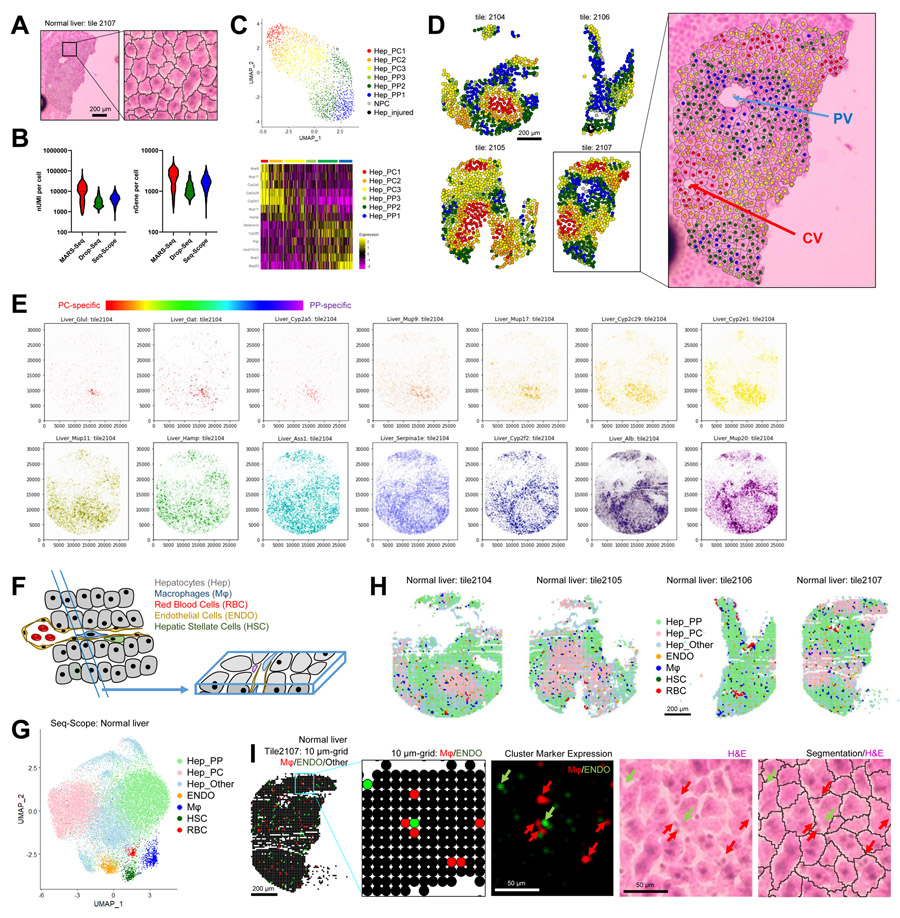
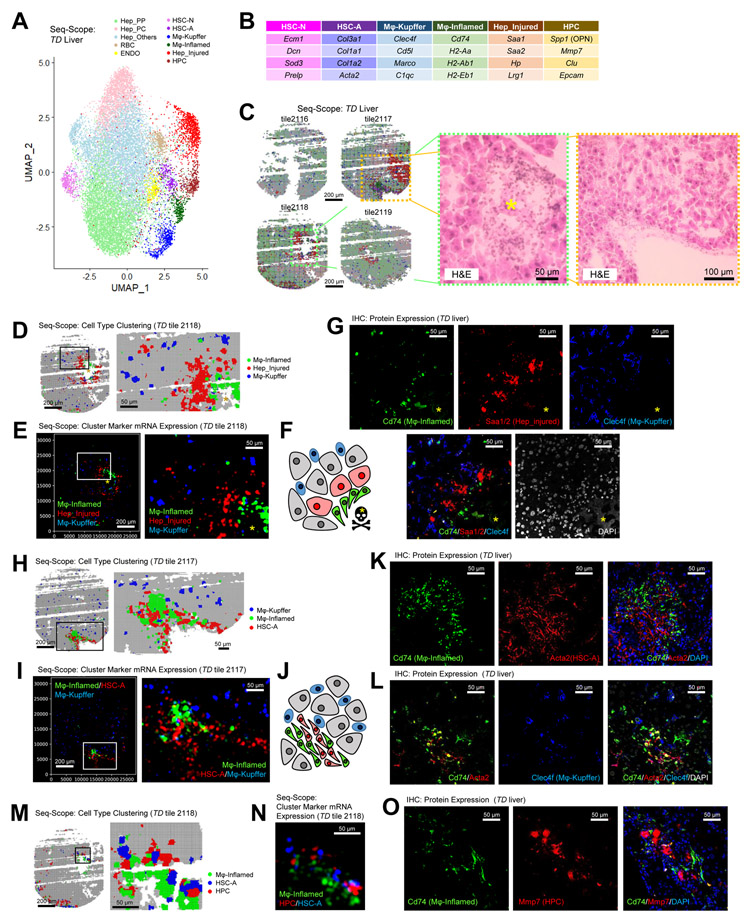
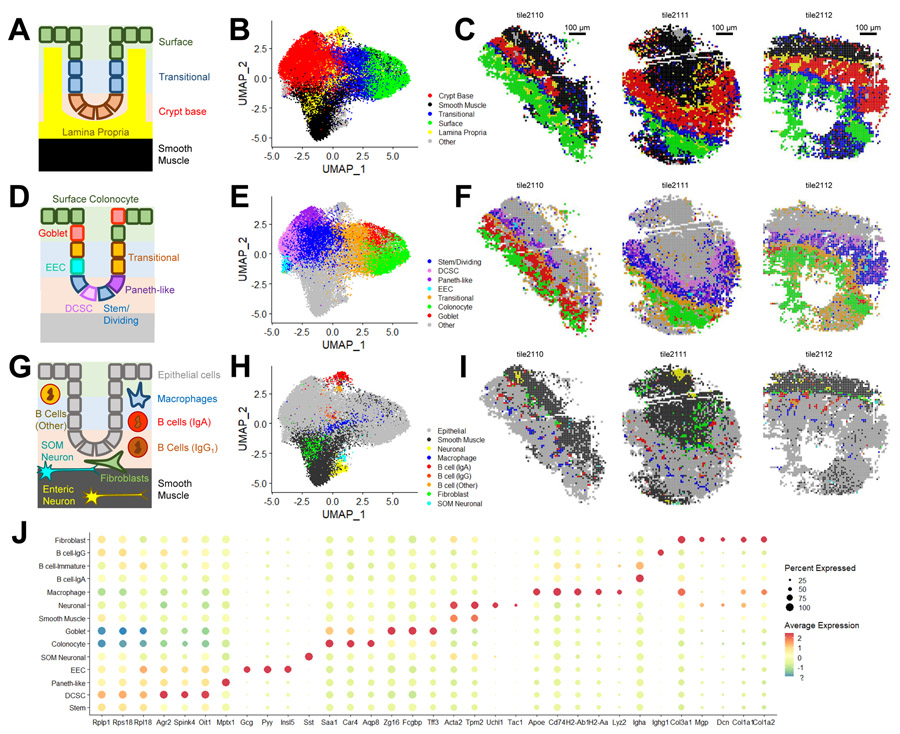
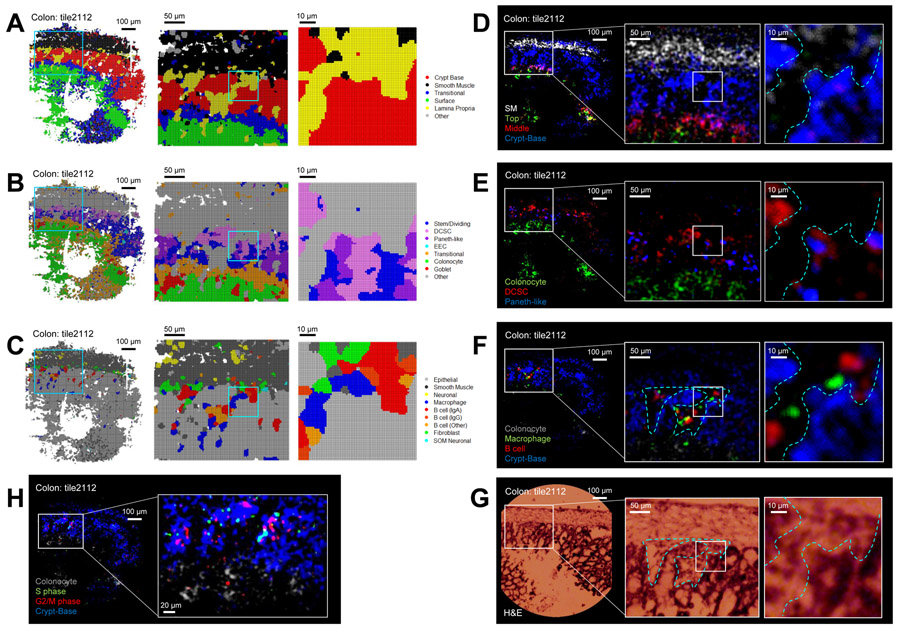
Spatial barcoding technologies have the potential to reveal histological details of transcriptomic profiles; however, they are currently limited by their low resolution. Here, we report Seq-Scope, a spatial barcoding technology with a resolution comparable to an optical microscope. Seq-Scope is based on a solid-phase amplification of randomly barcoded single-molecule oligonucleotides using an Illumina sequencing platform. The resulting clusters annotated with spatial coordinates are processed to expose RNA-capture moiety. These RNA-capturing barcoded clusters define the pixels of Seq-Scope that are ∼0.5-0.8 μm apart from each other. From tissue sections, Seq-Scope visualizes spatial transcriptome heterogeneity at multiple histological scales, including tissue zonation according to the portal-central (liver), crypt-surface (colon) and inflammation-fibrosis (injured liver) axes, cellular components including single-cell types and subtypes, and subcellular architectures of nucleus and cytoplasm. Seq-Scope is quick, straightforward, precise, and easy-to-implement and makes spatial single-cell analysis accessible to a wide group of biomedical researchers.

Keywords: RNA capture; Spatial transcriptomics; colon; high resolution; histology; liver; molecular barcoding; scRNA-seq; spatial single cell analysis; subcellular analysis.


Conflict of interest statement

Declaration of interests J.H.L. is an inventor on pending patent applications related to Seq-Scope. H.M.K. is presently an employee of Regeneron Pharmaceuticals, in which he owns stock and stock options.

Figures

Figure 1.
Figure 1.. Seq-Scope Overview
(A) Schematic representation of the HDMI-oligo library structure for 1st-Seq. P5/P7, PCR adapters; TR1, TruSeq Read 1; HR1, HDMI Read 1. (B) Solid-phase amplification of different HDMI-oligo molecules on the flow cell surface. (C and D) Illumina sequencing by synthesis (SBS) determines the HDMI sequence and XY coordinates of each cluster (C). Then, HDMI oligonucleotide clusters are modified to expose oligo-dT, the RNA-capture domain (D). (E-I) HDMI-array captures RNA released from the overlying frozen section (E). Then, cDNA footprint is generated by reverse transcription (F). After that, secondary strand is synthesized using random priming method (G). Finally, adapter PCR (H) generates the sequencing library for 2nd-Seq (I), where paired-end sequencing using TR1 and TR2 reveals cDNA sequence and its matching HDMI barcode. TR2, TruSeq Read 2. (J) HDMI-array contains up to 150 HDMI clusters in 100 μm2 area. See also Figure S1.
Figure 2.
Figure 2.. Seq-Scope Has an Outstanding Transcriptome Capture Performance.
(A) Representative images of HDMI clusters visualizing “A” intensity at the 1st (upper) and 33rd (lower) cycles of the 1st-Seq SBS, where 33% and >97% of clusters exhibit fluorescence, respectively. Yellow squares in the left panels are magnified in the right panels. (B) H&E staining and its corresponding Cy3-dUTP labeling fluorescence images from fragmented liver section. Dotted lines mark tissue boundaries. Box insets highlight single cell-like patterns. (C) H&E staining and its corresponding HDMI discovery plot drawn from the analysis of 1st-Seq and 2nd-Seq outputs. Brighter color in the HDMI discovery plot indicates that more HDMI was found from 2nd-Seq in the corresponding pixel area. (D-I) Performance comparison of different ST solutions. The values were derived from each pixel (D and F-I) or gridded area (E). nUMI, number of UMI; nGene, number of gene features; SeqScope(L) and SeqScope(C), liver and colon Seq-Scope data. See also Figure S2.
Figure 3.
Figure 3.. Seq-Scope Visualizes Subcellular Spatial Transcriptome.
(A) Schematic diagram depicting the distribution of different RNA species in subcellular compartments. (B-D) Spatial plot of all unspliced and spliced transcripts, as well as nuclear-targeted (B) and mitochondria-encoded (C) transcripts. Pearson correlations (r) between these transcript intensities were presented in a heat map (D). (E) Images displaying unspliced RNA discovery, H&E histology and histology-based cell segmentation boundaries. Inset in the first panel is magnified in right panels. (F) Spatial plot of unspliced and spliced transcripts in three independent subsets of genes (Gene Subset 1-3). Pearson correlations (r) were presented as a heat map. S1-3, Spliced 1-3; U1-3, Unspliced 1-3. (G) Identification of transcriptomic nuclear centers (yellow crosses) through local maxima detection. (H) Identification of nuclear-enriched RNA species. Top 10 nuclear-enriched RNAs are shown. See also Figure S3.
Figure 4.
Figure 4.. Seq-Scope Performs Spatial Single Cell Analysis in Normal Mouse Liver
(A-D) Spatial single cell analysis of Seq-Scope data through histology-guided hepatocyte segmentation. (A) Single hepatocyte segmentation based on H&E staining. (B) Comparison of Seq-Scope single cell output with those obtained from MARS-Seq and Drop-Seq. (C) Cell type clustering revealed multiple layers of hepatocellular zonation (Hep_PC1-3 and Hep_PP1-3), as well as a small number of non-parenchymal (NPC) and injured (Hep_injured) transcriptome phenotypes. PC, pericentral; PP, periportal. UMAP (upper) and heat map (lower) analyses are shown. (D) Spatial map of different hepatocellular clusters (left) was overlaid with H&E staining and cell segmentation images (right). PV, portal vein; CV, central vein. (E) Spectrum of genes exhibiting different zone-specific expression patterns were examined by spatial plot analysis. PC-specific genes are depicted in warm (red-orange-yellow) colors, while PP-specific genes are depicted in cold (blue-purple) colors. (F-I) Detection of NPC transcriptome through histology-agnostic segmentation with 10 μm grids. (F) Schematic diagram depicting cellular components of normal liver and their representation in a tissue section. (G and H) UMAP (G) and spatial plots (H) visualizing clusters of 10 μm grids representing indicated cell types. (I) 10 μm grid-based Mϕ and ENDO mapping data (first and second panel) are compared with spatial plot data of cluster-specific markers (third panel), H&E (fourth) and segmented H&E (fifth) data. See also Figure S4, Table S1 and S2.
Figure 5.
Figure 5.. Seq-Scope Examines Liver Histopathology at Microscopic and Transcriptomic Scales
Liver from a Tsc1Δhep/Depdc5Δhep (TD) mouse, which suffers severe liver injury and inflammation (Cho et al., 2019), was examined through Seq-Scope. (A-C) UMAP (A) and spatial plots (C, left) visualize cell type clusters of 10 μm grids. NPCs and injury-responding populations are highlighted in darker colors, and their representative cell type specific marker genes are summarized in (B). H&E images (C, right) correspond to the boxed regions in (C, left). Yellow asterisk marks the injury area. (D-O) Transcriptomic structure of liver histopathology around dead hepatocytes (D-G) and fibrotic lesions (H-O). (D, H and M) Cell type mapping analysis using sliding windows with 5 μm (left) and 2 μm (right) intervals. (E, I and N) Spatial plotting of indicated cell type-specific genes in histological coordinate plane. (F) Schematic arrangement of Mϕ-Inflamed (green), Mϕ-Kupffer (blue), Hep_Injured (red) and other cells (grey) around dead hepatocytes (black skull with yellow asterisk). (G, K, L and O) Confocal examination of liver sections stained with antibodies detecting cell type marker proteins. DAPI-absent areas with high auto-fluorescence (yellow asterisks) mark dead hepatocytes. (J) Schematic arrangement of Mϕ-Inflamed (green), Mϕ-Kupffer (blue), HSC-A (red) and other cells (grey) around fibrotic lesion. See also Figure S5 and Table S3.
Figure 6.
Figure 6.. Seq-Scope Identifies Various Cell Types from Colonic Wall Histology.
Spatial transcriptome of colonic wall was analyzed using Seq-Scope. 10 μm grid dataset was analyzed. (A-I) Seq-Scope reveals major histological layers (A-C), epithelial cell diversity (D-F) and non-epithelial cell diversity (G-I) through transcriptome clustering. (A, D and G) Schematic representation of colonic wall structure. Clusters corresponding to the indicated cell types were visualized in UMAP manifold (B, E and H) and histological space (C, F and I). (J) Cluster-specific markers were examined in dot plot analysis. DCSC, deep crypt secretory cells; EEC, enteroendocrine cells; SOM Neuronal, somatostatin-expressing neuronal cells. See also Figure S6 and Table S4.
Figure 7.
Figure 7.. Seq-Scope Enables Microscopic Analysis of Colon Spatial Transcriptome.
(A-C) Spatial cell type mapping shown in Figure 6 was refined using multiscale sliding windows analysis with 5 μm (left), 2 μm (center) or 1 μm (right) intervals. (D-H) Original Seq-Scope dataset was analyzed by spatial gene expression plotting, using indicated layer-specific (D), cell type-specific (E and F) or cell cycle-specific (H) marker genes. These spatial transcriptome features were consistent with underlying H&E histology (G). See also Figure S7 and Table S5.

References

    1. Aizarani N, Saviano A, Sagar, Mailly L, Durand S, Herman JS, Pessaux P, Baumert TF, and Grun D (2019). A human liver cell atlas reveals heterogeneity and epithelial progenitors. Nature 572, 199–204. - PMC - PubMed
    1. Asp M, Bergenstrahle J, and Lundeberg J (2020). Spatially Resolved Transcriptomes-Next Generation Tools for Tissue Exploration. Bioessays 42, e1900221. - PubMed
    1. Bahar Halpern K, Caspi I, Lemze D, Levy M, Landen S, Elinav E, Ulitsky I, and Itzkovitz S (2015). Nuclear Retention of mRNA in Mammalian Tissues. Cell Rep 13, 2653–2662. - PMC - PubMed
    1. Baratta JL, Ngo A, Lopez B, Kasabwalla N, Longmuir KJ, and Robertson RT (2009). Cellular organization of normal mouse liver: a histological, quantitative immunocytochemical, and fine structural analysis. Histochem Cell Biol 131, 713–726. - PMC - PubMed
    1. Becht E, McInnes L, Healy J, Dutertre CA, Kwok IWH, Ng LG, Ginhoux F, and Newell EW (2019). Dimensionality reduction for visualizing single-cell data using UMAP. Nat Biotechnol 37, 38–44. - PubMed

Publication types