. 2021 Jul 12;39(7):973-988.e9.
doi: 10.1016/j.ccell.2021.05.006. Epub 2021 Jun 10.

Tim-4+ cavity-resident macrophages impair anti-tumor CD8+ T cell immunity

Affiliations

Tim-4+ cavity-resident macrophages impair anti-tumor CD8+ T cell immunity

Andrew Chow et al. Cancer Cell. .

Abstract

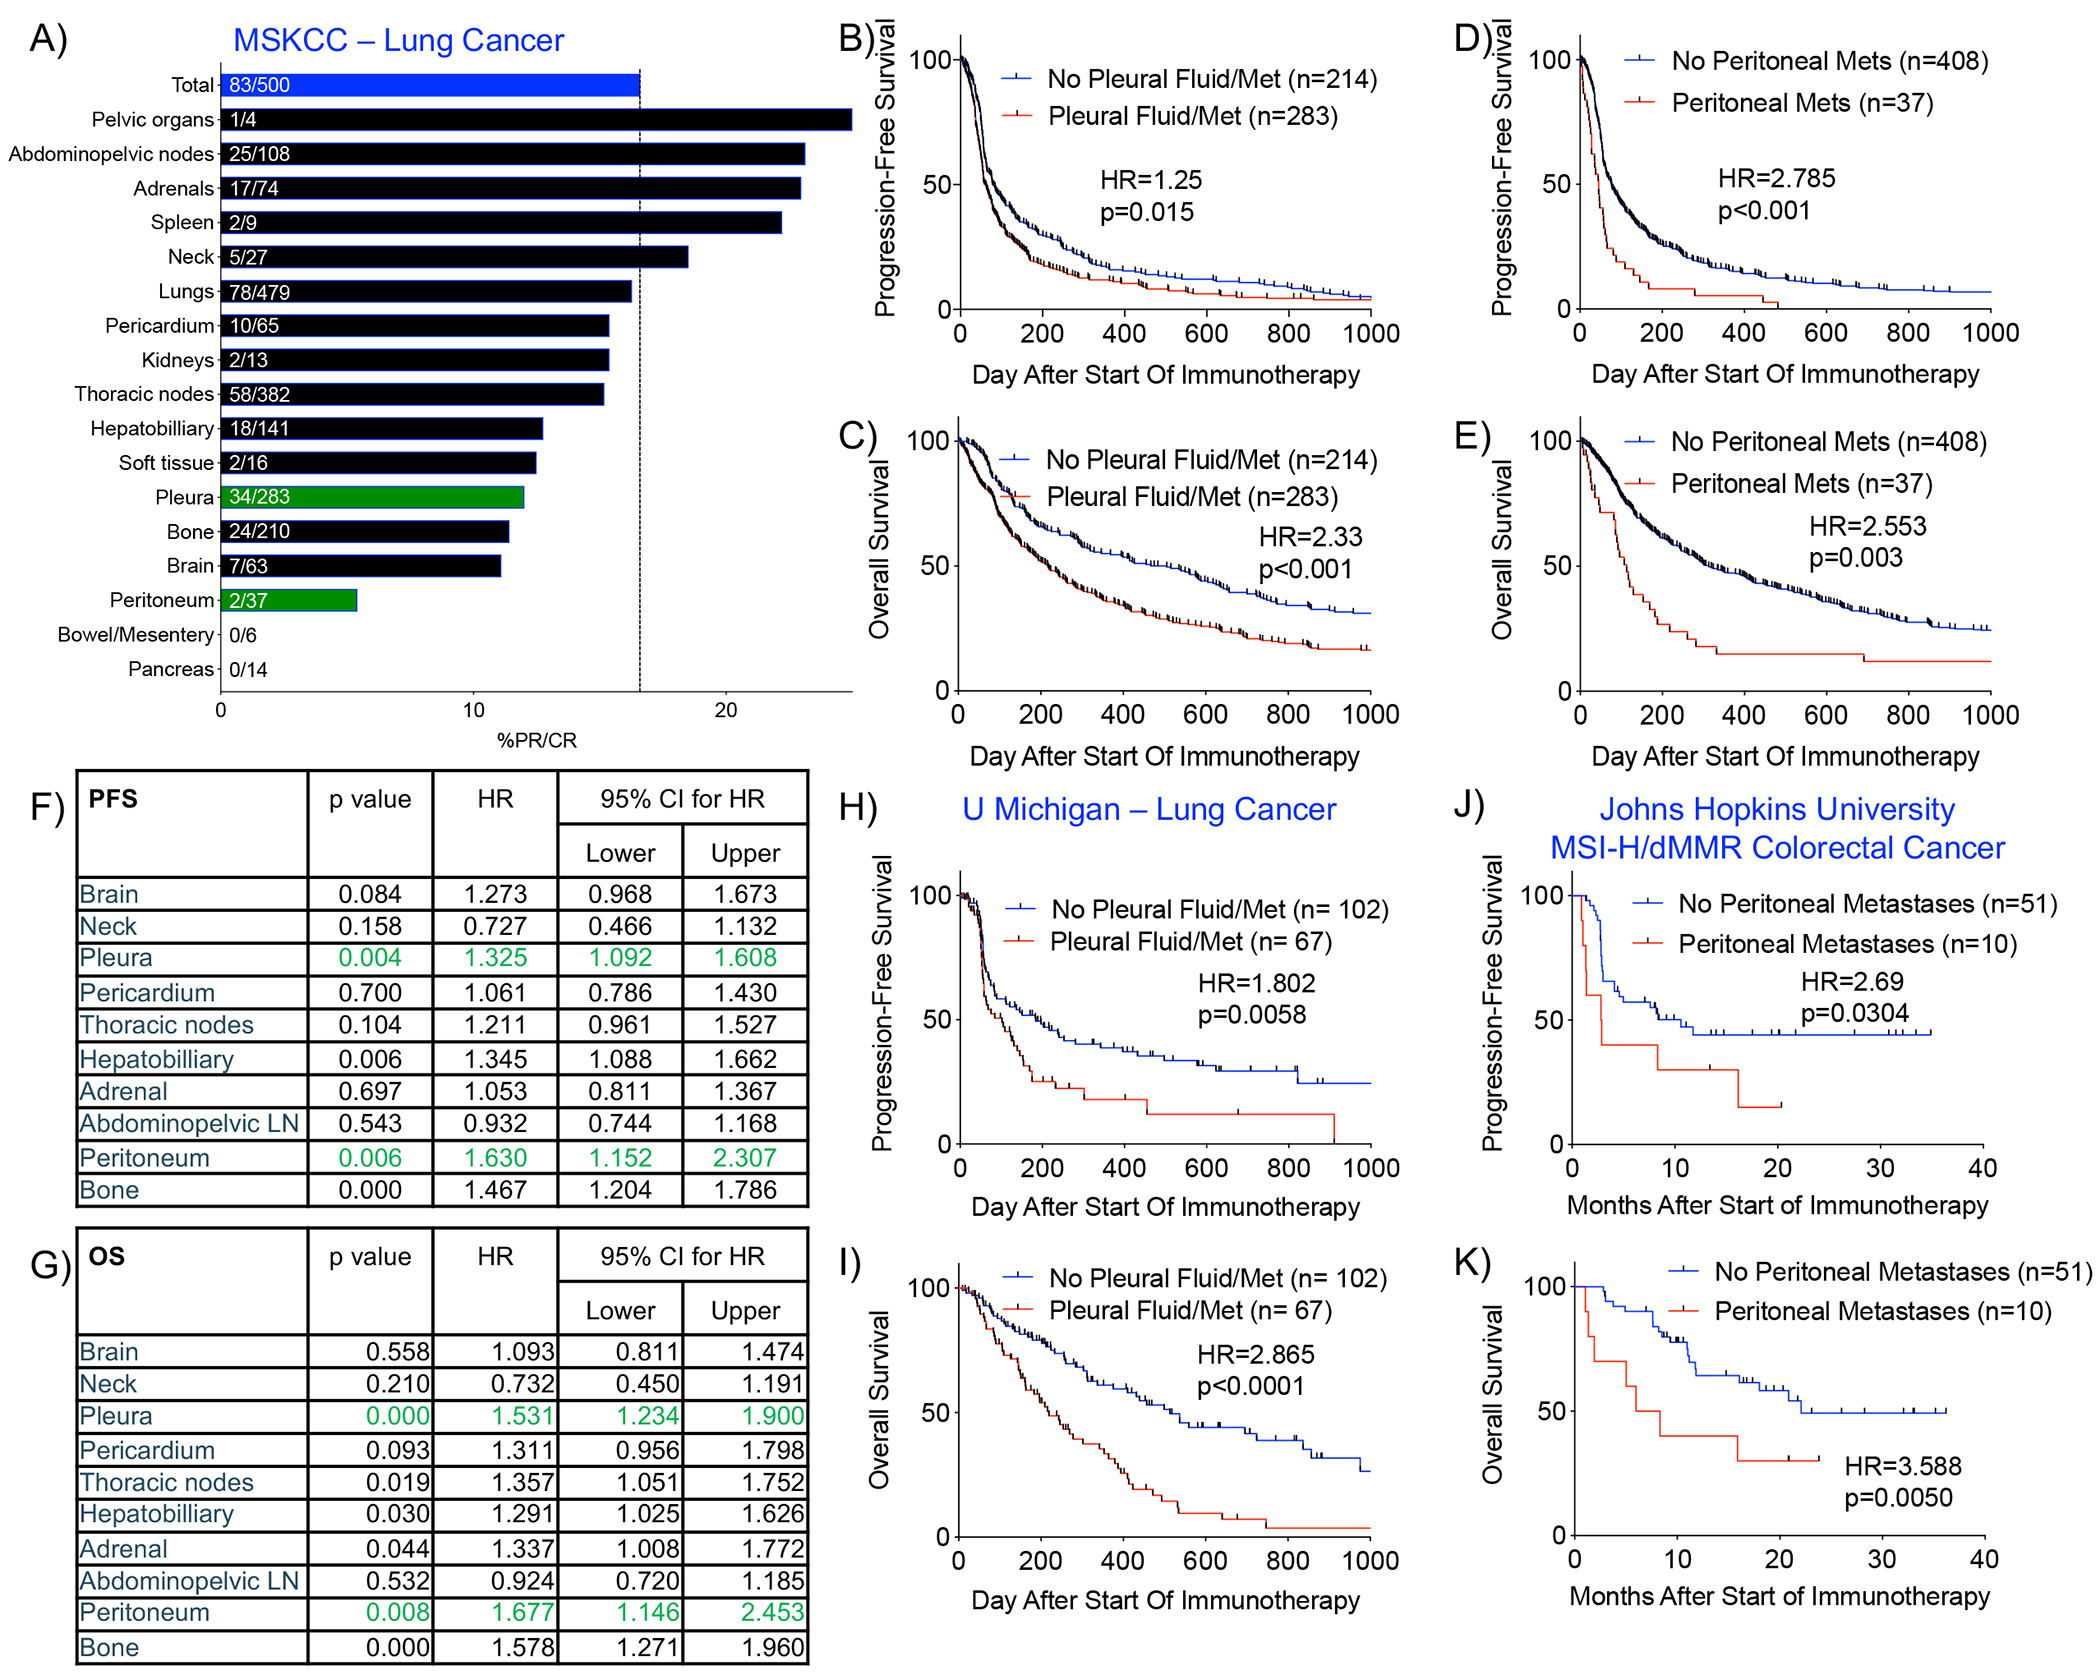
Immune checkpoint blockade (ICB) has been a remarkable clinical advance for cancer; however, the majority of patients do not respond to ICB therapy. We show that metastatic disease in the pleural and peritoneal cavities is associated with poor clinical outcomes after ICB therapy. Cavity-resident macrophages express high levels of Tim-4, a receptor for phosphatidylserine (PS), and this is associated with reduced numbers of CD8+ T cells with tumor-reactive features in pleural effusions and peritoneal ascites from patients with cancer. We mechanistically demonstrate that viable and cytotoxic anti-tumor CD8+ T cells upregulate PS and this renders them susceptible to sequestration away from tumor targets and proliferation suppression by Tim-4+ macrophages. Tim-4 blockade abrogates this sequestration and proliferation suppression and enhances anti-tumor efficacy in models of anti-PD-1 therapy and adoptive T cell therapy in mice. Thus, Tim-4+ cavity-resident macrophages limit the efficacy of immunotherapies in these microenvironments.

Keywords: CD8(+) T cells; Tim-4; cavity-resident macrophages; immune checkpoint blockade; immunotherapy; peritoneal macrophages; phosphatidylserine; pleural macrophages; scRNA-seq; sequestration.


Conflict of interest statement

Declaration of interests JDW is a consultant for Adaptive Biotech, Amgen, Apricity, Ascentage Pharma, Arsenal IO, Astellas, AstraZeneca, Bayer, Beigene, Boehringer Ingelheim, Bristol Myers Squibb, Celgene, Chugai, Daiichi Sankyo, Dragonfly, Eli Lilly, Elucida, F Star, Georgiamune, Idera, Imvaq, Kyowa Hakko Kirin, Linneaus, Maverick Therapeutics, Merck, Neon Therapeutics, Polynoma, Psioxus, Recepta, Takara Bio, Trieza, Truvax, Trishula, Sellas, Serametrix, Surface Oncology, Syndax, Syntalogic, and Werewolf Therapeutics. JDW has received grant/research support from Bristol Myers Squibb; Sephora. JDW has equity in Tizona Pharmaceuticals, Adaptive Biotechnologies, Imvaq, Beigene, Linneaus, Apricity, Arsenal IO, and Georgiamune. JDW is a co-inventor on patent applications related to heteroclitic cancer vaccines and recombinant poxviruses for cancer immunotherapy. JDW and TM are co-inventors on patent applications related to CD40 and in situ vaccination (PCT/US2016/045970). TM is a consultant for Immunos Therapeutics and Pfizer. TM is a cofounder of and equity holder in IMVAQ Therapeutics. TM receives research funding from Bristol-Myers Squibb, Surface Oncology, Kyn Therapeutics, Infinity Pharmaceuticals, Peregrine Pharmaceuticals, Adaptive Biotechnologies, Leap Therapeutics, and Aprea Therapeutics. TM is an inventor on patent applications related to work on oncolytic viral therapy, alpha virus–based vaccine, neoantigen modeling, CD40, GITR, OX40, PD-1, and CTLA-4. C.M.R. has consulted regarding oncology drug development with AbbVie, Amgen, Ascentage, AstraZeneca, BMS, Celgene, Daiichi Sankyo, Genentech/Roche, Ipsen, Loxo and PharmaMar and is on the scientific advisory boards of Elucida, Bridge and Harpoon. Unrelated to this work, D.Z. reports clinical research support to his institution from Astra Zeneca, Plexxikon, and Genentech; and personal/consultancy fees from Merck, Synlogic Therapeutics, GSK, Genentech, Xencor, Memgen, Immunos, CrownBio, and Agenus. D.Z. is an inventor on patents related to the use of Newcastle Disease Virus that has been licensed to Merck. MDH received research grant from BMS; personal fees from Achilles, Arcus, AstraZeneca, Blueprint, BMS, Genentech/Roche, Genzyme, Immunai, Instil Bio, Janssen, Merck, Mirati, Natera, Nektar, Pact Pharma, Regeneron, Shattuck Labs, Syndax, as well as equity options from Arcus, Factorial, Immunai, and Shattuck Labs. A patent filed by MSKCC related to the use of tumor mutational burden to predict response to immunotherapy (PCT/US2015/062208) is pending and licensed by PGDx. DTL serves on advisory boards for Merck, Bristol Myers Squibb, and Janssen and has received research funding from Merck, Bristol Myers Squibb, Aduro Biotech, Curegenix, Medivir, and Nouscom. She has received speaking honoraria from Merck and is an inventor of licensed intellectual property related to technology for mismatch repair deficiency for diagnosis and therapy (WO2016077553A1) from Johns Hopkins University. SS is a shareholder of Canexia Health Inc.

Figures

Figure 1.
Figure 1.. Malignant involvement of the serous body cavities is associated with worse clinical outcomes in patients treated with immune checkpoint blockade.
A) % partial or complete response (%PR/CR) among patients with NSCLC at MSKCC who received ICB and whose pre-ICB imaging was annotated for metastatic involvement of various anatomic sites. %PR/CR in the total cohort is indicated by the blue bar (83/500=16.6%). B-C) Progression-free (PFS) and overall survival (OS) among MSKCC patients with NSCLC treated with ICB with or without evidence of metastatic involvement of the pleural cavity. D-E) PFS and OS among patients with or without evidence of metastatic involvement of the peritoneal cavity. F-G) Multivariate analyses of PFS and OS using Cox Proportional Hazard Model taking into account concomitant involvement of multiple metastatic sites. H-I) PFS and OS among patients with NSCLC at University of Michigan with or without metastatic involvement of the pleural cavity. (J-K) PFS and OS among patients from Johns Hopkins University with MSI-H/dMMR colorectal cancer with or without metastatic involvement of the peritoneal cavity. Statistical analyses of survival curves were performed with Mantel-Cox test. See also Figure S1.
Figure 2.
Figure 2.. Tim-4 is expressed on human serous body cavity macrophages and is inversely correlated with the frequency of CD8+ CD39+ T cells.
A) Immunohistochemistry staining of Tim-4 on histological tissue section of benign adrenal gland, cytospun malignant peritoneal ascites from a patient with NSCLC, cytospun malignant pleural effusion from a patient with NSCLC, and tissue section of benign lung. Positive cells are indicated by arrowhead. B) Flow cytometric expression of Tim-4 protein on steady-state C57BL/6 murine adrenal CD3 CD19 CD11b+ F4/80+ macrophages, peritoneal CD3 CD19 CD11b+ F4/80+ macrophages, pleural CD3 CD19 CD11b+ F4/80+ macrophages, and lung CD3 CD19 CD11bint F4/80+ CD11c+ I-A/I-E+ macrophages (top row). Human tissues were obtained from patients with NSCLC with malignant involvement of indicated tissues (bottom row). All human macrophage populations were gated as CD3 CD14+. Blue histogram indicates isotype control; red histogram indicates Tim-4 stain. C-F) Flow cytometry staining of VSIG-4, CD102, and Tim-4 on CD3 CD14+ peritoneal and pleural macrophages from patients with lung cancer. G-H) Flow cytometry expression of VSIG4, CD102, and Tim-4 on CD3 CD14+ pericardial macrophages in a patient with NSCLC and peritoneal macrophages from a patient with ovarian cancer. I) Among 55 pleural, peritoneal, and pericardial fluid biospecimens from patients with lung cancer, fraction of patients considered to have low vs high Tim-4 expression. J) %CD8+ T lymphocytes isolated from the peritoneal, pleural, or pericardial fluid specimen of patients with lung cancer. Mean ± SEM is displayed, n=27-28. Statistical analysis performed with two-sided student’s t test. n.s. = not significant. K) Representative staining for CD39 and PD-1 on CD8+ T cells from pleural effusions of patients MSK1139b and MSK1266a. L) %CD39+ among CD8+ T cells isolated from peritoneal, pleural, or pericardial fluid biospecimens of patients with lung cancer as in (J). Mean ± SEM is displayed, n=27-28. Statistical analysis performed with two-sided student’s t test. See also Figure S2–5.
Figure 3.
Figure 3.. Antibody blockade and genetic abrogation of Tim-4 enhances responses to anti-PD-1 therapy in mice.
A) Bioluminescence images from individual C57BL/6 mice at indicated times after peritoneal tumor challenge (TC) with MC38-Luciferase-GFP. Mice received isotype control antibodies (Iso-Iso), anti-Tim-4 and isotype (αTim-4-Iso), isotype and anti-PD-1 (Iso-αPD-1), or anti-Tim-4 and anti-PD-1 (αTim-4-αPD-1). One representative of three independent experiments is depicted. B) Bioluminescence measured as photons per second (p/s) at week three after TC in C57BL/6 mice treated as indicated. N=27-28 at start of experiment, pooled from three independent experiments. Statistical analysis performed with two-sided Mann-Whitney U test. C) Kaplan-Meier survival curve for C57BL/6 mice treated as in (B). Statistical analysis performed with Mantel-Cox test. D-E) Absolute number of CD8+ T cells and CD8+ CD39+ T cells in the peritoneal cavity of C57BL/6 mice 14 days after tumor challenge and treated as in (B). N=10-15, pooled from ≥2 independent experiments. Statistical analyses performed with two-sided student’s t test. F) Bioluminescence measured at week three after TC in Tim-4 Het or KO mice treated as indicated. N=26-31 at start of experiment, pooled from three independent experiments. Statistical analysis performed with two-sided Mann-Whitney U test. G) Kaplan-Meier survival curve for mice treated as in (F). Statistical analysis performed with Mantel-Cox test. H-I) Absolute number of CD8+ T cells and CD8+ CD39+ T cells in the peritoneal cavity of C57BL/6 mice 14 days after TC and treated as in (F). N=5, representative of 2 independent experiments. Statistical analyses performed with two-sided student’s t test. J) Tumor growth curves as measured by in vivo bioluminescence signal from individual C57BL/6 mice at indicated times after peritoneal TC with HKP1-Luc-mCherry. K) Kaplan-Meier survival curve for mice treated as in (J). Statistical analysis performed with Mantel-Cox test. For plots B, D, E, F, H, and I, mean ± SEM is displayed. See also Figure S6.
Figure 4.
Figure 4.. PShigh CD8+ T cells are viable and enriched in cytotoxic and proliferative effectors.
A-B) Flow cytometric assessment of Annexin V on DAPI CD8+ T cells after murine or human T cell activation. Activation stimuli include anti-mouse CD3/CD28 microbeads (αCD3/28) or PMA/Ionomycin cultured with wild-type splenocytes or SIINFEKL and gp100 peptide cultured with OT-1 and pmel transgenic splenocytes, respectively. Human PBMCs were stimulated with αCD3/28. Gray and purple lines indicate splenocytes cultured without and with T cell stimulation, respectively. Mean ± SEM is displayed, n=4-6, representative of three independent experiments. Statistical analyses were performed with two-way ANOVA with Bonferroni Post-Test. C) PSlow and PShigh viable (DAPI caspase 3/7low) CD8+ T cells were flow-sorted from the peritoneal cavity of MC38-LG-bearing mice that were treated with anti-Tim-4 and anti-PD-1 and placed into culture with parental MC38 tumor cells. Cytotoxicity was assessed by clonogenic cytotoxicity assay. D) Representative well images taken of MC38 colonies initially plated from remnant MC38 cells after 36-hour co-culture with CD8+ T cells. E) Cytotoxicity of PSlow and PShigh viable CD8+ T cells against parental MC38 targets. N=4, representative of three independent experiments. Statistical analysis performed with two-sided student’s t test. F) Cytotoxicity of PSlow (red) and PShigh (green) viable CD8+ T cells against MC38-LG cells after 48-hour co-culture at the indicated ratios. N=4, representative of two independent experiments. Statistical analysis performed with two-sided student’s t test. G) Heat map of expression of select differentially expressed T cell-associated genes in PSlow and PShigh viable CD8+ T cells isolated from the peritoneal cavity of MC38-LG-bearing mice that were treated with anti-Tim-4 and anti-PD-1 and assessed by single cell RNA sequencing (scRNAseq). H) Dot plot of expression of select genes associated with naïve T cells, effector T cells, cytotoxicity, proliferation, and activation/exhaustion in clusters 1-4. I) UMAP embedding of clusters 1-4 from sorted PShigh and PSlow viable CD8+ T cells. J) Dot plot of expression of select genes as in (H) on paired scRNA/TCRseq of MC38-associated PShigh and PSlow viable CD8+ T cells. See also Figure S7–9.
Figure 5.
Figure 5.. Tim-4+ macrophages functionally sequester PShigh CD8+ T cells.
A) Absolute number of PShigh CD8+ T cells in the peritoneal cavity of C57BL/6 mice 14 days after tumor challenge and treated as indicated. N=15, pooled from three independent experiments. Statistical analysis performed with two-sided student’s t test. B) Absolute number of PShigh CD8+ T cells in Tim-4 Het or KO mice 14 days after tumor challenge and treated as indicated. N=5, representative of two independent experiments. Statistical analysis performed with two-sided student’s t test. C-F) Absolute number of GFP+ DAPI CD8+ T cells, GFP+ DAPI PShigh CD8+ T cells, and GFP+ DAPI PSlow CD8+ T cells in the non-adherent fraction or GFP+ DAPI CD8+ T cells in the adherent fraction after culture alone or after co-culture with isotype- or anti-Tim-4-treated macrophages. N=6, representative of two independent experiments. Statistical analysis performed with two-sided student’s t test. G-H) Absolute number of CTV+ CD8+ T in the non-adherent or adherent fraction after culture alone or after co-culture with human macrophages obtained from the indicated biospecimens. N=3, representative of two independent experiments. Statistical analysis performed with two-sided student’s t test. I) Single frame image of confocal microscopy of GFP+ CD8+ T cells (green) adherent to Isotype- or Anti-Tim-4-treated Cell Trace Far Red+ macrophages (red) after 1hr of co-culture. See also Video S1 for 6 hours of imaging. Quantification of GFP+ cells adherent to Cell Trace Far Red+ macrophages on confocal microscopy. Representative of three independent experiments. Statistical analysis performed with two-way ANOVA with Sidak post-test. J) Cytotoxicity of PShigh CD8+ T cells sorted from the peritoneal cavity 14 days after tumor challenge with MC38-LG and treated with anti-Tim-4 and anti-PD-1. The T cells were initially cultured alone or with Isotype- or anti-Tim-4-treated macrophages for 1-2hr prior to removal of a silicon separator, which allowed the T cells to access the parental MC38 cell line. Cytotoxicity was assessed by Celigo well imaging after 40hr of culture. N=6, representative of two independent experiments. Statistical analysis performed with two-sided student’s t test. For all plots, mean ± SEM is displayed. See also Figure S9.
Figure 6.
Figure 6.. Tim-4+ macrophages impair proliferation of activated CD8+ T cells.
A) Flow cytometry plots of CTV dilution by murine CD8+ T cells with the indicated co-culture conditions. B) Graphical compilation of data shown in panel A. N=3, representative of three independent experiments. Statistical analysis performed with two-sided student’s t test. C) Flow cytometry plots of CD39 expression (red) compared to FM1 (blue) for murine CD11b+ Tim-4+ or human CD14+ macrophages. D-E) Flow cytometry plots of CTV dilution by human CD8+ T cells with the indicated co-culture conditions, including co-culture with macrophages from MSK 347c and 1366a. F-G) Graphical compilation of data shown in panel D or E. N=3, representative of two independent experiments. H) Quantification of flow cytometric expression of Ki67 on CD8+ T cells obtained from the peritoneal cavities of MC38-LG bearing mice that were treated with Isotype and anti-PD-1 or anti-Tim-4 and anti-PD-1. N=10, representative of two independent experiments. Statistical analysis performed with two-sided student’s t test. I) Quantification of CTV dilution in CD45.2+ CD8+ T cells obtained from MC38-Ova-bearing animals 48 hours after infusion of pre-activated OT-1 cells (left panels). N=10, representative of two independent experiments. For plots B, F, G, H, and I, mean ± SEM is displayed. Kaplan-Meier survival curve for mice (right panel). N=20, pooled from two independent experiments. Statistical analysis performed with Mantel-Cox test.

Comment in

References

    1. Albacker LA, Karisola P, Chang YJ, Umetsu SE, Zhou M, Akbari O, Kobayashi N, Baumgarth N, Freeman GJ, Umetsu DT, and DeKruyff RH (2010). TIM-4, a receptor for phosphatidylserine, controls adaptive immunity by regulating the removal of antigen-specific T cells. J Immunol 185, 6839–6849. - PMC - PubMed
    1. Albacker LA, Yu S, Bedoret D, Lee WL, Umetsu SE, Monahan S, Freeman GJ, Umetsu DT, and DeKruyff RH (2013). TIM-4, expressed by medullary macrophages, regulates respiratory tolerance by mediating phagocytosis of antigen-specific T cells. Mucosal Immunol 6, 580–590. - PMC - PubMed
    1. Baghdadi M, Yoneda A, Yamashina T, Nagao H, Komohara Y, Nagai S, Akiba H, Foretz M, Yoshiyama H, Kinoshita I, et al. (2013). TIM-4 glycoprotein-mediated degradation of dying tumor cells by autophagy leads to reduced antigen presentation and increased immune tolerance. Immunity 39, 1070–1081. - PubMed
    1. Bain CC, Hawley CA, Garner H, Scott CL, Schridde A, Steers NJ, Mack M, Joshi A, Guilliams M, Mowat AM, et al. (2016). Long-lived self-renewing bone marrow-derived macrophages displace embryo-derived cells to inhabit adult serous cavities. Nat Commun 7, ncomms11852. - PMC - PubMed
    1. Bain CC, and Jenkins SJ (2018). The biology of serous cavity macrophages. Cell Immunol 330, 126–135. - PubMed

Publication types

MeSH terms