. 2021 Sep;161(3):953-967.e15.
doi: 10.1053/j.gastro.2021.05.058. Epub 2021 Jun 8.

WFDC2 Promotes Spasmolytic Polypeptide-Expressing Metaplasia Through the Up-Regulation of IL33 in Response to Injury

Affiliations

WFDC2 Promotes Spasmolytic Polypeptide-Expressing Metaplasia Through the Up-Regulation of IL33 in Response to Injury

Haengdueng Jeong et al. Gastroenterology. 2021 Sep.

Abstract

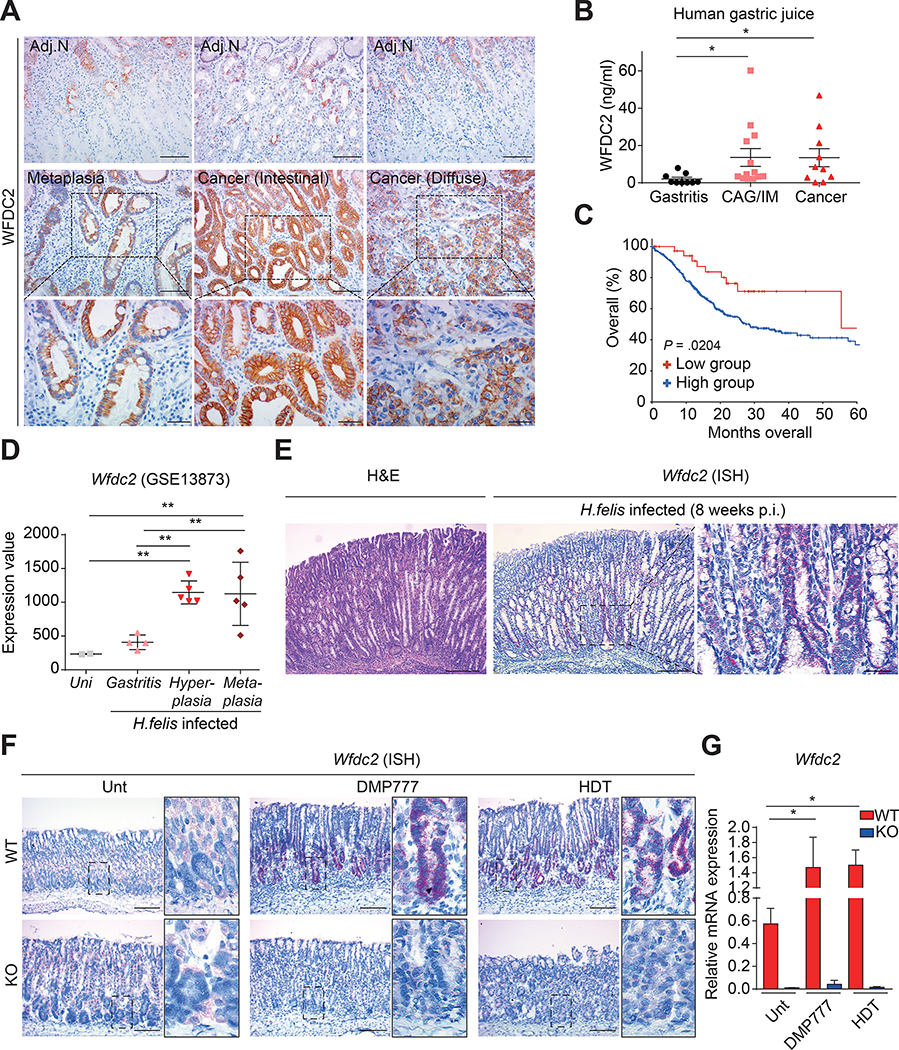
Background & aims: WAP 4-disulfide core domain protein 2 (WFDC2), also known as human epididymis protein 4, is a small secretory protein that is highly expressed in fibrosis and human cancers, particularly in the ovaries, lungs, and stomach. However, the role of WFDC2 in carcinogenesis is not fully understood. The present study aimed to investigate the role of WFDC2 in gastric carcinogenesis with the use of preneoplastic metaplasia models.

Methods: Three spasmolytic polypeptide-expressing metaplasia (SPEM) models were established in both wild-type and Wfdc2-knockout mice with DMP-777, L635, and high-dose tamoxifen, respectively. To reveal the functional role of WFDC2, we performed transcriptomic analysis with DMP-777-treated gastric corpus specimens.

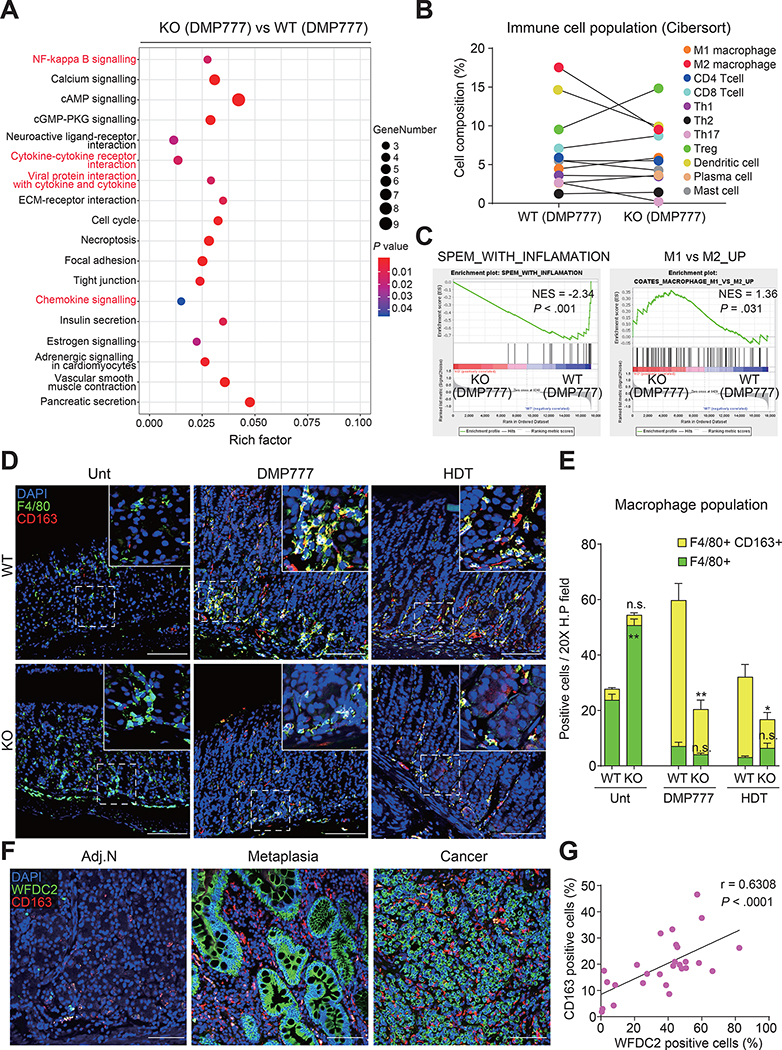
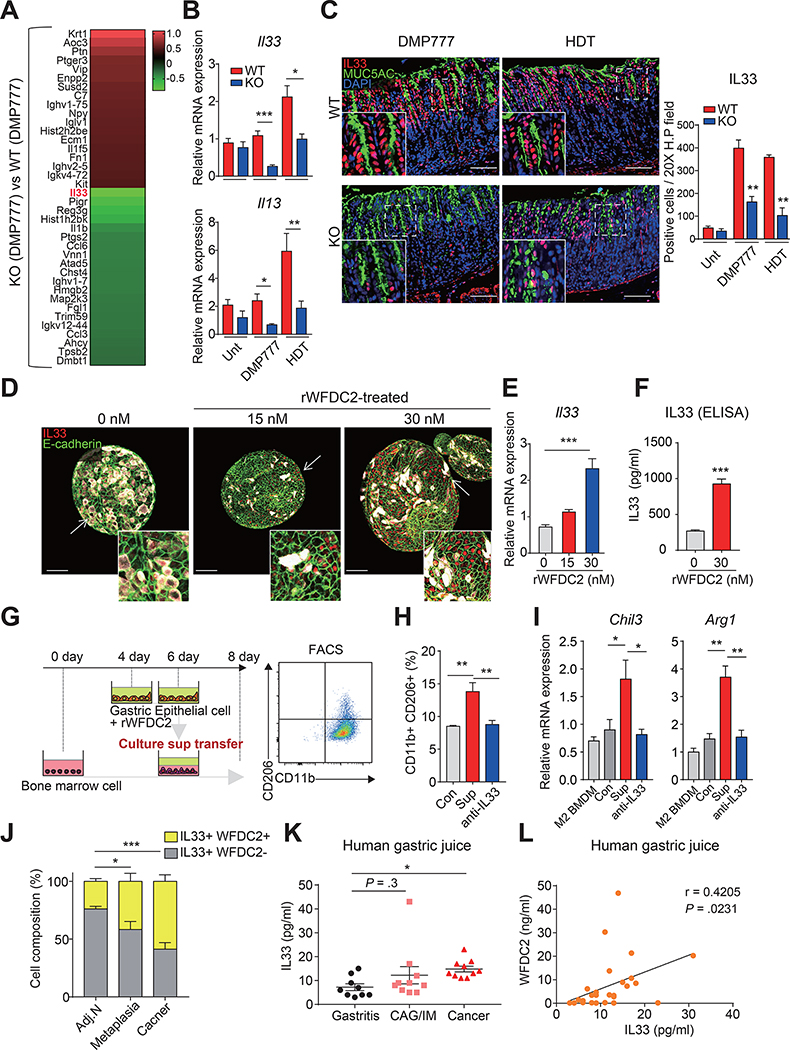
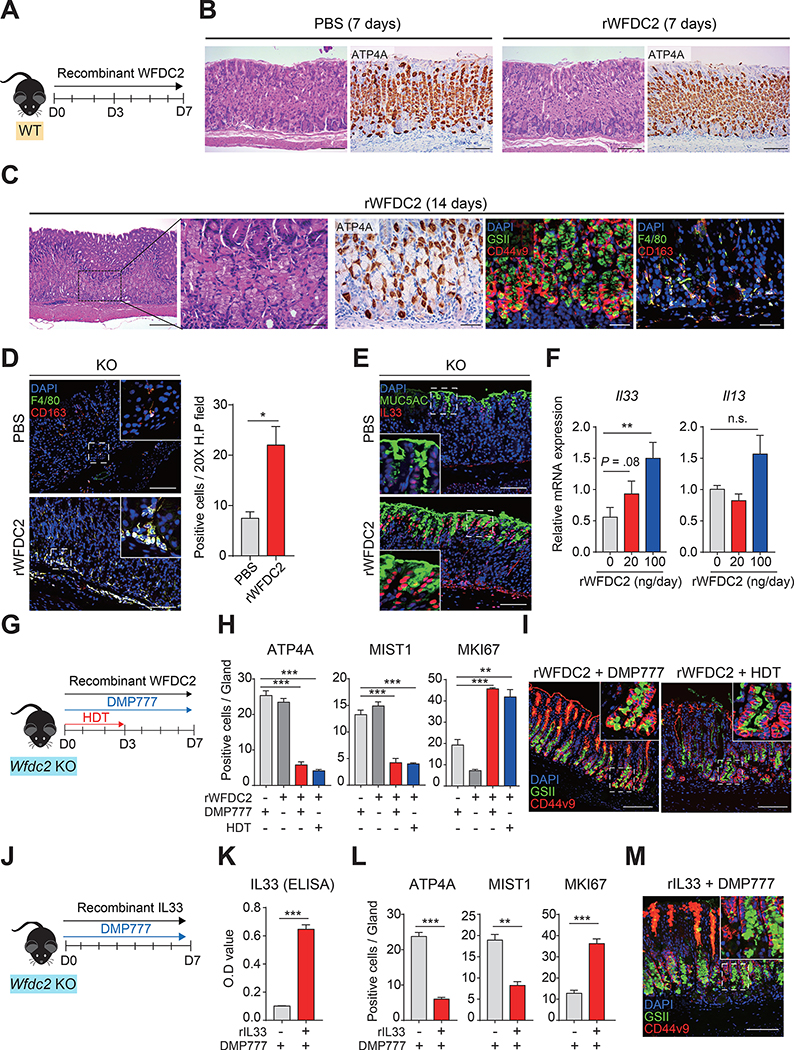
Results: Wfdc2-knockout mice exhibited remarkable resistance against oxyntic atrophy, SPEM emergence, and accumulation of M2-type macrophages in all 3 SPEM models. Transcriptomic analysis revealed that Wfdc2-knockout prevented the up-regulation of interleukin-33 (IL33) expression in the injured mucosal region of SPEM models. Notably, supplementation of recombinant WFDC2 induced IL33 production and M2 macrophage polarization, and ultimately promoted SPEM development. Moreover, long-term treatment with recombinant WFDC2 was able to induce SPEM development.

Conclusions: WFDC2 expressed in response to gastric injury promotes SPEM through the up-regulation of IL33 expression. These findings provide novel insights into the role of WFDC2 in gastric carcinogenesis.

Keywords: Interleukin-33 (IL33); M2 macrophage; SPEM; WFDC2.


Conflict of interest statement

Disclosures: The authors declare no conflicts of interest.

Figures

Figure 1.
Figure 1.. WFDC2 expression in human and mice.
(A) Immunohistochemistry images for WFDC2 in human tissue. Top panels indicate adjacent normal (Adj.N) tissue regions to the metaplasia and gastric cancer. Scale bars, 100 μm (top and middle panels); 40 μm (bottom panels). (B) WFDC2 concentrations in gastric juice from patients with gastritis (n = 9), chronic atrophic gastritis/intestinal metaplasia (CAG/IM; n = 13), and gastric cancer (n = 10) (two-tailed unpaired Student’s t-test, *p < 0.05). (C) Kaplan–Meier survival graph for gastric adenocarcinoma patients. Statistical significance was assessed by the log-rank test (Low group WFDC2: expression z-score ≤−1.5). (D) Wfdc2 expression for H. felis-infected mice using GSE13873 (one-way analysis of variance with Dunnett’s multiple comparison, **p < 0.01). (E) Representative H&E and ISH images for the H. felis-infected mice. Scale bars, 200 μm (left and middle panels); 40 μm (right panel). (F) ISH images for Wfdc2. Scale bar, 100 μm. WT, wild-type; KO, knockout. (G) RT-qPCR for Wfdc2; the mRNA expression level was normalized by Gapdh (n = 4–5 per group, one-way analysis of variance with Dunnett’s multiple comparison, *p < 0.05). All data are presented as a mean ± SEM.
Figure 2.
Figure 2.. Protective effect of Wfdc2 knockout (KO) against DMP-777 treatment.
(A) H&E images of the corpus from wild-type (WT) and KO mice during DMP-777 treatment. Scale bars, 100 μm. (B) MKI67+ proliferating cells in single glands quantified in WT and KO mice. Cell numbers were measured at the Top, Neck, and Base, each representing 1/3 of the total gland length (n = 5 per group, two-tailed unpaired Student’s t-test, ***p < 0.001) (C) Proliferating cell distributions in single glands. Each spot represents average loci of cells from the lowest gland base (0 μm) (two-tailed unpaired Student’s t-test, **p < 0.01, ***p < 0.001). (D) TEM images of parietal cells. Scale bars, 5000 nm. (E) ATP4A+ parietal cells in single glands quantified in WT and KO mice (n = 5 per group, two-tailed unpaired Student’s t-test, ***p < 0.001). (F) Blood gastrin concentrations in WT and KO mice (n = 3–4 per group, two-tailed unpaired Student’s t-test, ***p < 0.001). (G) MIST1+ chief cells in single glands quantified in WT and KO mice (n = 5 per group, two-tailed unpaired Student’s t-test, ***p < 0.001). (H) Average MUC5AC+ lengths measured from the top gland in WT and KO mice (n = 5 per group, two-tailed unpaired Student’s t-test). All data are presented as a mean ± SEM. Unt, Untreated; D7, 7 days of DMP-777 treatment; D14, 14 days of DMP-777 treatment; R14, 14 days of recovery.
Figure 3.
Figure 3.. Inhibition of SPEM in Wfdc2-knockout (KO) mice after DMP-777 treatment.
(A) Immunohistochemistry images for TFF2. Scale bars, 40 μm. (B) Quantification of TFF2+ cells in single glands (n = 5 per group, two-tailed unpaired Student’s t-test, ***p < 0.001). (C) TEM images of chief cells. Scale bars, 5000 nm. ZG, zymogen granule. (D) Immunofluorescence images for GSII, and GIF in wild-type (WT) and KO mice. Scale bars, 20 μm. (E) Comparison of SPEM cells during DMP-777 treatment. Each graph represents the number of positive cells in single glands (n = 5 per group, two-tailed unpaired Student’s t-test, **p < 0.01). (F) Immunofluorescence images for GSII, and MKI67. Scale bars, 20 μm. (G) Comparison of proliferative SPEM cells during DMP-777 treatment. Each graph represents the number of positive cells in single glands (n = 5 per group, two-tailed unpaired Student’s t-test, **p < 0.01, ***p < 0.001). (H) Immunofluorescence images for GSII, and CD44v9 of the Unt, DMP-777 (D7)-treated, and HDT-treated corpus. Scale bars, 100 μm. (I) RT-qPCR for Cftr and Gpx2 in the Unt, DMP-777 (D7)-treated, and HDT-treated corpus. mRNA expression levels were normalized by Gapdh (n = 5–7 per group, two-tailed unpaired Student’s t-test, *p < 0.05). All data are presented as a mean ± SEM. Unt, Untreated; D7, 7 days of DMP-777 treatment; D14, 14 days of DMP-777 treatment; R14, 14 days of recovery; HDT, high-dose tamoxifen.
Figure 4.
Figure 4.. Decrease in M2 macrophage accumulation in Wfdc2-knockout (KO) mice after DMP-777 treatment.
(A) Bubble plot showing selected top 18 terms of enriched KEGG pathways. P values were derived from Fisher’s exact test. (B) Computational comparison of average immune cell composition between DMP-777-treated wild-type (WT) and KO mice. The analysis was matched with a published signature file. (C) GSEA graphs for SPEM-related immune gene signatures comparing DMP-777-treated KO and WT mice. (D) Immunofluorescence images for F4/80, and CD163 of the Unt, DMP-777 (D7)-treated, and HDT-treated corpus. Scale bars, 100 μm. (E) Number of positives in a 20X high-power field of the Unt, DMP-777 (D7), and HDT groups. Data are presented as a mean ± SEM (n = 3 per group, two-tailed unpaired Student’s t-test, *p < 0.05, **p < 0.01). (F) Immunofluorescence images for WFDC2, and CD163 in adjacent normal (Adj.N), metaplasia, and cancer tissues from human patients. Scale bars, 100 μm. (G) Correlation between WFDC2-positive cells and CD163-positive cells in human tissue. Positive cells in human specimens (n = 27) were measured in a 20X high-power field and assessed by a two-tailed test using Pearson’s correlation coefficients. Unt, Untreated; D7, 7 days of DMP-777 treatment; HDT, high-dose tamoxifen.
Figure 5.
Figure 5.. Novel function of WFDC2 as a regulator of interleukin-33 (IL33).
(A) Heatmap showing differentially expressed genes involved in immune-related Gene Ontology terms (GO: 0006955, GO: 0006954) in DMP-777-treated knockout (KO) mice compared to DMP-777-treated wild-type (WT) mice. (B) RT-qPCR for Il33 and Il13 in the Unt, DMP-777 (D7)-treated, and HDT-treated corpus; mRNA expression levels were normalized by Gapdh (n = 3–7 per group, two-tailed unpaired Student’s t-test, *p < 0.05, **p < 0.01, ***p < 0.001). (C) Immunofluorescence for MUC5AC, and IL33 in DMP-777 (D7) and HDT groups. Scale bar, 100 μm. Graph indicates the number of positives at epithelial regions in a 20X high-power field (n = 3 per group, two-tailed unpaired Student’s t-test, **p < 0.01). (D) Immunofluorescence for E-cadherin, MUC5AC and IL33 in rWFDC2-treated corpus organoids at 48 h after initial treatment. Scale bar, 100 μm. (E) RT-qPCR for Il33 in rWFDC2-treated corpus organoids; mRNA expression levels were normalized by Gapdh (n = 3–4 per each group, one-way analysis of variance with Dunnett’s multiple comparison, ***p < 0.001). (F) IL33 level in supernatants from gastric epithelial cells at 48 h after treatment with rWFDC2 (n = 3 per group, two-tailed unpaired Student’s t-test, **p < 0.01). (G–I) BMDMs were cultured for 8 days and supplemented with the supernatant from rWFDC2-treated gastric epithelium after 4 days of culture, and further analyzed with FACS. (H) FACS sorting for CD45+CD11b+CD206+ M2 macrophages and (I) RT-qPCR for M2 macrophage markers (Chil3 and Arg1). M2 BMDM indicates cells without supplement of supernatant as a normal control, while Con indicates cells supplemented with the supernatant of epithelial cells (+0 nM rWFDC2). Sup indicates cells supplemented with the supernatant of epithelial cells (+30 nM rWFDC2), and anti-IL33 indicates Sup (+30 nM rWFDC2) treated with anti-IL33 antibody. (n = 4 per group, one-way analysis of variance with Dunnett’s multiple comparison, *p < 0.05, **p < 0.01). (J) IL33-expressing cell composition (IL33+WFDC2-, IL33+WFDC2+) in a 20X high-power field of adjacent normal (Adj.N, n = 5), metaplasia (n = 8), and cancer (n = 8) tissues from human patients (two-tailed unpaired Student’s t-test, *p < 0.05 ***p < 0.001). (K) IL33 levels in human gastric juice from patients with gastritis (n = 9), chronic atrophic gastritis/intestinal metaplasia (CAG/IM, n = 10), and cancer (n = 10) (two-tailed unpaired Student’s t-test, *p < 0.05). (L) Correlation between IL33 and WFDC2 levels in human gastric juice (n = 29) assessed by a two-tailed test using Pearson’s correlation coefficients. All data are presented as a mean ± SEM. Unt, Untreated; D7, 7 days of DMP-777 treatment; HDT, high-dose tamoxifen.
Figure 6.
Figure 6.. Exacerbation of SPEM in Wfdc2-knockout (KO) mice by infusion of rWFDC2.
(A) Schematic image showing infusion of rWFDC2 (100 ng/day) in wild-type (WT) mice by an osmotic pump. (B) H&E and immunohistochemistry images of ATP4A. Scale bar, 100 μm. (C) H&E, immunohistochemistry, and immunofluorescence images after 14 days of rWFDC2 (100 ng/day) infusion in WT mice. Scale bars, 100 μm (left panel); 40 μm (other panels). (D) Immunofluorescence images for F4/80, and CD163 after 7 days of rWFDC2 infusion in KO mice. Scale bar, 100 μm. The graph represents the number of positive cells in a 20X high-power field of control (PBS) and rWFDC2-infused groups (n = 3 per group, two-tailed unpaired Student’s t-test, *p < 0.05). (E) Immunofluorescence images for MUC5AC and IL33 after 7 days of rWFDC2 infusion in KO mice. Scale bar, 100 μm. (F) RT-qPCR for Il33 and Il13 in rWFDC2-infused KO mice; mRNA expression levels were normalized by Gapdh (n = 4 per group, one-way analysis of variance with Dunnett’s multiple comparison, **p < 0.01). (G) Schematic image showing SPEM induction in rWFDC2-infused KO mice (100 ng/day). (H) Number of positive cells in single glands with (+) or without (–) rWFDC2, DMP-777, and HDT (n = 3 per group, two-tailed unpaired Student’s t-test, **p < 0.01, ***p < 0.001). (I) Immunofluorescence images for GSII, and CD44v9 in rWFDC2-infused (+ DMP-777 or + HDT) KO mice. Scale bar, 100 μm. (J) Schematic image showing SPEM induction in rIL33-infused KO mice (0.0125 mg kg−1day−1). (K) IL33 concentration in the blood and (L) the number of positive cells in single glands with (+) or without (–) rIL33 and DMP-777 (n = 3–4 per group, two-tailed unpaired Student’s t-test, **p < 0.01, ***p < 0.001). (M) Immunofluorescence images for GSII, and CD44v9 in rIL33-infused (+ DMP-777) KO mice. Scale bar, 100 μm. All data are presented as a mean ± SEM. HDT, high-dose tamoxifen.

References

    1. Hunt RH, Camilleri M, Crowe SE, et al.The stomach in health and disease. Gut 2015;64:1650–68. - PMC - PubMed
    1. Shi WJ, Gao JB. Molecular mechanisms of chemoresistance in gastric cancer. World J Gastrointest Oncol 2016;8:673–81. - PMC - PubMed
    1. Goldenring JR, Nam KT. Oxyntic atrophy, metaplasia, and gastric cancer. Prog Mol Biol Transl Sci 2010;96:117–31. - PMC - PubMed
    1. Correa P A human model of gastric carcinogenesis. Cancer Res 1988;48:3554–60. - PubMed
    1. Yoshizawa N, Takenaka Y, Yamaguchi H, et al.Emergence of spasmolytic polypeptide-expressing metaplasia in Mongolian gerbils infected with Helicobacter pylori. Lab Invest 2007;87:1265–76. - PubMed

Publication types

MeSH terms

Substances