

Association of mammographic density with blood DNA methylation
- PMID: 34116608
- PMCID: PMC9067527
- DOI: 10.1080/15592294.2021.1928994
Association of mammographic density with blood DNA methylation
Abstract
Background: Altered DNA methylation may be an intermediate phenotype between breast cancer risk factors and disease. Mammographic density is a strong risk factor for breast cancer. However, no studies to date have identified an epigenetic signature of mammographic density. We performed an epigenome-wide association study of mammographic density.
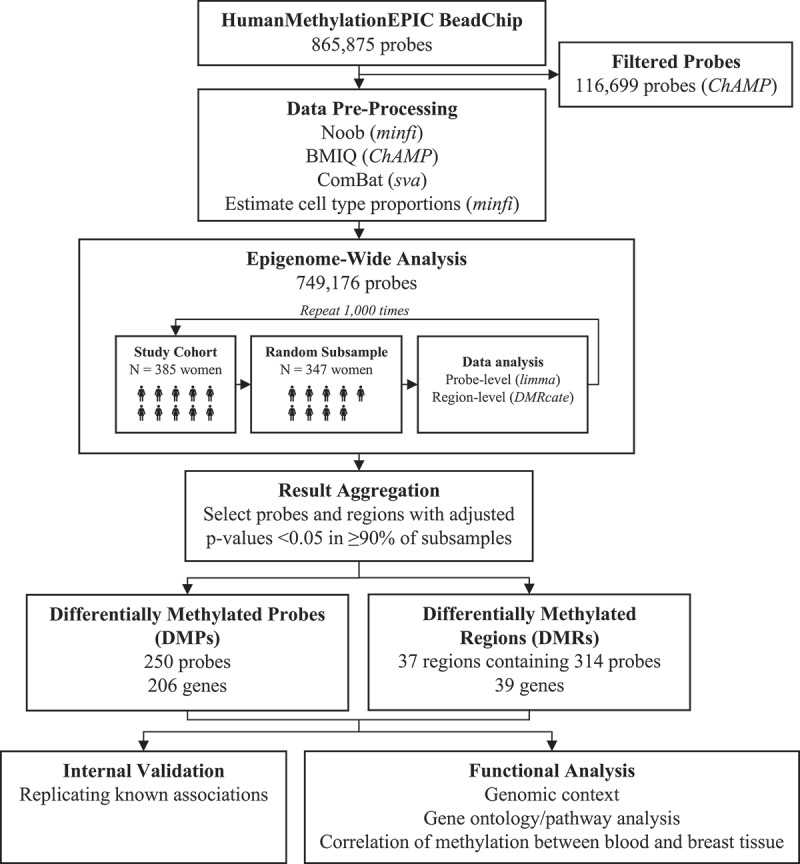
Methods: White blood cell DNA methylation was measured for 385 postmenopausal women using the Illumina Infinium MethylationEPIC BeadChip array. Differential methylation was assessed using genome-wide, probe-level, and regional analyses. We implemented a resampling-based approach to improve the stability of our findings.
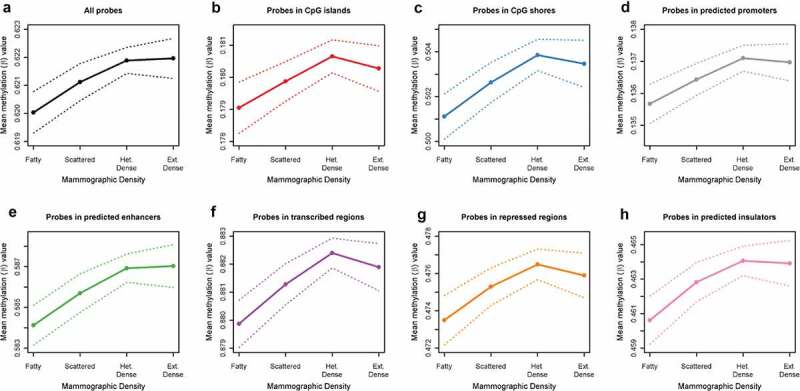
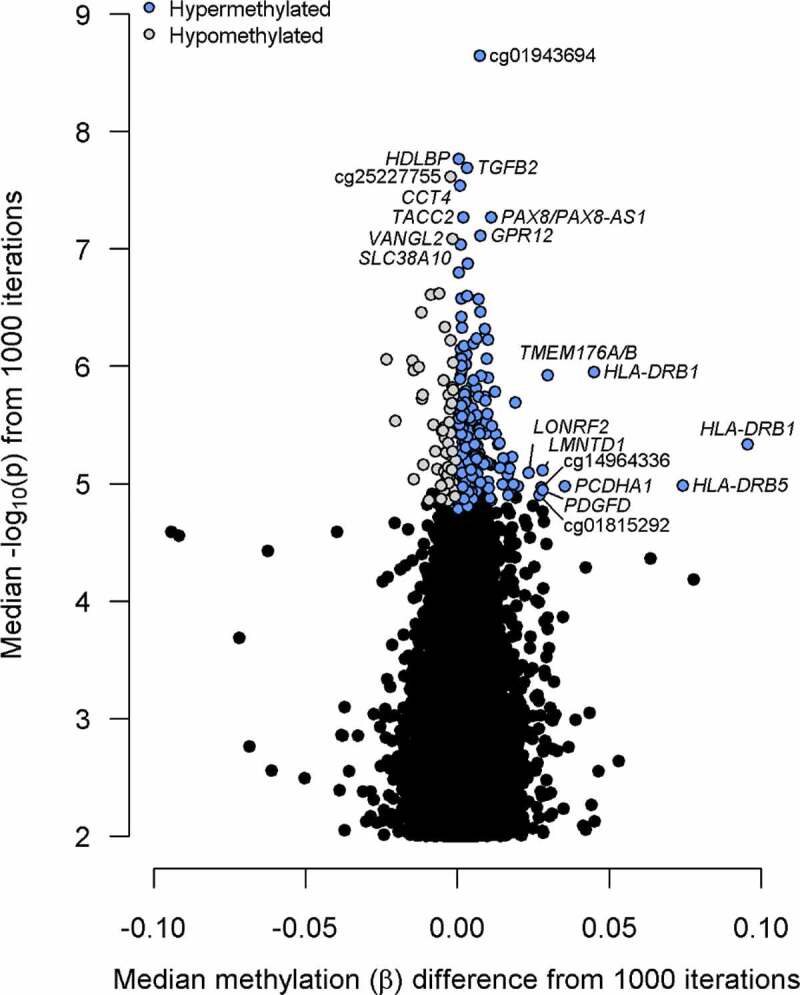
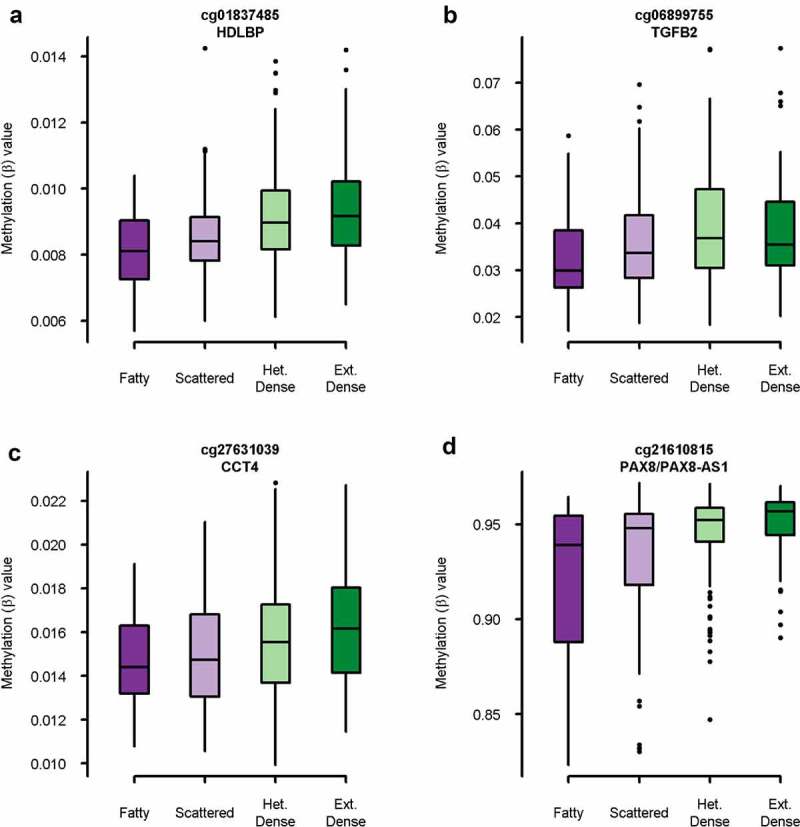
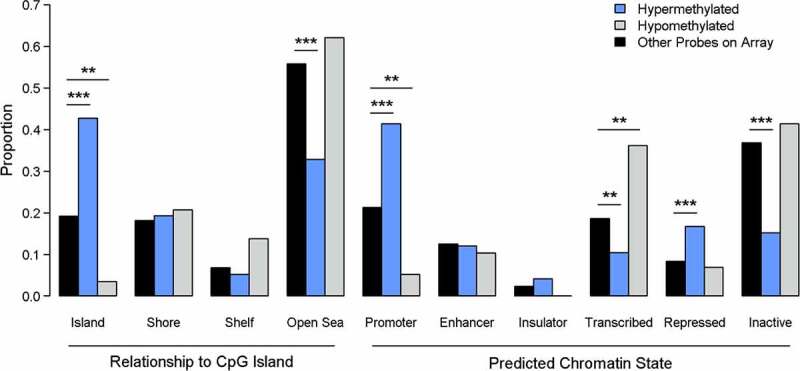
Results: On average, women with elevated mammographic density exhibited DNA hypermethylation within CpG islands and gene promoters compared to women with lower mammographic density. We identified 250 CpG sites for which DNA methylation was significantly associated with mammographic density. The top sites were located within genes associated with cancer, including HDLBP, TGFB2, CCT4, and PAX8, and were more likely to be located in regulatory regions of the genome. We also identified differential DNA methylation in 37 regions, including within the promoters of PAX8 and PF4, a gene involved in the regulation of angiogenesis. Overall, our results paint a picture of epigenetic dysregulation associated with mammographic density.
Conclusion: Mammographic density is associated with differential DNA methylation throughout the genome, including within genes associated with cancer. Our results suggest the potential involvement of several genes in the biological mechanisms behind differences in breast density between women. Further studies are warranted to explore these potential mechanisms and potential links to breast cancer risk.
Keywords: DNA methylation; breast cancer; epigenetics; epigenome-wide association study; illumina epic array; mammographic density; postmenopausal.
Figures
References
-
- Noone AM, Howlader N, Krapcho M, et al., eds. SEER cancer statistics review, 1975-2015. National Cancer Institute, Bethesda, MD; 2018.
-
- Boyd NF, Dite GS, Stone J, et al. Heritability of mammographic density, a risk factor for breast cancer. N Engl J Med. 2002;347(12):886–894. - PubMed
-
- Brand JS, Humphreys K, Thompson DJ, et al. Volumetric mammographic density: heritability and association with breast cancer susceptibility loci. J Natl Cancer Inst. 2014;106(12):dju334–dju334. - PubMed
Publication types
MeSH terms
LinkOut - more resources
Full Text Sources
Medical
Miscellaneous